

Orioles vs Blue Jays Live Score (12 Sep, 2026)
Game Information
Stage
STD
Season
2026
First Pitch
Sat, Sep 12, 3:07 pm
Venue
Rogers Centre
Location
Toronto, Ontario
Venue Type
Indoor
Broadcast
MLB.TV
Attendance
41,949
Live Situation
0Balls
0Strikes
0Outs
—Pitcher
—At Bat
Pitch Sequence
1
BALL IN PLAY
Knuckle Curve
87 MPH
Injury Report
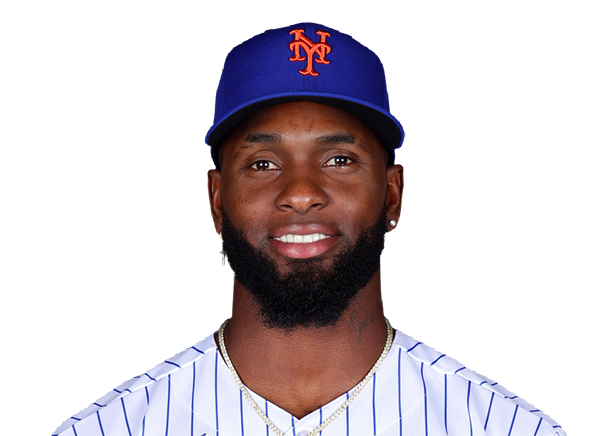
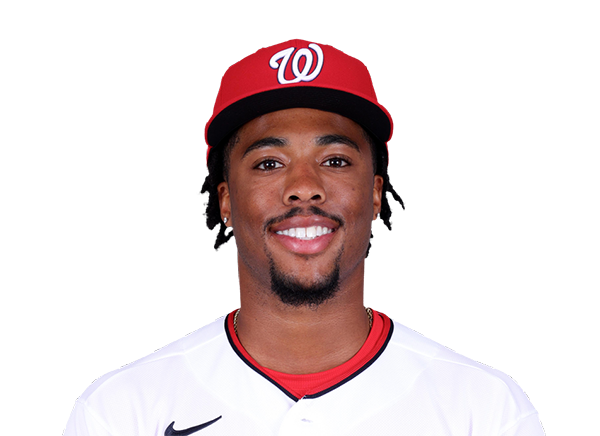




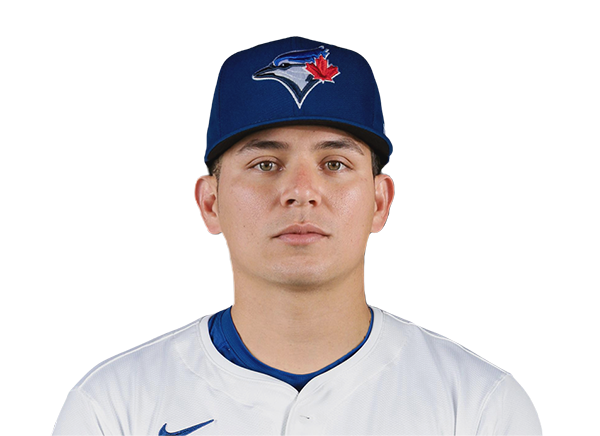


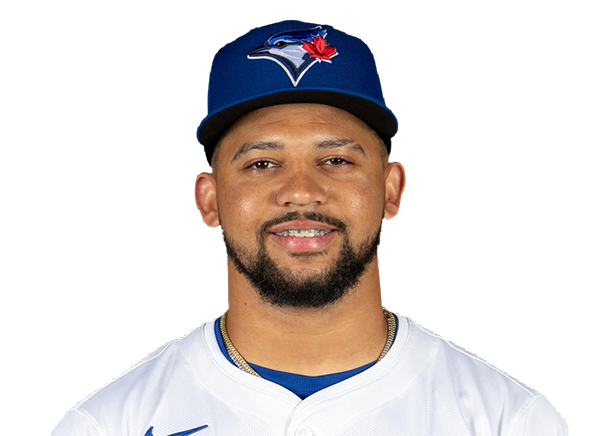
Team Stats
 BAL
TOR


3
Runs
7
6
Hits
11
0
Errors
3
1
Home Runs
2
4
Walks
5
11
Strikeouts
10
Player Box Score
Baltimore Orioles
| Player | H-AB | AB | R | H | RBI | HR | BB | K | #P | AVG | OBP | SLG |
|---|---|---|---|---|---|---|---|---|---|---|---|---|
 Dylan Beavers | 0-5 | 5 | 0 | 0 | 0 | 0 | 0 | 2 | 21 | .242 | .316 | .384 |
 Pete Alonso | 1-3 | 3 | 1 | 1 | 2 | 1 | 2 | 0 | 21 | .266 | .362 | .498 |
 Jackson Holliday | 0-4 | 4 | 0 | 0 | 0 | 0 | 0 | 1 | 11 | .228 | .301 | .342 |
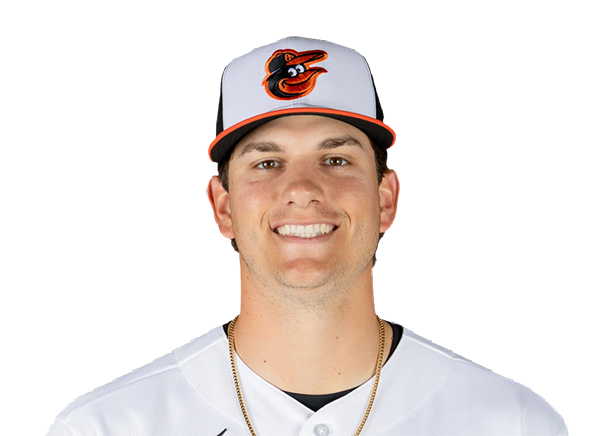 Coby Mayo | 1-4 | 4 | 0 | 1 | 0 | 0 | 0 | 0 | 19 | .223 | .289 | .466 |
 Gunnar Henderson | 1-3 | 3 | 1 | 1 | 0 | 0 | 1 | 0 | 17 | .222 | .305 | .397 |
 Christian Encarnacion-Strand | 0-3 | 3 | 0 | 0 | 0 | 0 | 1 | 0 | 14 | .263 | .318 | .474 |
 Heston Kjerstad | 0-2 | 2 | 0 | 0 | 0 | 0 | 0 | 2 | 8 | .182 | .182 | .182 |
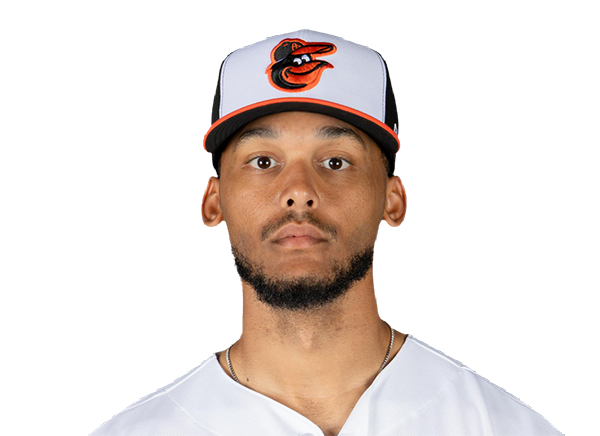 Jeremiah Jackson | 1-2 | 2 | 0 | 1 | 0 | 0 | 0 | 1 | 8 | .229 | .257 | .363 |
 Colton Cowser | 1-2 | 2 | 0 | 1 | 0 | 0 | 0 | 1 | 8 | .216 | .309 | .368 |
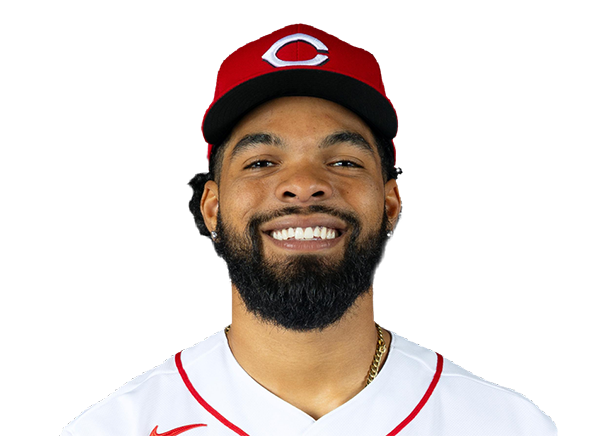 Rece Hinds | 0-1 | 1 | 0 | 0 | 0 | 0 | 0 | 0 | 1 | .159 | .220 | .250 |
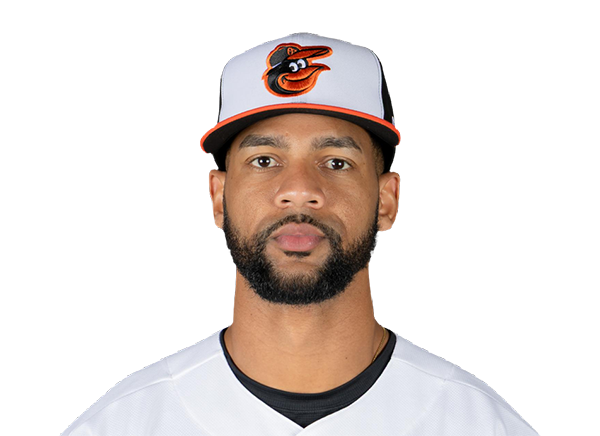 Leody Taveras | 0-1 | 1 | 0 | 0 | 0 | 0 | 0 | 1 | 4 | .218 | .290 | .347 |
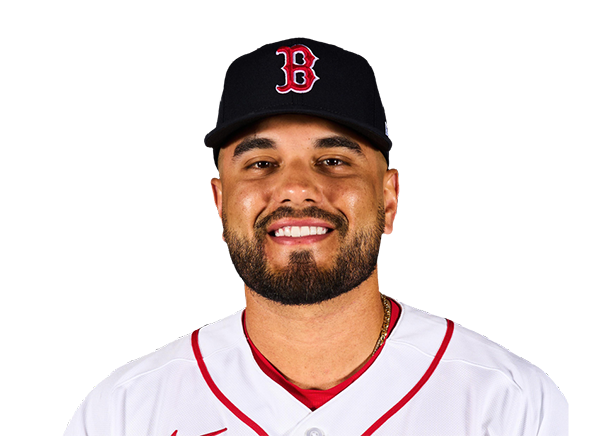 Carlos Narvaez | 0-2 | 2 | 0 | 0 | 0 | 0 | 0 | 2 | 7 | .165 | .244 | .232 |
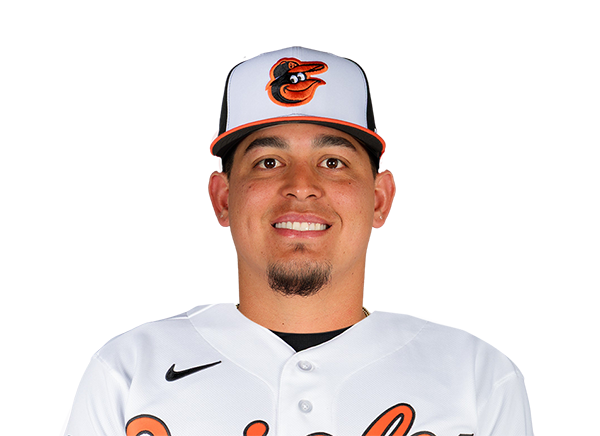 Yohel Pozo | 1-1 | 1 | 1 | 1 | 0 | 0 | 0 | 0 | 3 | .265 | .275 | .347 |
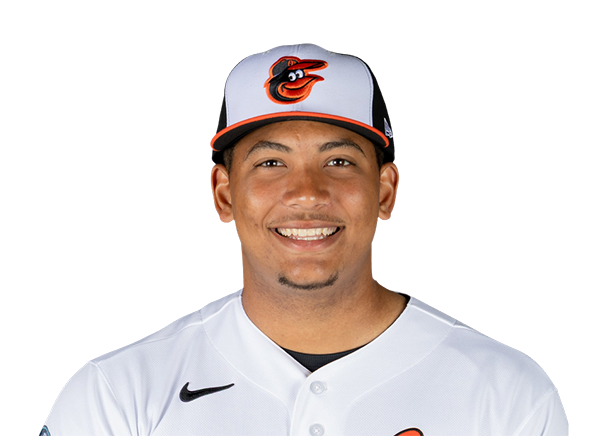 Samuel Basallo | 0-1 | 1 | 0 | 0 | 0 | 0 | 0 | 1 | 6 | .227 | .298 | .413 |
Toronto Blue Jays
| Player | H-AB | AB | R | H | RBI | HR | BB | K | #P | AVG | OBP | SLG |
|---|---|---|---|---|---|---|---|---|---|---|---|---|
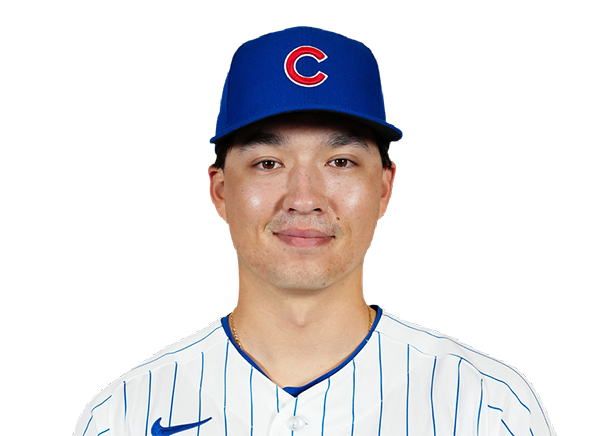 Brett Bateman | 1-4 | 4 | 2 | 1 | 1 | 1 | 1 | 2 | 28 | .336 | .401 | .443 |
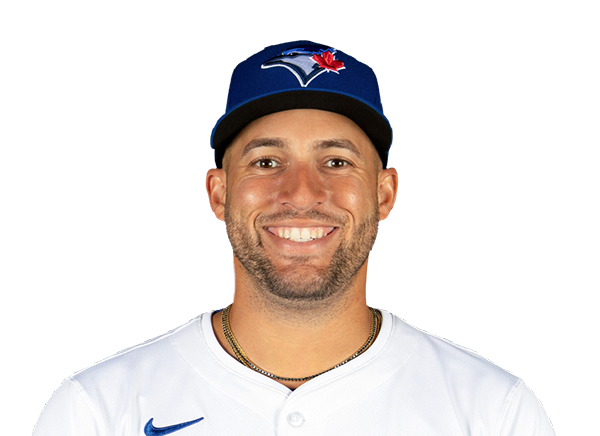 George Springer | 2-5 | 5 | 1 | 2 | 0 | 0 | 0 | 1 | 18 | .250 | .322 | .408 |
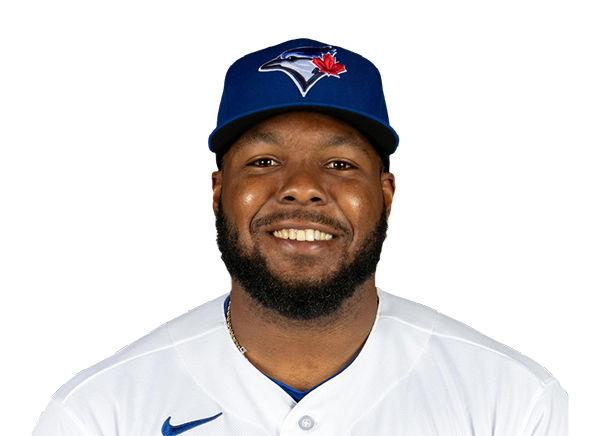 Vladimir Guerrero Jr. | 1-4 | 4 | 2 | 1 | 1 | 0 | 0 | 2 | 17 | .259 | .331 | .352 |
 Alejandro Kirk | 2-4 | 4 | 1 | 2 | 3 | 1 | 0 | 1 | 10 | .276 | .349 | .427 |
 Nathan Lukes | 1-4 | 4 | 0 | 1 | 0 | 0 | 0 | 1 | 22 | .273 | .321 | .389 |
 Kazuma Okamoto | 1-2 | 2 | 0 | 1 | 0 | 0 | 2 | 0 | 18 | .235 | .310 | .459 |
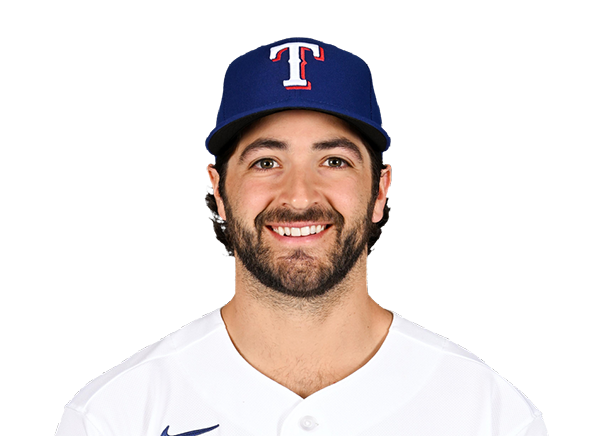 Josh Smith | 1-2 | 2 | 1 | 1 | 0 | 0 | 0 | 1 | 9 | .227 | .317 | .354 |
 Ernie Clement | 0-0 | 0 | 0 | 0 | 1 | 0 | 0 | 0 | 2 | .273 | .299 | .383 |
 Andres Gimenez | 2-4 | 4 | 0 | 2 | 1 | 0 | 0 | 1 | 10 | .245 | .290 | .362 |
 Rudy Martin Jr. | 0-2 | 2 | 0 | 0 | 0 | 0 | 1 | 1 | 10 | .000 | .333 | .000 |
 Myles Straw | 0-0 | 0 | 0 | 0 | 0 | 0 | 1 | 0 | 9 | .236 | .301 | .346 |
Baltimore Orioles
| Player | IP | H | R | ER | BB | K | HR | PC-ST | ERA | PC |
|---|---|---|---|---|---|---|---|---|---|---|
 Kyle Bradish | 3.0 | 8 | 5 | 5 | 2 | 2 | 2 | 56-37 | 4.12 | 56 |
 Grant Wolfram | 1.0 | 0 | 0 | 0 | 0 | 2 | 0 | 20-15 | 4.75 | 20 |
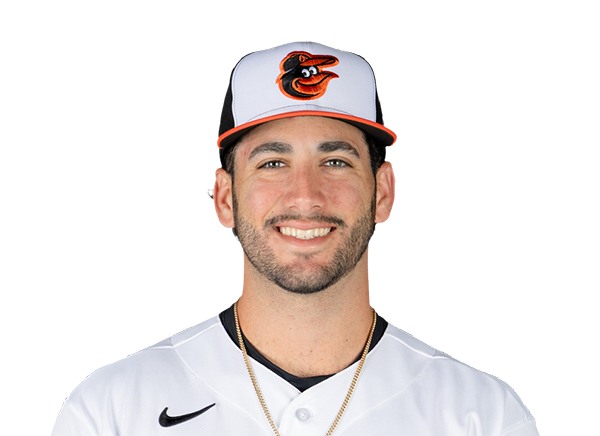 Anthony Nunez | 1.2 | 1 | 1 | 1 | 1 | 4 | 0 | 34-21 | 4.07 | 34 |
 Cam Sanders | 0.2 | 2 | 1 | 1 | 1 | 0 | 0 | 23-11 | 5.00 | 23 |
|
Luis De Leon | 1.2 | 0 | 0 | 0 | 1 | 2 | 0 | 20-15 | 3.38 | 20 |
Toronto Blue Jays
| Player | IP | H | R | ER | BB | K | HR | PC-ST | ERA | PC |
|---|---|---|---|---|---|---|---|---|---|---|
 Spencer Miles | 2.0 | 1 | 0 | 0 | 2 | 5 | 0 | 44-30 | 2.71 | 44 |
 Joe Mantiply | 1.0 | 0 | 0 | 0 | 0 | 0 | 0 | 8-3 | 2.19 | 8 |
 Spencer Arrighetti | 2.2 | 2 | 1 | 0 | 2 | 2 | 0 | 50-26 | 4.99 | 50 |
 Mason Fluharty | 0.2 | 2 | 1 | 1 | 0 | 1 | 0 | 12-9 | 3.41 | 12 |
 Paul Sewald | 0.2 | 1 | 1 | 1 | 0 | 0 | 1 | 11-9 | 5.11 | 11 |
 Tyler Rogers | 1.0 | 0 | 0 | 0 | 0 | 1 | 0 | 9-8 | 1.76 | 9 |
 Louis Varland | 1.0 | 0 | 0 | 0 | 0 | 2 | 0 | 14-11 | 1.23 | 14 |
H2H / Season Series
TOR7–3
BAL
TOR4–7
BAL
TOR6–4
BAL
TOR6–4
BAL
TOR3–13
BAL
BAL9–5
TOR
BAL6–5
TOR
BAL5–6
TOR
BAL1–2
TOR
TOR2–3
BAL
Last 5 Games
| Date | Opponent | Result |
|---|---|---|
| Sep 12 | @ TOR | L3–7 |
| Sep 11 | @ TOR | W7–4 |
| Sep 9 |  vs CLE | W9–5 |
| Sep 8 | vs CLE | L5–9 |
| Sep 7 | vs CLE | W6–4 |
| Date | Opponent | Result |
|---|---|---|
| Sep 12 | vs BAL | W7–3 |
| Sep 11 | vs BAL | L4–7 |
| Sep 9 |  @ ATH | L0–2 |
| Sep 8 | @ ATH | W4–2 |
| Sep 7 | @ ATH | L5–6 |
Standings
American League
| Team | W | L | PCT | GB | DIFF | STRK |
|---|---|---|---|---|---|---|
1 Rays | 89 | 59 | .601 | - | +59 | W2 |
2 White Sox | 76 | 72 | .514 | 13 | +36 | W1 |
3 Astros | 75 | 74 | .503 | 14.5 | -43 | L2 |
4 Yankees | 85 | 63 | .574 | 4 | +123 | L1 |
5 Red Sox | 81 | 68 | .544 | 8.5 | +85 | W1 |
| 6Guardians | 75 | 74 | .503 | 14.5 | -14 | L1 |
| 7Blue Jays | 74 | 75 | .497 | 15.5 | -38 | W1 |
8 Rangers | 73 | 76 | .490 | 16.5 | -45 | W1 |
| 9Orioles | 72 | 77 | .483 | 17.5 | -28 | L1 |
10 Twins | 70 | 78 | .473 | 19 | -55 | W1 |
11 Mariners | 70 | 79 | .470 | 19.5 | -57 | W1 |
12 Tigers | 69 | 79 | .466 | 20 | +63 | W3 |
13 Royals | 66 | 83 | .443 | 23.5 | -91 | L1 |
| 14Athletics | 60 | 89 | .403 | 29.5 | -204 | L1 |
15 Angels | 56 | 92 | .378 | 33 | -75 | L2 |
National League
| Team | W | L | PCT | GB | DIFF | STRK |
|---|---|---|---|---|---|---|
1 Brewers | 93 | 56 | .624 | - | +196 | W5 |
2 Dodgers | 90 | 58 | .608 | 2.5 | +172 | L1 |
3 Braves | 88 | 61 | .591 | 5 | +121 | W3 |
4 Cubs | 83 | 66 | .557 | 10 | +139 | W2 |
5 Phillies | 82 | 67 | .550 | 11 | +26 | L3 |
6 Padres | 80 | 68 | .541 | 12.5 | +20 | W6 |
7 Diamondbacks | 79 | 70 | .530 | 14 | +3 | L1 |
8 Pirates | 74 | 75 | .497 | 19 | +25 | L2 |
9 Marlins | 73 | 76 | .490 | 20 | +4 | W1 |
10 Cardinals | 73 | 76 | .490 | 20 | -9 | L1 |
11 Reds | 69 | 79 | .466 | 23.5 | -146 | L5 |
12 Mets | 69 | 79 | .466 | 23.5 | -32 | W1 |
13 Nationals | 69 | 81 | .460 | 24.5 | +2 | W2 |
14 Giants | 62 | 87 | .416 | 31 | -75 | L2 |
15 Rockies | 55 | 93 | .372 | 37.5 | -162 | L6 |
BAL
VS
TOR
Pitchers
Kyle Bradish
Catchers
Carlos Narvaez
Infielders
Pete Alonso
Jackson Holliday
Gunnar Henderson
Christian Encarnacion-Strand
Outfielders
Dylan Beavers
Heston Kjerstad
Colton Cowser
Designated Hitters
Coby Mayo
Pitchers
Spencer Miles
Catchers
Alejandro Kirk
Infielders
Vladimir Guerrero Jr.
Kazuma Okamoto
Josh Smith
Andres Gimenez
Outfielders
Brett Bateman
Nathan Lukes
Rudy Martin
Designated Hitters
George Springer
Orioles
VS
Blue Jays
Batting
149
Team Games Played
149
4965
At Bats
5028
1163
Hits
1250
647
Runs Batted In
571
179
Home Runs
144
74
Stolen Bases
72
.234
Batting Average
.249
671
Runs
600
219
Doubles
237
19
Triples
8
1957
Total Bases
1935
550
Walks
415
1384
Strikeouts
1072
.316
On Base Percentage
.310
.394
Slugging Percentage
.385
.710
OBP Pct + SLG Pct
.695
149
Games Played
149
149
Games Started
149
58
Hit By Pitch
55
0.0
Wins Above Replacement
0.0
0.0
Offensive Wins Above Replacement
0.0
32
Caught Stealing
16
1
Is Qualified
1
627.4
Runs Created
603.0
4.3
Runs Created Per 27 Outs
4.1
.098
Walks Per Plate Appearance
.075
0.40
Walk To Strikeout Ratio
0.39
.160
Isolated Power
.136
.279
Secondary Average
.230
3.98
Pitches Per Plate Appearance
3.80
417
Extra Base Hits
389
5627
Plate Appearances
5570
27.7
At Bats Per Home Run
34.9
17
Sacrifice Hit
23
35
Sacrifice Flies
46
Pitching
149
Team Games Played
149
57
Quality Starts
45
72
Wins
74
77
Losses
75
42
Saves
50
79
Holds
93
1293
Hits
1169
615
Earned runs
576
161
Home Runs
156
493
Walks
541
1201
Strikeouts
1291
8.1
Strikeouts Per 9 Innings
8.8
146.3
Pitches Per Start
148.5
1.35
Walks Plus Hits Per Inning Pitched
1.29
4.17
Earned Run Average
3.92
77
Losses
75
1327.1
Innings pitched
1324.0
.483
Win Percentage
.497
63
Save Opportunities
65
.254
Opponent Batting Average
.236
.323
Opponent's On-base pct.
.313
.409
Opponent's Slugging pct.
.372
.732
Opponent's OPB Pct + SLG Pct
.686
5090
At Bats
4962
252
Doubles
193
26
Triples
9
49
Batters Hit
40
78
Stolen Bases
137
149
Games Played
149
1
Complete Games
1
2
Shutouts
11
43
Wild Pitches
48
670
Runs Batted In
604
3
Balks
8
1327.1
Innings pitched
1324.0
8.1
Strikeouts Per 9 Innings
8.8
34
Caught Stealing
42
149
Games Started
149
0.0
Wins Above Replacement
0.0
1
Is Qualified
1
699
Runs
638
615
Earned Runs
576
2080
Total Bases
1848
Fielding
149
Team Games Played
149
1327
Full Innings
1324
5342
Total Chances
5314
3982
Putouts
3972
1270
Assists
1253
90
Errors
89
219
Double Plays
237
0.983
Fielding Percentage
0.983
35.6
Range Factor
35.5
0.0
Zone Rating
0.0
149
Games Played
149
0
Games Started
0
0.0
Defensive Wins Above Replacement
0.0
1
Qualified
1