

Orioles vs Pirates Live Score (4 Apr, 2026)
Game Information
Stage
Standard
Season
2026
First Pitch
Sat, Apr 4, 4:05 pm
Venue
PNC Park
Location
Pittsburgh, Pennsylvania
Attendance
27,949
Live Situation
3Balls
2Strikes
0Outs
—Pitcher
—At Bat
Pitch Sequence
1
BALL
Slider
88 MPH
2
STRIKE SWINGING
Slider
88 MPH
3
STRIKE FOUL
Four-seam FB
100 MPH
4
BALL
Slider
87 MPH
5
STRIKE FOUL
Slider
89 MPH
6
STRIKE FOUL
Four-seam FB
99 MPH
7
BALL
Four-seam FB
99 MPH
8
BALL IN PLAY
Slider
89 MPH
Injury Report


Team Stats
 BAL
PIT


2
Runs
3
6
Hits
8
1
Errors
0
0
Home Runs
0
7
Walks
6
8
Strikeouts
7
Player Box Score
Baltimore Orioles
| Player | H-AB | AB | R | H | RBI | HR | BB | K | #P | AVG | OBP | SLG |
|---|---|---|---|---|---|---|---|---|---|---|---|---|
 Taylor Ward | 0-4 | 4 | 0 | 0 | 0 | 0 | 1 | 1 | 24 | .290 | .395 | .387 |
 Gunnar Henderson | 1-3 | 3 | 1 | 1 | 0 | 0 | 2 | 1 | 24 | .242 | .342 | .485 |
 Pete Alonso | 0-4 | 4 | 0 | 0 | 0 | 0 | 0 | 2 | 13 | .226 | .314 | .323 |
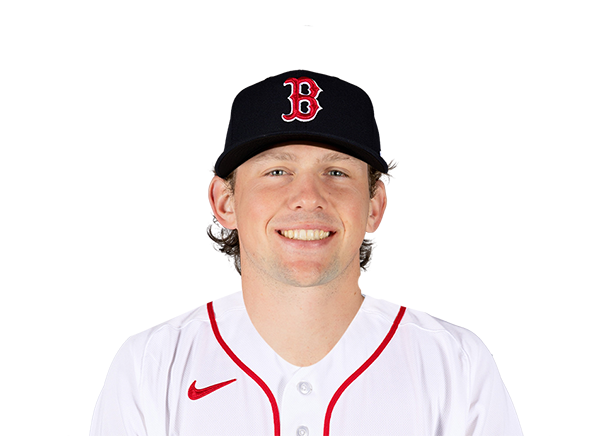 Adley Rutschman | 2-4 | 4 | 1 | 2 | 0 | 0 | 0 | 0 | 16 | .333 | .440 | .524 |
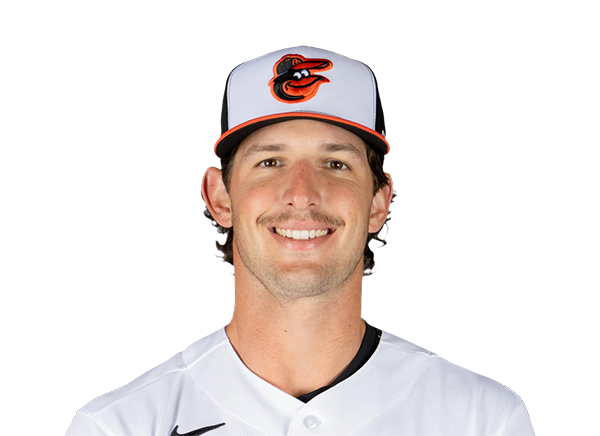 Dylan Beavers | 1-4 | 4 | 0 | 1 | 1 | 0 | 0 | 1 | 11 | .318 | .318 | .500 |
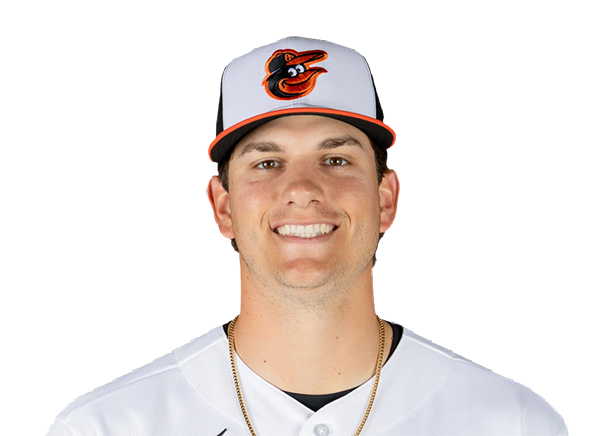 Coby Mayo | 1-3 | 3 | 0 | 1 | 0 | 0 | 1 | 1 | 22 | .150 | .292 | .200 |
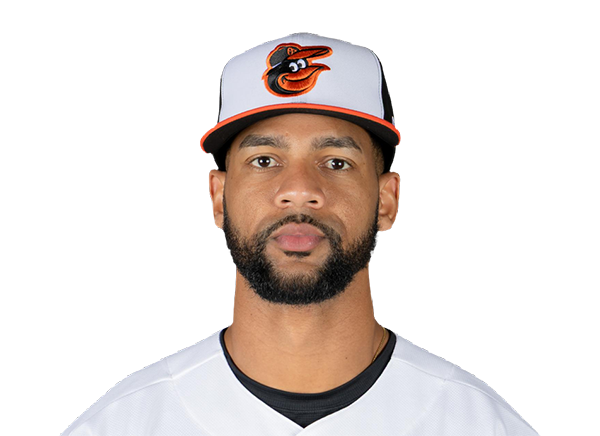 Leody Taveras | 1-2 | 2 | 0 | 1 | 1 | 0 | 2 | 0 | 16 | .500 | .700 | .667 |
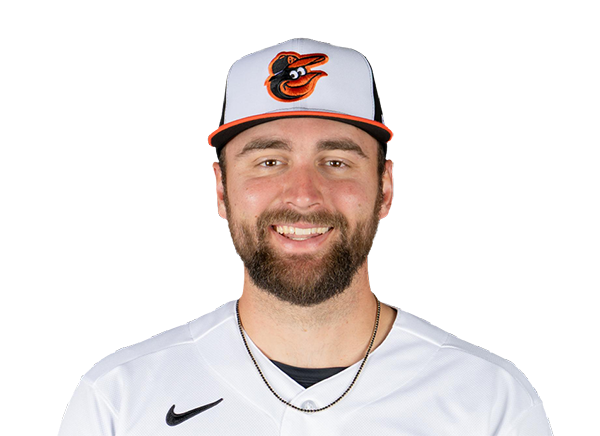 Colton Cowser | 0-2 | 2 | 0 | 0 | 0 | 0 | 0 | 2 | 8 | .235 | .333 | .294 |
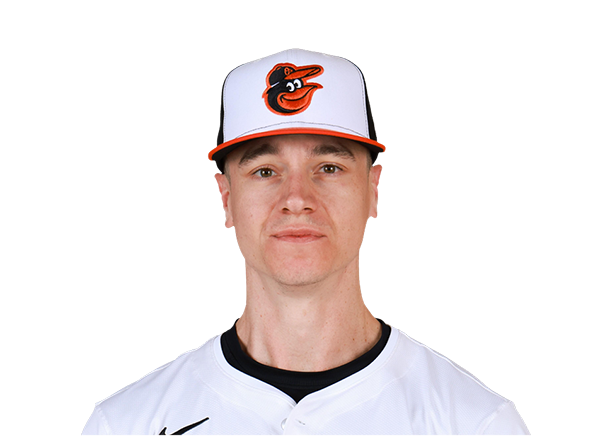 Tyler O'Neill | 0-2 | 2 | 0 | 0 | 0 | 0 | 0 | 0 | 5 | .125 | .263 | .313 |
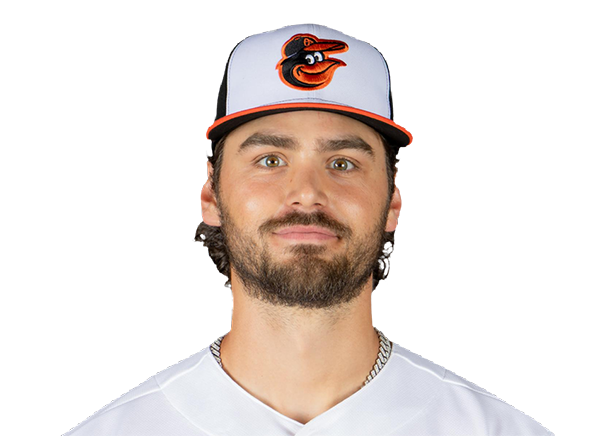 Blaze Alexander | 0-3 | 3 | 0 | 0 | 0 | 0 | 1 | 0 | 20 | .333 | .368 | .333 |
Pittsburgh Pirates
| Player | H-AB | AB | R | H | RBI | HR | BB | K | #P | AVG | OBP | SLG |
|---|---|---|---|---|---|---|---|---|---|---|---|---|
 Oneil Cruz | 1-4 | 4 | 0 | 1 | 0 | 0 | 1 | 1 | 22 | .290 | .333 | .581 |
 Brandon Lowe | 0-4 | 4 | 0 | 0 | 0 | 0 | 1 | 1 | 20 | .280 | .419 | .720 |
 Bryan Reynolds | 3-4 | 4 | 2 | 3 | 0 | 0 | 1 | 1 | 25 | .265 | .324 | .471 |
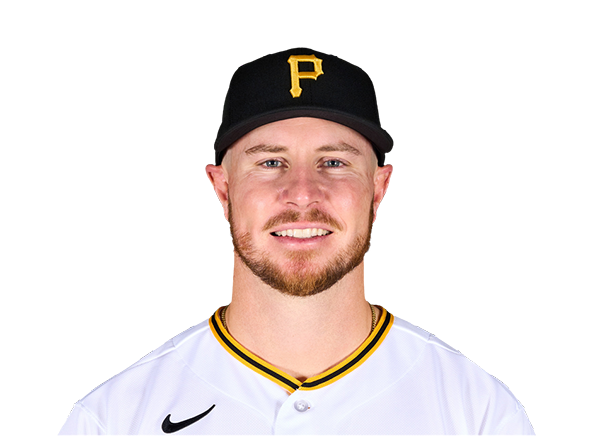 Ryan O'Hearn | 1-4 | 4 | 0 | 1 | 0 | 0 | 1 | 1 | 18 | .360 | .469 | .600 |
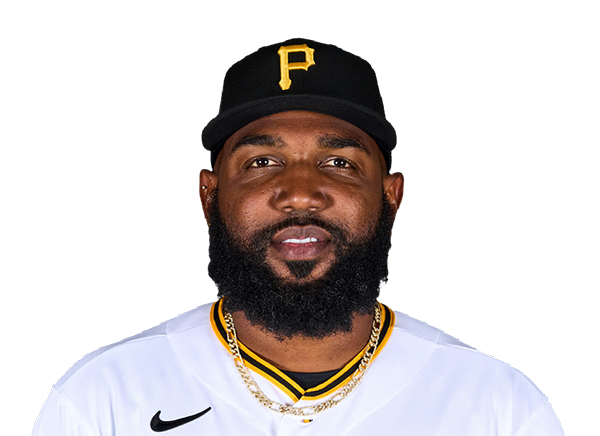 Marcell Ozuna | 1-4 | 4 | 0 | 1 | 0 | 0 | 0 | 2 | 14 | .074 | .194 | .074 |
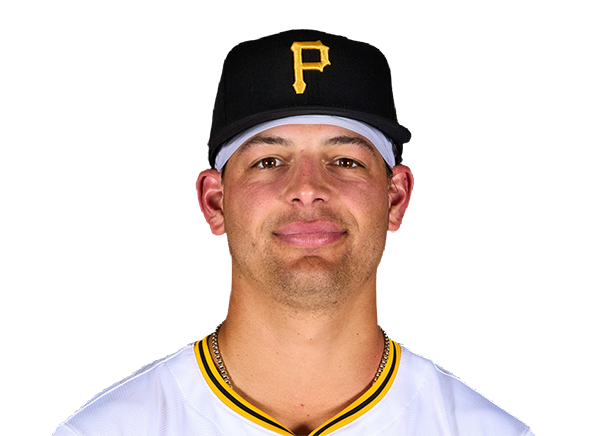 Nick Yorke | 1-1 | 1 | 1 | 1 | 1 | 0 | 0 | 0 | 8 | .273 | .438 | .364 |
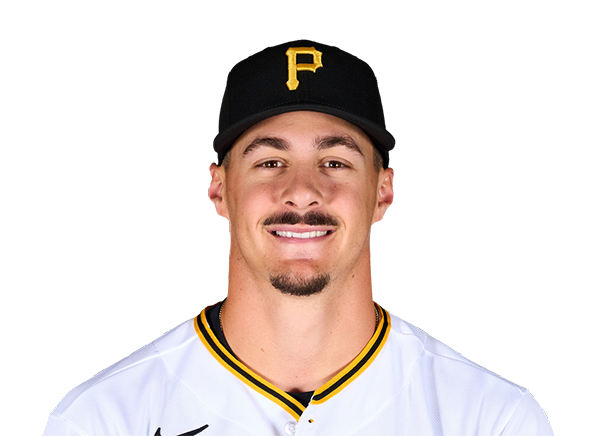 Konnor Griffin | 0-3 | 3 | 0 | 0 | 0 | 0 | 0 | 0 | 17 | .167 | .375 | .333 |
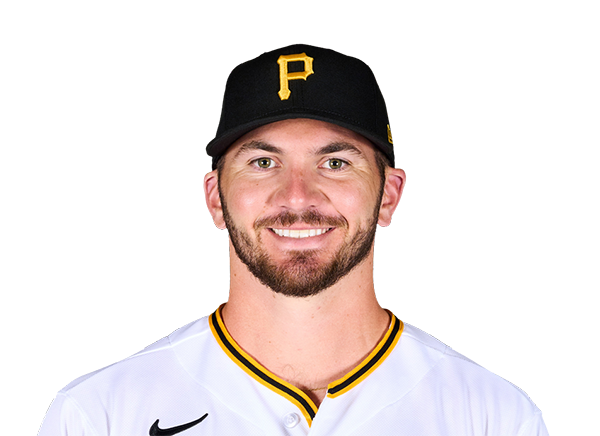 Spencer Horwitz | 1-3 | 3 | 0 | 1 | 1 | 0 | 0 | 0 | 12 | .143 | .208 | .190 |
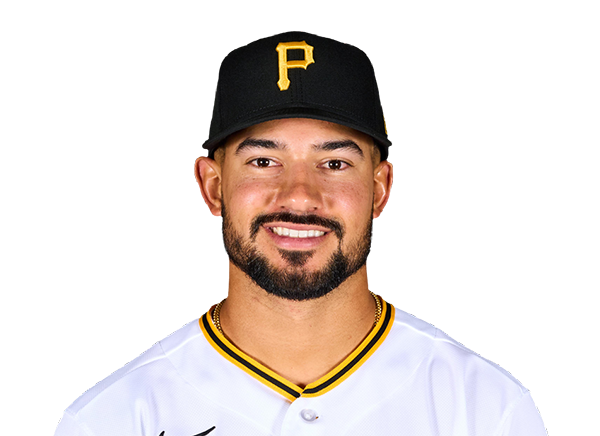 Nick Gonzales | 0-2 | 2 | 0 | 0 | 0 | 0 | 2 | 0 | 22 | .310 | .375 | .379 |
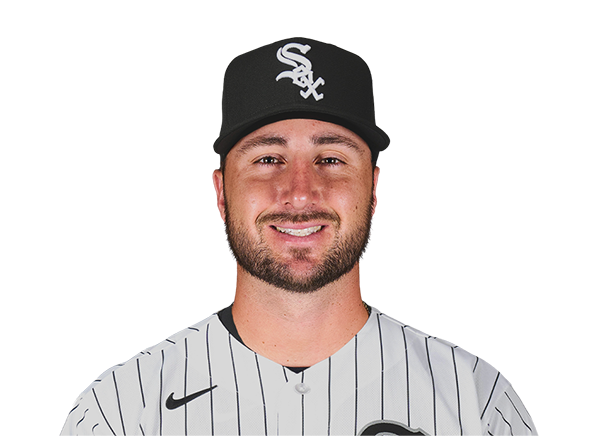 Joey Bart | 0-3 | 3 | 0 | 0 | 0 | 0 | 0 | 1 | 8 | .125 | .222 | .125 |
 Jake Mangum | 0-1 | 1 | 0 | 0 | 0 | 0 | 0 | 0 | 3 | .158 | .200 | .211 |
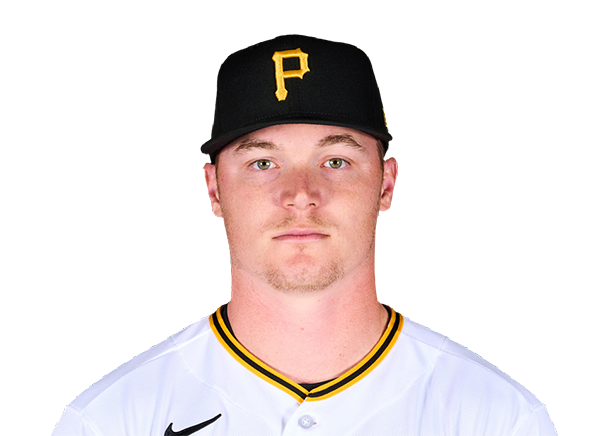 Henry Davis | 0-0 | 0 | 0 | 0 | 0 | 0 | 0 | 0 | 0 | .176 | .300 | .294 |
Baltimore Orioles
| Player | IP | H | R | ER | BB | K | HR | PC-ST | ERA | PC |
|---|---|---|---|---|---|---|---|---|---|---|
 Shane Baz | 5.2 | 4 | 1 | 1 | 3 | 5 | 0 | 98-63 | 4.09 | 98 |
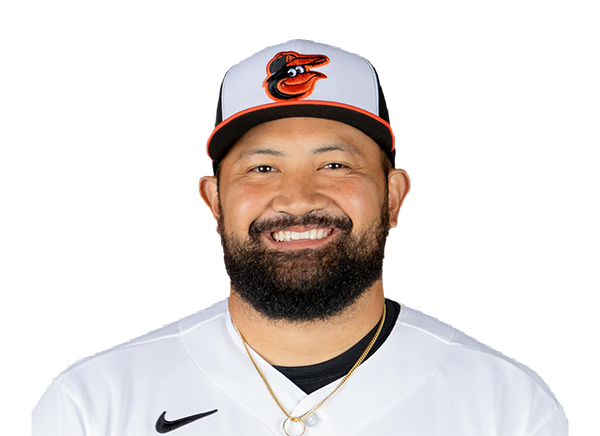 Rico Garcia | 0.1 | 0 | 0 | 0 | 1 | 0 | 0 | 10-5 | 0.00 | 10 |
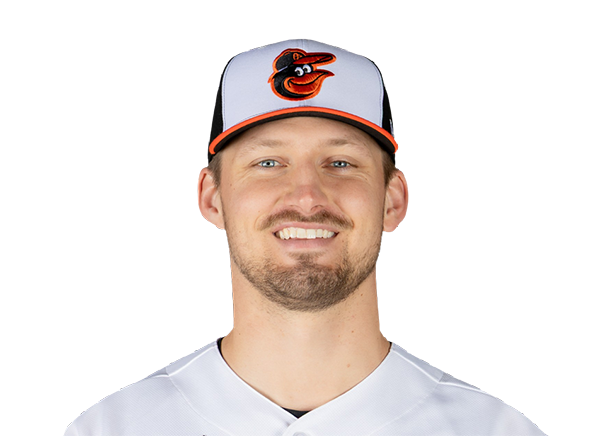 Grant Wolfram | 1.0 | 1 | 0 | 0 | 0 | 2 | 0 | 21-12 | 5.40 | 21 |
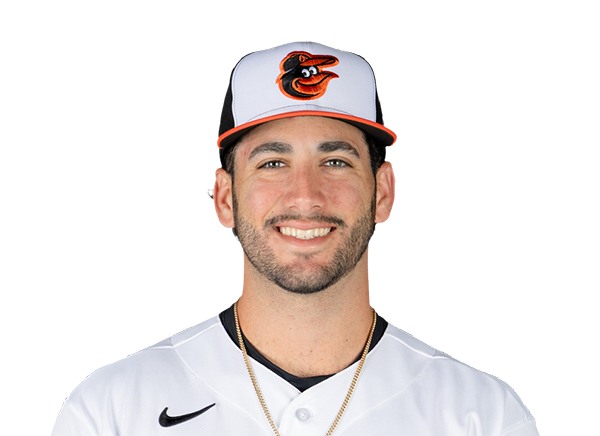 Anthony Nunez | 1.0 | 1 | 1 | 0 | 1 | 0 | 0 | 27-13 | 1.80 | 27 |
 Ryan Helsley | 0.1 | 2 | 1 | 1 | 1 | 0 | 0 | 13-9 | 3.86 | 13 |
Pittsburgh Pirates
| Player | IP | H | R | ER | BB | K | HR | PC-ST | ERA | PC |
|---|---|---|---|---|---|---|---|---|---|---|
 Carmen Mlodzinski | 4.2 | 5 | 2 | 2 | 3 | 5 | 0 | 84-49 | 4.00 | 84 |
 Hunter Barco | 2.1 | 0 | 0 | 0 | 3 | 1 | 0 | 45-22 | 6.75 | 45 |
 Isaac Mattson | 1.0 | 1 | 0 | 0 | 1 | 1 | 0 | 17-9 | 3.60 | 17 |
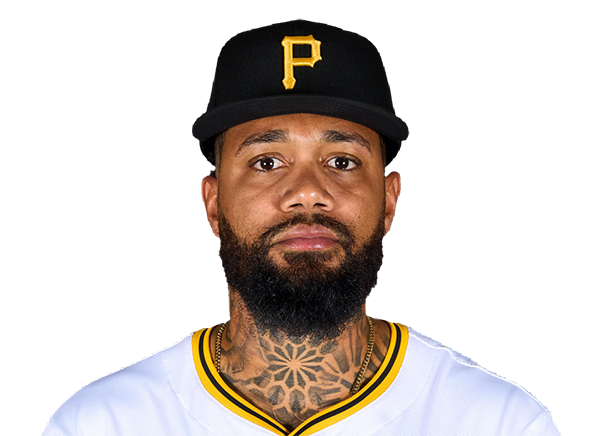 Dennis Santana | 1.0 | 0 | 0 | 0 | 0 | 1 | 0 | 13-10 | 0.00 | 13 |
H2H / Season Series
PIT8–2
BAL
PIT3–2
BAL
PIT5–4
BAL
BAL5–2
PIT
PIT8–6
BAL
BAL7–2
PIT
PIT6–1
BAL
BAL2–8
PIT
Last 5 Games
| Date | Opponent | Result |
|---|---|---|
| Aug 22 |  vs TB | W3–2 |
| Aug 21 | vs TB | W5–3 |
| Aug 20 |  vs NYY | L1–6 |
| Aug 19 | vs NYY | L3–5 |
| Aug 18 | vs NYY | L1–3 |
| Date | Opponent | Result |
|---|---|---|
| Aug 22 |  @ LAD | L3–4 |
| Aug 21 | @ LAD | L4–5 |
| Aug 19 |  vs DET | W4–3 |
| Aug 18 | vs DET | W4–1 |
| Aug 17 | vs DET | L5–8 |
Standings
American League
| Team | W | L | PCT | GB | DIFF | STRK |
|---|---|---|---|---|---|---|
| 1Rays | 76 | 53 | .589 | - | +42 | L3 |
2 White Sox | 67 | 62 | .519 | 9 | +42 | L1 |
3 Astros | 65 | 65 | .500 | 11.5 | -43 | L1 |
| 4Yankees | 73 | 56 | .566 | 3 | +95 | L1 |
5 Red Sox | 70 | 59 | .543 | 6 | +98 | W2 |
6 Rangers | 64 | 66 | .492 | 12.5 | -48 | L1 |
7 Guardians | 64 | 66 | .492 | 12.5 | -14 | W3 |
8 Blue Jays | 64 | 67 | .489 | 13 | -50 | W1 |
9 Twins | 63 | 67 | .485 | 13.5 | -47 | L2 |
| 10Orioles | 63 | 67 | .485 | 13.5 | -33 | W2 |
11 Mariners | 62 | 68 | .477 | 14.5 | -44 | W2 |
| 12Tigers | 61 | 68 | .473 | 15 | +77 | L4 |
13 Royals | 57 | 74 | .435 | 20 | -95 | W7 |
14 Angels | 52 | 78 | .400 | 24.5 | -68 | W1 |
15 Athletics | 50 | 80 | .385 | 26.5 | -188 | W1 |
National League
| Team | W | L | PCT | GB | DIFF | STRK |
|---|---|---|---|---|---|---|
1 Brewers | 81 | 49 | .623 | - | +163 | W3 |
| 2Dodgers | 79 | 51 | .608 | 2 | +147 | W5 |
3 Braves | 75 | 55 | .577 | 6 | +108 | L2 |
4 Cubs | 74 | 56 | .569 | 7 | +98 | L3 |
5 Phillies | 72 | 58 | .554 | 9 | +25 | W8 |
6 Padres | 70 | 60 | .538 | 11 | +9 | W2 |
7 Diamondbacks | 68 | 62 | .523 | 13 | +7 | L1 |
8 Marlins | 66 | 64 | .508 | 15 | +17 | W2 |
9 Cardinals | 66 | 65 | .504 | 15.5 | 0 | L2 |
| 10Pirates | 63 | 68 | .481 | 18.5 | +29 | L2 |
11 Reds | 62 | 68 | .477 | 19 | -92 | W1 |
12 Nationals | 61 | 70 | .466 | 20.5 | +14 | L3 |
13 Mets | 59 | 71 | .454 | 22 | -39 | W1 |
14 Giants | 52 | 77 | .403 | 28.5 | -79 | L3 |
15 Rockies | 50 | 79 | .388 | 30.5 | -131 | L5 |
BAL
VS
PIT
Pitchers
Shane Baz
Rico Garcia
Grant Wolfram
Anthony Nunez
Ryan Helsley
Catchers
Adley Rutschman
Infielders
Gunnar Henderson
Pete Alonso
Coby Mayo
Blaze Alexander
Outfielders
Dylan Beavers
Leody Taveras
Colton Cowser
Tyler O'Neill
Designated Hitters
Taylor Ward
Pitchers
Carmen Mlodzinski
Hunter Barco
Isaac Mattson
Dennis Santana
Catchers
Joey Bart
Henry Davis
Infielders
Brandon Lowe
Konnor Griffin
Spencer Horwitz
Nick Gonzales
Outfielders
Oneil Cruz
Bryan Reynolds
Ryan O'Hearn
Designated Hitters
Marcell Ozuna
Nick Yorke
Other Players
Jake Mangum
Orioles
VS
Pirates
Batting
130
Team Games Played
131
4318
At Bats
4514
1018
Hits
1150
562
Runs Batted In
623
158
Home Runs
156
68
Stolen Bases
108
.236
Batting Average
.255
582
Runs
653
187
Doubles
202
18
Triples
14
1715
Total Bases
1848
491
Walks
464
1197
Strikeouts
1237
.318
On Base Percentage
.331
.397
Slugging Percentage
.409
.716
OBP Pct + SLG Pct
.741
130
Games Played
131
130
Games Started
131
48
Hit By Pitch
69
0.0
Wins Above Replacement
0.0
0.0
Offensive Wins Above Replacement
0.0
29
Caught Stealing
20
1
Is Qualified
1
554.6
Runs Created
625.4
4.3
Runs Created Per 27 Outs
4.8
.100
Walks Per Plate Appearance
.091
0.41
Walk To Strikeout Ratio
0.38
.161
Isolated Power
.155
.284
Secondary Average
.277
4.00
Pitches Per Plate Appearance
3.91
363
Extra Base Hits
372
4907
Plate Appearances
5088
27.3
At Bats Per Home Run
28.9
16
Sacrifice Hit
8
32
Sacrifice Flies
30
Pitching
130
Team Games Played
131
51
Quality Starts
39
63
Wins
63
67
Losses
68
34
Saves
25
68
Holds
51
1125
Hits
1064
540
Earned runs
557
139
Home Runs
134
430
Walks
483
1035
Strikeouts
1220
8.1
Strikeouts Per 9 Innings
9.4
145.6
Pitches Per Start
150.9
1.34
Walks Plus Hits Per Inning Pitched
1.32
4.20
Earned Run Average
4.29
67
Losses
68
1156.2
Innings pitched
1168.1
.485
Win Percentage
.481
52
Save Opportunities
45
.254
Opponent Batting Average
.240
.322
Opponent's On-base pct.
.322
.409
Opponent's Slugging pct.
.390
.731
Opponent's OPB Pct + SLG Pct
.712
4431
At Bats
4437
226
Doubles
238
23
Triples
13
37
Batters Hit
71
69
Stolen Bases
80
130
Games Played
131
1
Complete Games
1
2
Shutouts
7
40
Wild Pitches
44
588
Runs Batted In
586
2
Balks
4
1156.2
Innings pitched
1168.1
8.1
Strikeouts Per 9 Innings
9.4
31
Caught Stealing
27
130
Games Started
131
0.0
Wins Above Replacement
0.0
1
Is Qualified
1
615
Runs
624
540
Earned Runs
557
1814
Total Bases
1730
Fielding
130
Team Games Played
131
1157
Full Innings
1168
4670
Total Chances
4613
3470
Putouts
3505
1118
Assists
1025
82
Errors
83
187
Double Plays
202
0.982
Fielding Percentage
0.982
35.7
Range Factor
34.9
0.0
Zone Rating
0.0
130
Games Played
131
0
Games Started
0
0.0
Defensive Wins Above Replacement
0.0
1
Qualified
1