

Orioles vs Rays Live Score (15 Aug, 2026)
Game Information
Stage
Standard
Season
2026
First Pitch
Sat, Aug 15, 6:10 pm
Venue
Tropicana Field
Location
St. Petersburg, Florida
Attendance
28,055
Live Situation
2Balls
3Strikes
0Outs
—Pitcher
—At Bat
Pitch Sequence
1
STRIKE LOOKING
Slider
86 MPH
2
STRIKE SWINGING
Changeup
91 MPH
3
BALL
Changeup
94 MPH
4
STRIKE FOUL
Changeup
93 MPH
5
STRIKE FOUL
Changeup
92 MPH
6
BALL
Slider
87 MPH
7
STRIKE FOUL
Changeup
91 MPH
8
STRIKE SWINGING
Four-seam FB
98 MPH
Injury Report




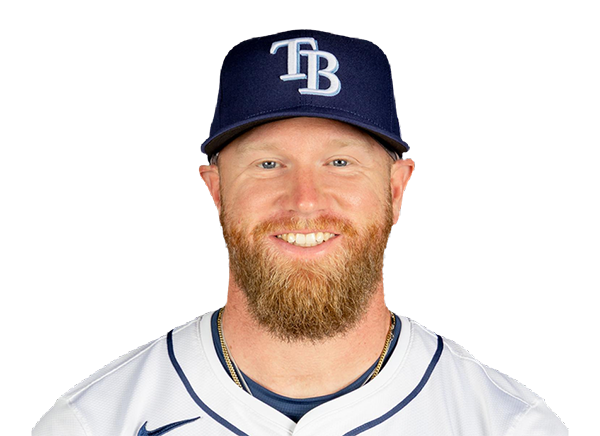
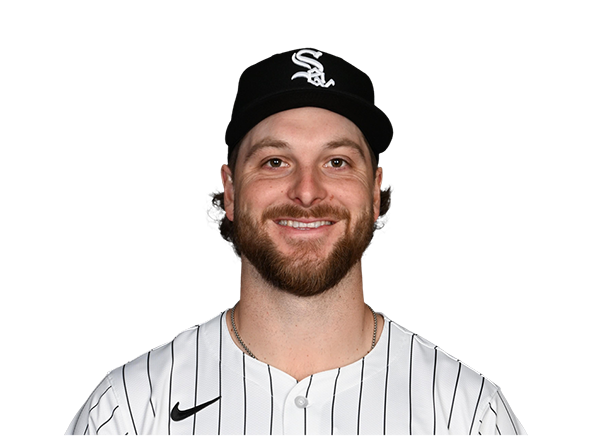
Team Stats
 BAL
TB


4
Runs
3
9
Hits
11
1
Errors
1
2
Home Runs
0
2
Walks
5
15
Strikeouts
5
Player Box Score
Baltimore Orioles
| Player | H-AB | AB | R | H | RBI | HR | BB | K | #P | AVG | OBP | SLG |
|---|---|---|---|---|---|---|---|---|---|---|---|---|
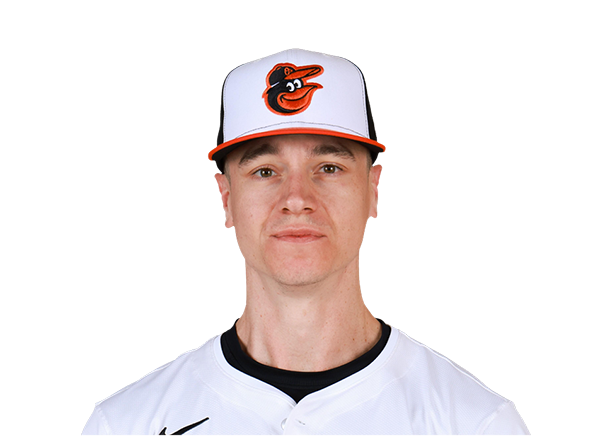 Tyler O'Neill | 1-5 | 5 | 0 | 1 | 1 | 0 | 0 | 2 | 21 | .219 | .309 | .395 |
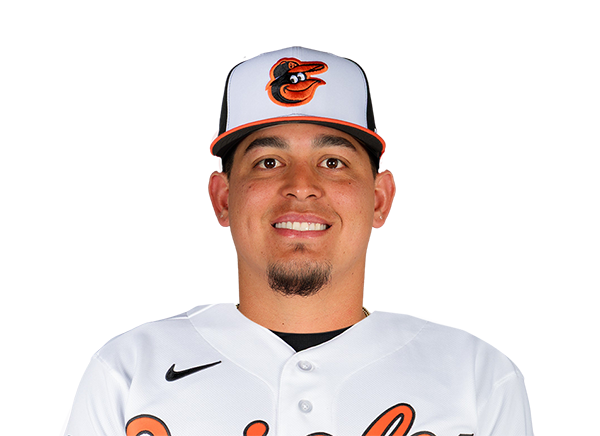 Yohel Pozo | 0-0 | 0 | 0 | 0 | 0 | 0 | 0 | 0 | 0 | .273 | .250 | .545 |
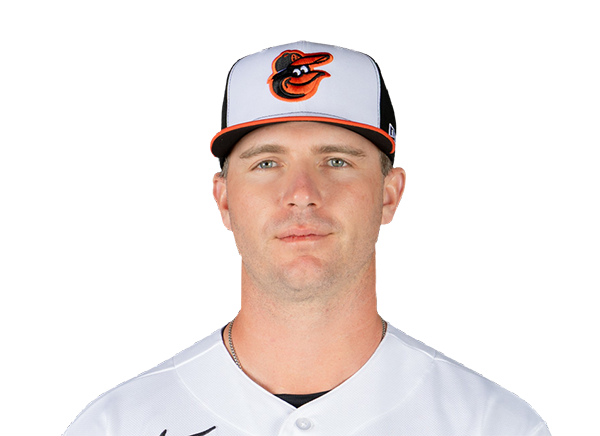 Pete Alonso | 3-5 | 5 | 1 | 3 | 1 | 1 | 0 | 0 | 25 | .264 | .356 | .487 |
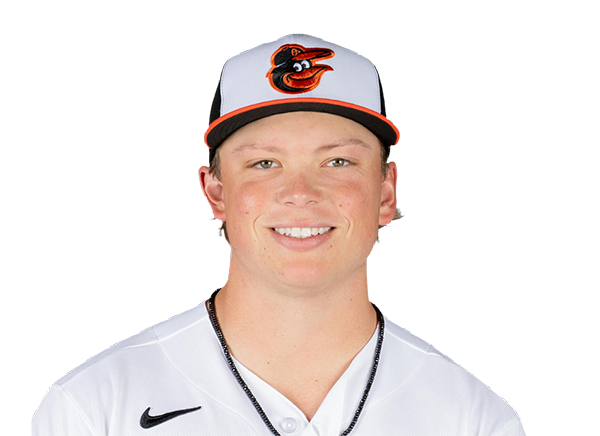 Jackson Holliday | 1-4 | 4 | 0 | 1 | 0 | 0 | 0 | 2 | 13 | .240 | .339 | .377 |
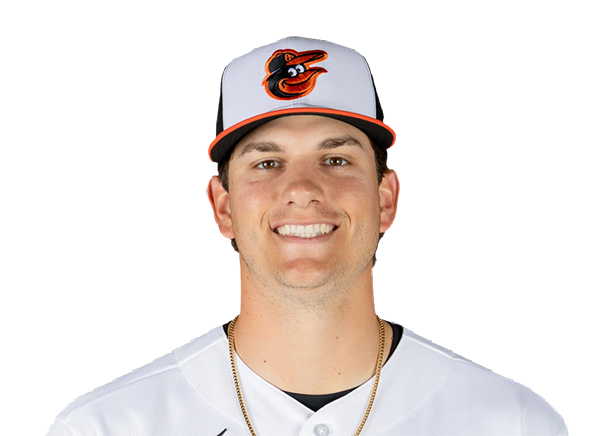 Coby Mayo | 0-3 | 3 | 0 | 0 | 0 | 0 | 0 | 2 | 9 | .208 | .271 | .424 |
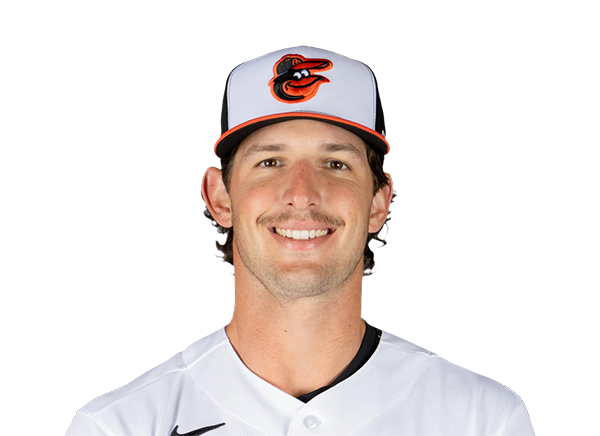 Dylan Beavers | 0-2 | 2 | 0 | 0 | 0 | 0 | 0 | 2 | 10 | .244 | .323 | .348 |
 Gunnar Henderson | 1-4 | 4 | 1 | 1 | 0 | 0 | 1 | 1 | 10 | .221 | .303 | .402 |
 Christian Encarnacion-Strand | 1-5 | 5 | 1 | 1 | 1 | 1 | 0 | 2 | 18 | .254 | .299 | .507 |
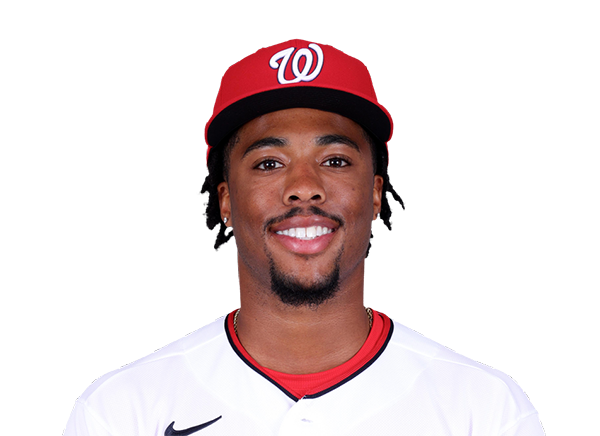 Christian Franklin | 0-3 | 3 | 0 | 0 | 0 | 0 | 1 | 2 | 20 | .118 | .318 | .176 |
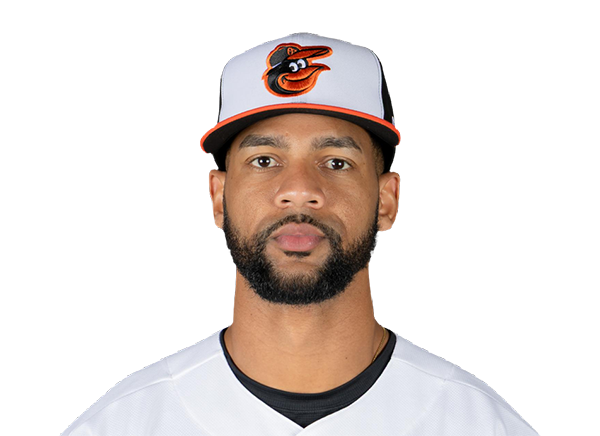 Leody Taveras | 2-4 | 4 | 0 | 2 | 1 | 0 | 0 | 0 | 15 | .226 | .301 | .363 |
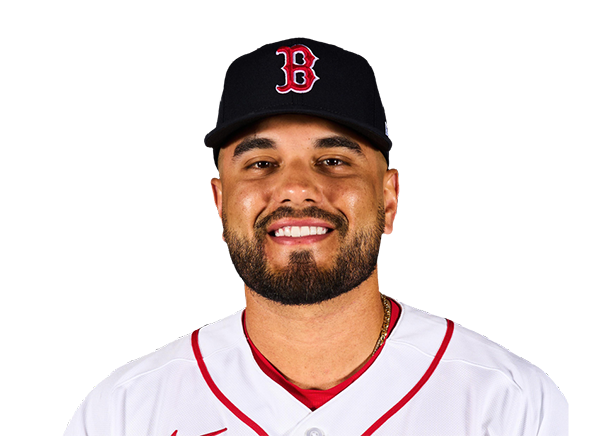 Carlos Narvaez | 0-4 | 4 | 0 | 0 | 0 | 0 | 0 | 2 | 12 | .103 | .161 | .103 |
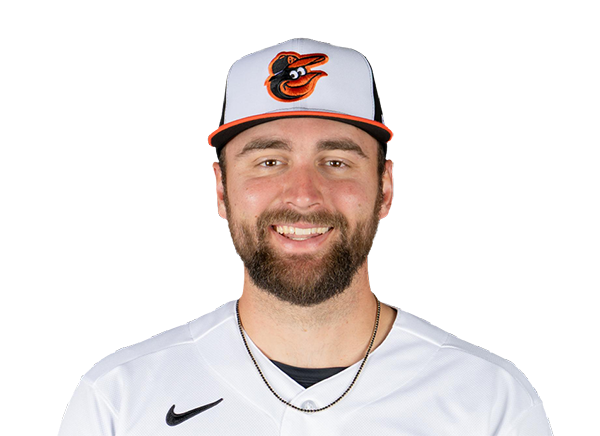 Colton Cowser | 0-0 | 0 | 1 | 0 | 0 | 0 | 0 | 0 | 0 | .214 | .316 | .351 |
Tampa Bay Rays
| Player | H-AB | AB | R | H | RBI | HR | BB | K | #P | AVG | OBP | SLG |
|---|---|---|---|---|---|---|---|---|---|---|---|---|
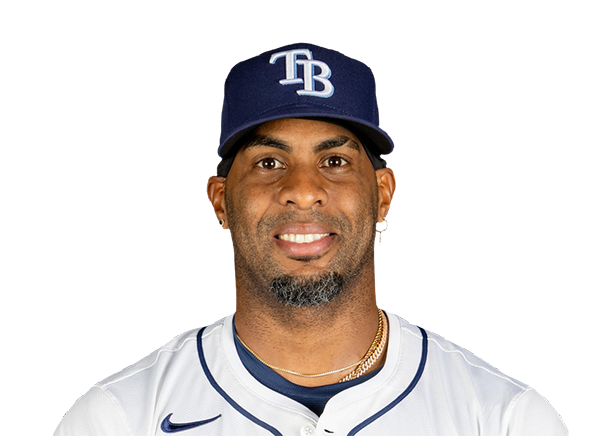 Yandy Diaz | 2-4 | 4 | 0 | 2 | 0 | 0 | 1 | 0 | 17 | .303 | .371 | .463 |
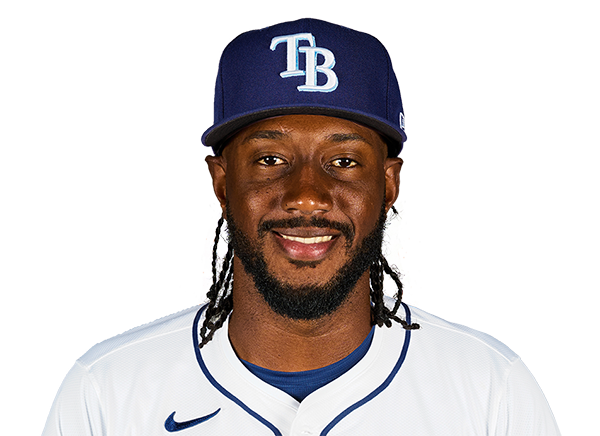 Jorge Mateo | 0-0 | 0 | 1 | 0 | 0 | 0 | 0 | 0 | 0 | .000 | .000 | .000 |
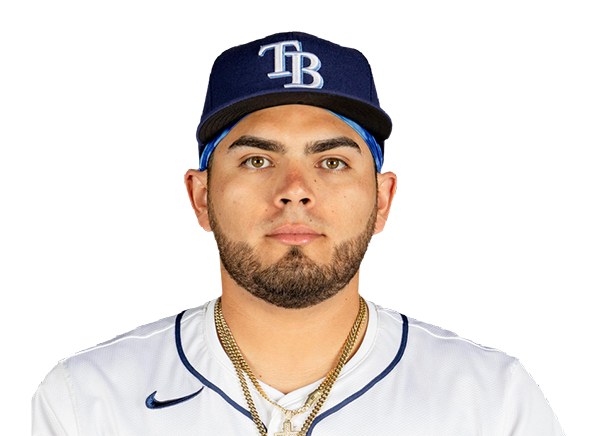 Jonathan Aranda | 3-5 | 5 | 0 | 3 | 0 | 0 | 0 | 0 | 13 | .287 | .374 | .430 |
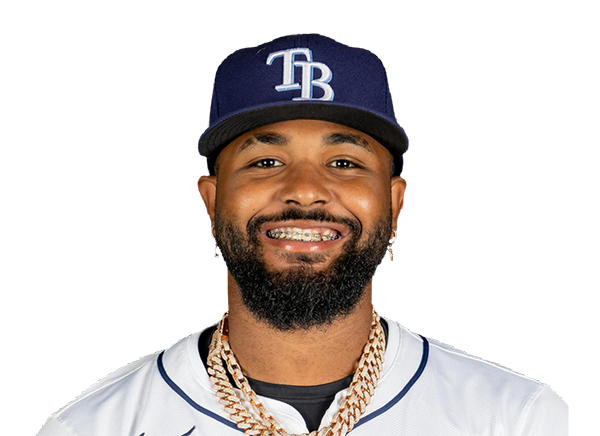 Junior Caminero | 1-5 | 5 | 0 | 1 | 1 | 0 | 0 | 2 | 24 | .275 | .366 | .544 |
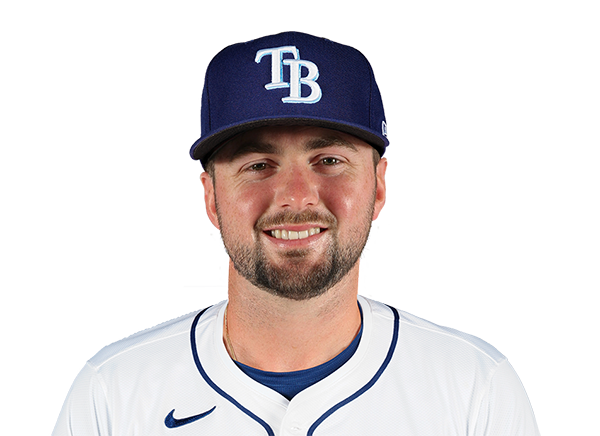 Liam Hicks | 0-1 | 1 | 1 | 0 | 0 | 0 | 2 | 0 | 14 | .300 | .475 | .600 |
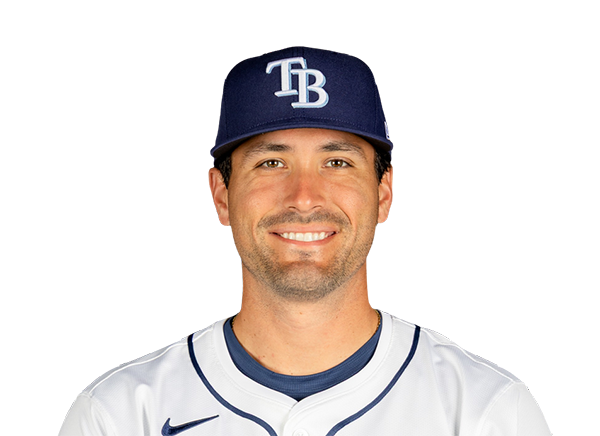 Nick Fortes | 0-2 | 2 | 0 | 0 | 0 | 0 | 0 | 0 | 4 | .268 | .311 | .372 |
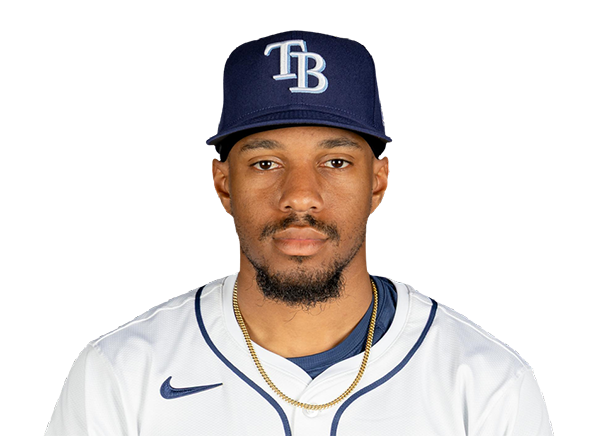 Chandler Simpson | 2-5 | 5 | 0 | 2 | 0 | 0 | 0 | 0 | 16 | .308 | .336 | .364 |
 Jonny DeLuca | 0-4 | 4 | 0 | 0 | 0 | 0 | 1 | 0 | 13 | .266 | .299 | .442 |
 Cedric Mullins | 1-5 | 5 | 0 | 1 | 1 | 0 | 0 | 2 | 17 | .208 | .285 | .361 |
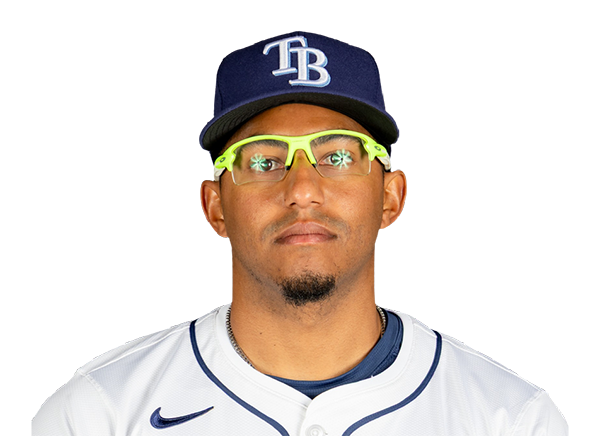 Richie Palacios | 1-4 | 4 | 1 | 1 | 0 | 0 | 1 | 1 | 29 | .242 | .343 | .359 |
 Taylor Walls | 1-3 | 3 | 0 | 1 | 0 | 0 | 0 | 0 | 7 | .220 | .308 | .301 |
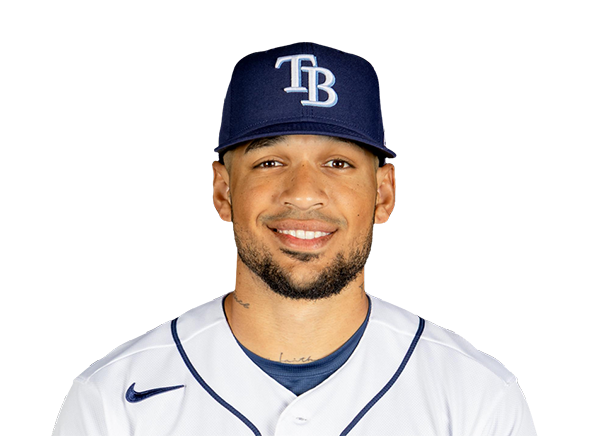 Victor Mesa Jr. | 0-1 | 1 | 0 | 0 | 0 | 0 | 0 | 0 | 3 | .214 | .284 | .447 |
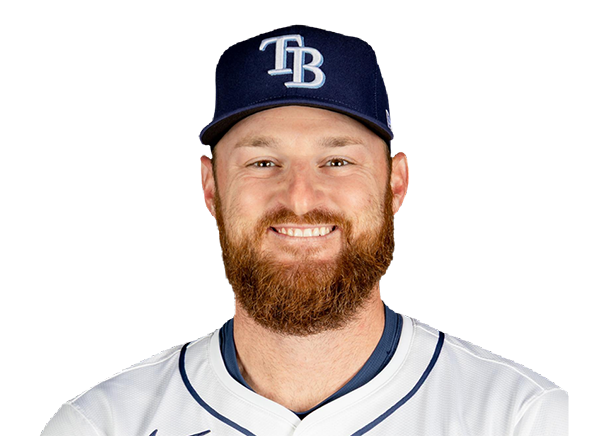 Bryan Baker | 0-0 | 0 | 0 | 0 | 0 | 0 | 0 | 0 | 0 | .000 | .000 | .000 |
Baltimore Orioles
| Player | IP | H | R | ER | BB | K | HR | PC-ST | ERA | PC |
|---|---|---|---|---|---|---|---|---|---|---|
 Kyle Bradish | 6.0 | 7 | 2 | 2 | 4 | 3 | 0 | 93-52 | 3.65 | 93 |
 Alex Hoppe | 0.2 | 1 | 0 | 0 | 0 | 0 | 0 | 8-5 | 5.17 | 8 |
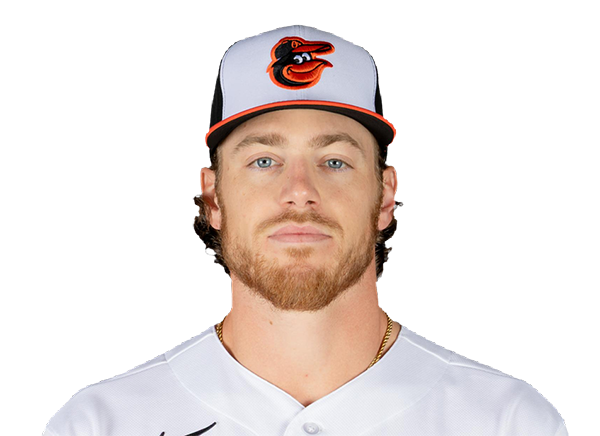 Josh Walker | 0.1 | 0 | 0 | 0 | 0 | 0 | 0 | 3-2 | 3.00 | 3 |
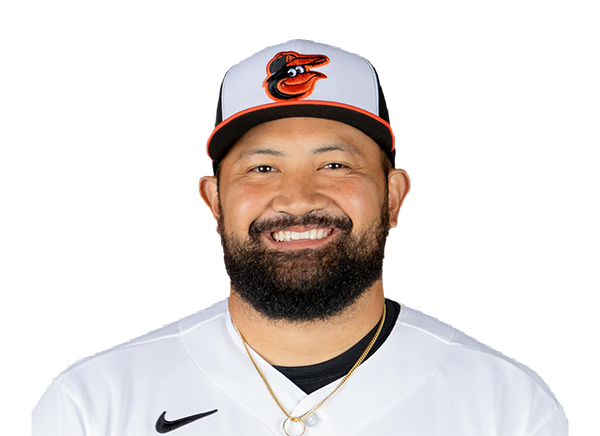 Rico Garcia | 1.0 | 0 | 0 | 0 | 0 | 0 | 0 | 12-8 | 3.48 | 12 |
 Andrew Kittredge | 1.0 | 3 | 1 | 1 | 0 | 0 | 0 | 21-15 | 3.62 | 21 |
 Cam Sanders | 1.0 | 0 | 0 | 0 | 1 | 2 | 0 | 20-12 | 6.32 | 20 |
Tampa Bay Rays
| Player | IP | H | R | ER | BB | K | HR | PC-ST | ERA | PC |
|---|---|---|---|---|---|---|---|---|---|---|
 Ian Seymour | 6.0 | 6 | 3 | 3 | 1 | 9 | 2 | 93-69 | 4.11 | 93 |
 Casey Legumina | 2.0 | 0 | 0 | 0 | 0 | 4 | 0 | 28-20 | 3.86 | 28 |
 Cam Booser | 1.0 | 1 | 0 | 0 | 0 | 0 | 0 | 15-8 | 1.93 | 15 |
|
Bryan Baker | 1.0 | 2 | 1 | 0 | 1 | 2 | 0 | 17-15 | 1.52 | 17 |
H2H / Season Series
BAL3–2
TB
BAL5–3
TB
TB7–6
BAL
TB2–10
BAL
TB3–4
BAL
TB5–6
BAL
BAL11–2
TB
BAL6–1
TB
BAL9–7
TB
TB5–3
BAL
Last 5 Games
| Date | Opponent | Result |
|---|---|---|
| Aug 22 | vs TB | W3–2 |
| Aug 21 | vs TB | W5–3 |
| Aug 20 |  vs NYY | L1–6 |
| Aug 19 | vs NYY | L3–5 |
| Aug 18 | vs NYY | L1–3 |
| Date | Opponent | Result |
|---|---|---|
| Aug 22 | @ BAL | L2–3 |
| Aug 21 | @ BAL | L3–5 |
| Aug 20 |  vs TOR | L1–5 |
| Aug 19 | vs TOR | W7–6 |
| Aug 18 | vs TOR | L5–10 |
Standings
American League
| Team | W | L | PCT | GB | DIFF | STRK |
|---|---|---|---|---|---|---|
| 1Rays | 76 | 53 | .589 | - | +42 | L3 |
2 White Sox | 67 | 62 | .519 | 9 | +42 | L1 |
3 Astros | 65 | 65 | .500 | 11.5 | -43 | L1 |
| 4Yankees | 73 | 56 | .566 | 3 | +95 | L1 |
5 Red Sox | 70 | 59 | .543 | 6 | +98 | W2 |
6 Rangers | 64 | 66 | .492 | 12.5 | -48 | L1 |
| 7Blue Jays | 64 | 67 | .489 | 13 | -50 | W1 |
8 Twins | 63 | 66 | .488 | 13 | -45 | L1 |
9 Guardians | 63 | 66 | .488 | 13 | -15 | W2 |
| 10Orioles | 63 | 67 | .485 | 13.5 | -33 | W2 |
11 Mariners | 62 | 68 | .477 | 14.5 | -44 | W2 |
12 Tigers | 61 | 68 | .473 | 15 | +77 | L4 |
13 Royals | 57 | 74 | .435 | 20 | -95 | W7 |
14 Angels | 52 | 78 | .400 | 24.5 | -68 | W1 |
15 Athletics | 50 | 80 | .385 | 26.5 | -188 | W1 |
National League
| Team | W | L | PCT | GB | DIFF | STRK |
|---|---|---|---|---|---|---|
1 Brewers | 81 | 49 | .623 | - | +163 | W3 |
2 Dodgers | 79 | 51 | .608 | 2 | +147 | W5 |
3 Braves | 75 | 55 | .577 | 6 | +108 | L2 |
4 Cubs | 74 | 56 | .569 | 7 | +98 | L3 |
5 Phillies | 72 | 58 | .554 | 9 | +25 | W8 |
6 Padres | 69 | 60 | .535 | 11.5 | +7 | W1 |
7 Diamondbacks | 68 | 61 | .527 | 12.5 | +13 | W2 |
8 Marlins | 66 | 64 | .508 | 15 | +17 | W2 |
9 Cardinals | 66 | 65 | .504 | 15.5 | 0 | L2 |
10 Pirates | 63 | 68 | .481 | 18.5 | +29 | L2 |
11 Reds | 61 | 68 | .473 | 19.5 | -98 | L2 |
12 Nationals | 61 | 70 | .466 | 20.5 | +14 | L3 |
13 Mets | 59 | 71 | .454 | 22 | -39 | W1 |
14 Giants | 52 | 77 | .403 | 28.5 | -79 | L3 |
15 Rockies | 50 | 78 | .391 | 30 | -130 | L4 |
BAL
VS
TB
Pitchers
Kyle Bradish
Alex Hoppe
Josh Walker
Rico Garcia
Andrew Kittredge
Cam Sanders
Catchers
Yohel Pozo
Carlos Narvaez
Infielders
Pete Alonso
Jackson Holliday
Gunnar Henderson
Christian Encarnacion-Strand
Outfielders
Tyler O'Neill
Christian Franklin
Leody Taveras
Colton Cowser
Designated Hitters
Coby Mayo
Dylan Beavers
Pitchers
Bryan Baker
Ian Seymour
Casey Legumina
Cam Booser
Catchers
Liam Hicks
Nick Fortes
Infielders
Jorge Mateo
Jonathan Aranda
Junior Caminero
Richie Palacios
Taylor Walls
Outfielders
Chandler Simpson
Jonny DeLuca
Cedric Mullins
Designated Hitters
Yandy Diaz
Other Players
Victor Mesa Jr.
Orioles
VS
Rays
Batting
122
Team Games Played
121
4044
At Bats
4062
956
Hits
1058
530
Runs Batted In
528
145
Home Runs
128
65
Stolen Bases
125
.236
Batting Average
.260
549
Runs
554
176
Doubles
174
18
Triples
19
1603
Total Bases
1654
471
Walks
399
1118
Strikeouts
860
.320
On Base Percentage
.331
.396
Slugging Percentage
.407
.717
OBP Pct + SLG Pct
.738
122
Games Played
121
122
Games Started
121
44
Hit By Pitch
45
0.0
Wins Above Replacement
0.0
0.0
Offensive Wins Above Replacement
0.0
28
Caught Stealing
38
1
Is Qualified
1
521.6
Runs Created
558.6
4.3
Runs Created Per 27 Outs
4.7
.102
Walks Per Plate Appearance
.087
0.42
Walk To Strikeout Ratio
0.46
.160
Isolated Power
.147
.286
Secondary Average
.266
4.00
Pitches Per Plate Appearance
3.78
339
Extra Base Hits
321
4607
Plate Appearances
4577
27.9
At Bats Per Home Run
31.7
15
Sacrifice Hit
35
31
Sacrifice Flies
33
Pitching
122
Team Games Played
121
47
Quality Starts
38
59
Wins
74
63
Losses
47
32
Saves
48
64
Holds
93
1052
Hits
928
511
Earned runs
446
129
Home Runs
150
409
Walks
308
965
Strikeouts
983
8.0
Strikeouts Per 9 Innings
8.2
145.6
Pitches Per Start
138.9
1.35
Walks Plus Hits Per Inning Pitched
1.15
4.24
Earned Run Average
3.72
63
Losses
47
1083.2
Innings pitched
1079.0
.484
Win Percentage
.612
48
Save Opportunities
62
.253
Opponent Batting Average
.230
.322
Opponent's On-base pct.
.289
.409
Opponent's Slugging pct.
.393
.731
Opponent's OPB Pct + SLG Pct
.683
4154
At Bats
4036
218
Doubles
184
21
Triples
13
33
Batters Hit
45
65
Stolen Bases
103
122
Games Played
121
1
Complete Games
1
2
Shutouts
11
39
Wild Pitches
31
559
Runs Batted In
470
2
Balks
2
1083.2
Innings pitched
1079.0
8.0
Strikeouts Per 9 Innings
8.2
27
Caught Stealing
28
122
Games Started
121
0.0
Wins Above Replacement
0.0
1
Is Qualified
1
584
Runs
493
511
Earned Runs
446
1699
Total Bases
1588
Fielding
122
Team Games Played
121
1084
Full Innings
1079
4378
Total Chances
4262
3251
Putouts
3237
1048
Assists
953
79
Errors
72
176
Double Plays
174
0.982
Fielding Percentage
0.983
35.7
Range Factor
34.9
0.0
Zone Rating
0.0
122
Games Played
121
0
Games Started
0
0.0
Defensive Wins Above Replacement
0.0
1
Qualified
1