

Orioles vs Rockies Live Score (1 Sep, 2026)
Game Information
Stage
STD
Season
2026
First Pitch
Mon, Aug 31, 8:40 pm
Venue
Coors Field
Location
Denver, Colorado
Venue Type
Outdoor
Broadcast
MLB.TV
Attendance
17,277
Live Situation
1Balls
0Strikes
0Outs
—Pitcher
—At Bat
Pitch Sequence
1
BALL
Sinker
95 MPH
2
BALL IN PLAY
Sinker
95 MPH
Injury Report


Team Stats
 BAL
COL


2
Runs
1
4
Hits
8
0
Errors
0
0
Home Runs
0
6
Walks
4
5
Strikeouts
8
Player Box Score
Baltimore Orioles
| Player | H-AB | AB | R | H | RBI | HR | BB | K | #P | AVG | OBP | SLG |
|---|---|---|---|---|---|---|---|---|---|---|---|---|
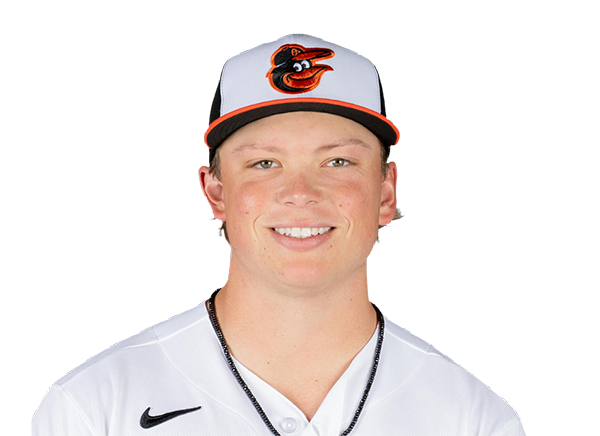 Jackson Holliday | 0-4 | 4 | 0 | 0 | 0 | 0 | 0 | 1 | 10 | .230 | .314 | .347 |
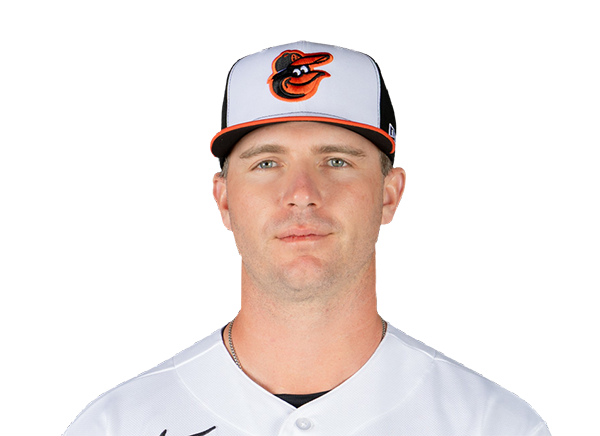 Pete Alonso | 0-3 | 3 | 0 | 0 | 0 | 0 | 1 | 1 | 18 | .268 | .360 | .500 |
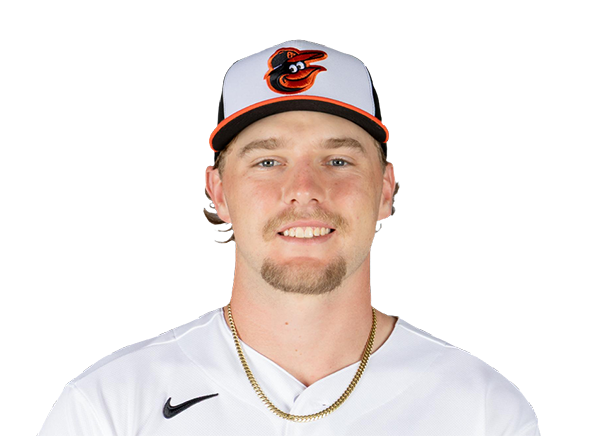 Gunnar Henderson | 1-4 | 4 | 0 | 1 | 0 | 0 | 0 | 0 | 15 | .223 | .306 | .407 |
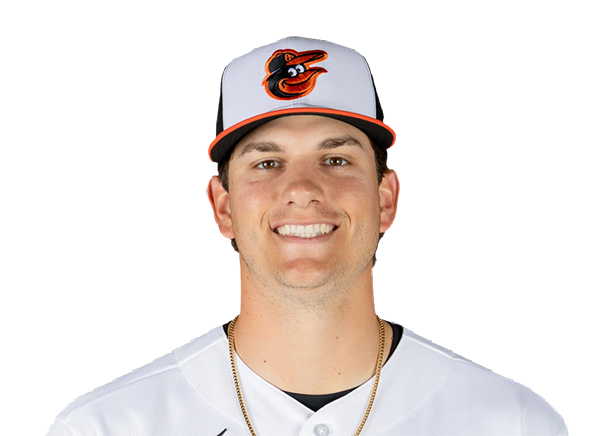 Coby Mayo | 1-3 | 3 | 1 | 1 | 0 | 0 | 1 | 0 | 16 | .219 | .284 | .446 |
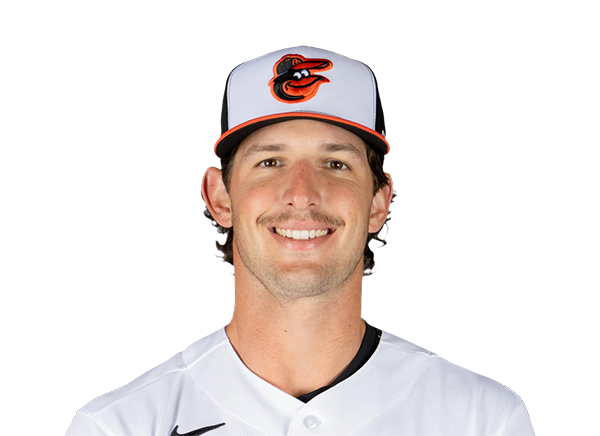 Dylan Beavers | 1-3 | 3 | 1 | 1 | 0 | 0 | 0 | 0 | 6 | .249 | .331 | .390 |
 Christian Encarnacion-Strand | 0-1 | 1 | 0 | 0 | 0 | 0 | 0 | 0 | 3 | .262 | .305 | .492 |
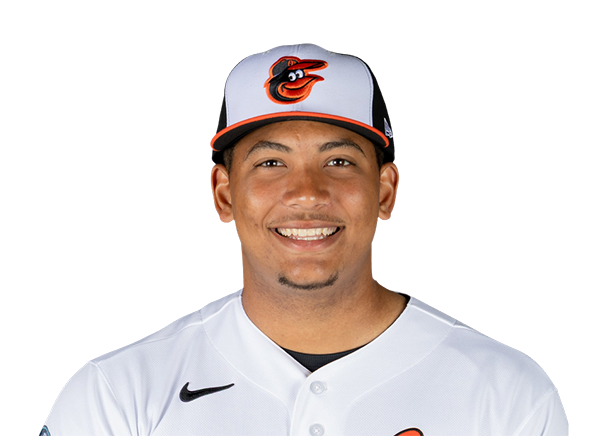 Samuel Basallo | 1-3 | 3 | 0 | 1 | 1 | 0 | 1 | 1 | 13 | .231 | .296 | .430 |
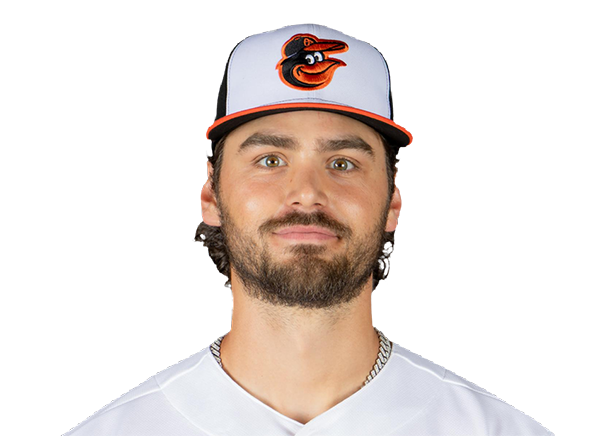 Blaze Alexander | 0-3 | 3 | 0 | 0 | 0 | 0 | 1 | 0 | 18 | .305 | .361 | .425 |
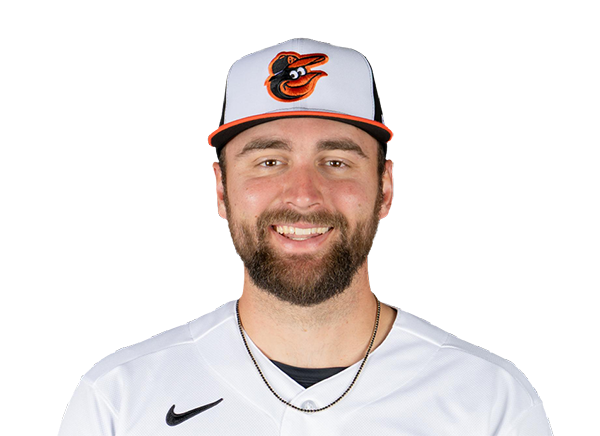 Colton Cowser | 0-4 | 4 | 0 | 0 | 1 | 0 | 0 | 2 | 14 | .221 | .313 | .377 |
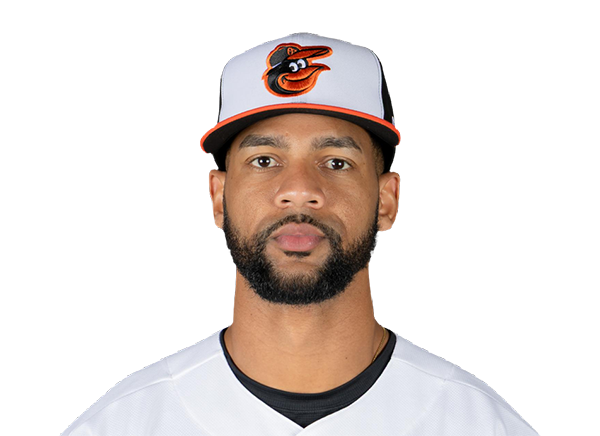 Leody Taveras | 0-1 | 1 | 0 | 0 | 0 | 0 | 2 | 0 | 12 | .224 | .299 | .358 |
Colorado Rockies
| Player | H-AB | AB | R | H | RBI | HR | BB | K | #P | AVG | OBP | SLG |
|---|---|---|---|---|---|---|---|---|---|---|---|---|
 Jake McCarthy | 1-5 | 5 | 0 | 1 | 0 | 0 | 0 | 0 | 11 | .289 | .330 | .473 |
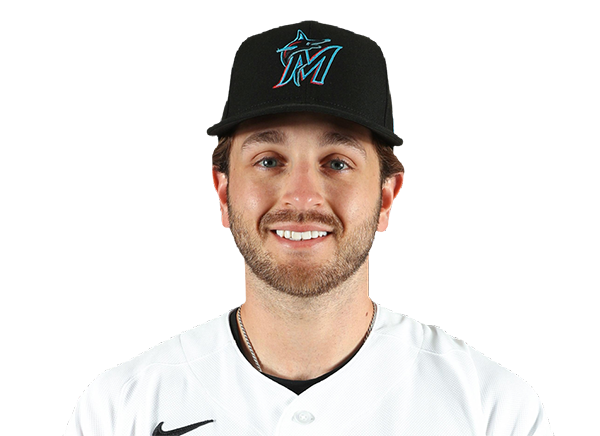 Connor Norby | 1-4 | 4 | 0 | 1 | 0 | 0 | 0 | 0 | 23 | .226 | .330 | .360 |
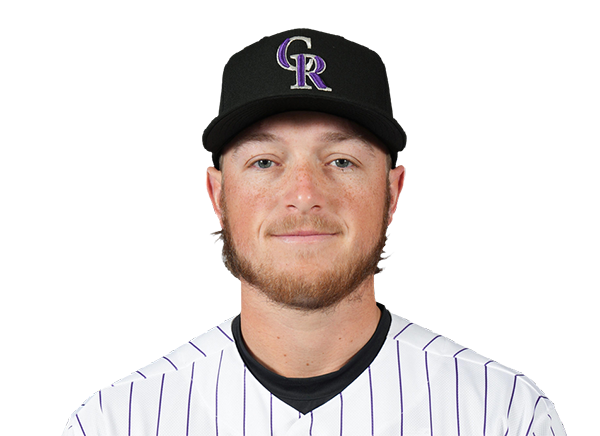 Hunter Goodman | 1-3 | 3 | 1 | 1 | 0 | 0 | 1 | 1 | 17 | .255 | .322 | .543 |
 TJ Rumfield | 1-2 | 2 | 0 | 1 | 0 | 0 | 2 | 0 | 13 | .290 | .383 | .437 |
 Willi Castro | 1-4 | 4 | 0 | 1 | 0 | 0 | 0 | 3 | 15 | .260 | .331 | .417 |
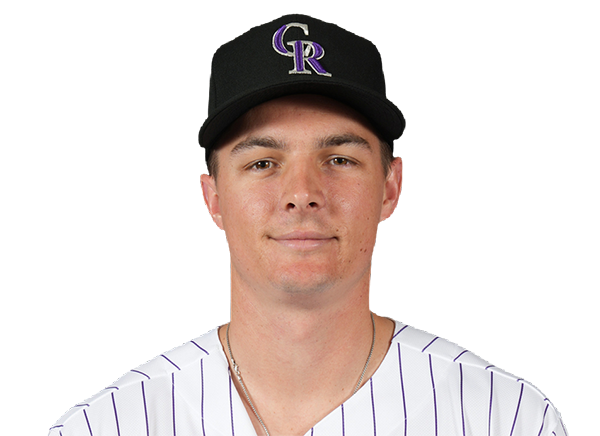 Mickey Moniak | 1-4 | 4 | 0 | 1 | 0 | 0 | 0 | 0 | 8 | .253 | .294 | .506 |
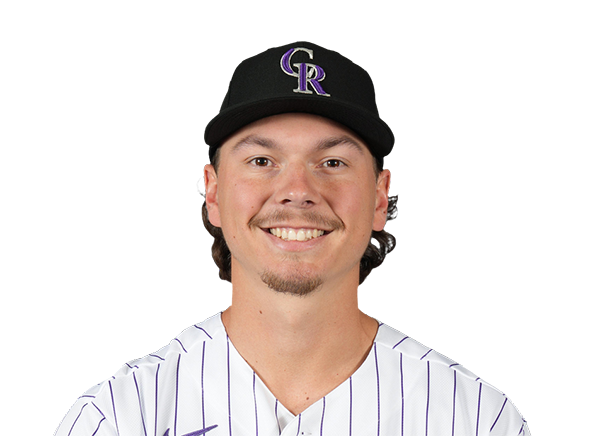 Jordan Beck | 1-3 | 3 | 0 | 1 | 1 | 0 | 0 | 1 | 12 | .206 | .261 | .313 |
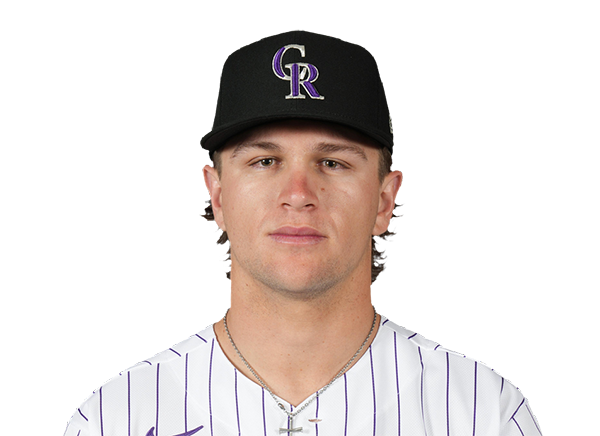 Cole Carrigg | 0-1 | 1 | 0 | 0 | 0 | 0 | 0 | 0 | 1 | .260 | .341 | .438 |
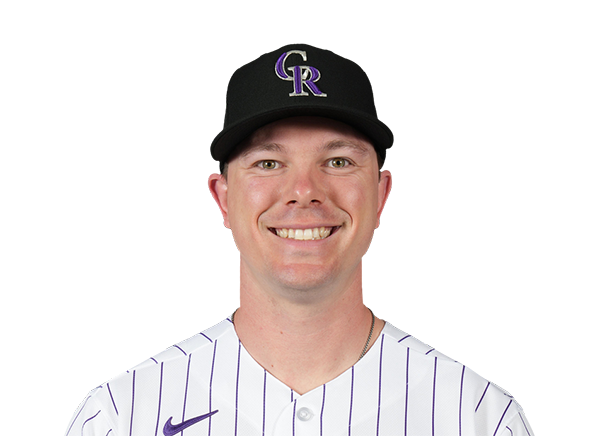 Troy Johnston | 1-3 | 3 | 0 | 1 | 0 | 0 | 1 | 1 | 19 | .288 | .359 | .407 |
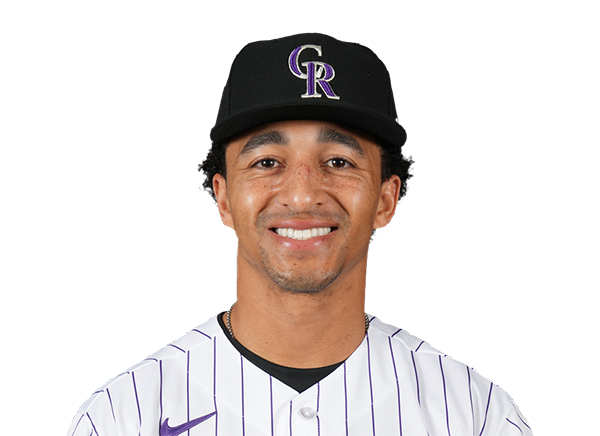 Ryan Ritter | 0-0 | 0 | 0 | 0 | 0 | 0 | 0 | 0 | 0 | .176 | .222 | .176 |
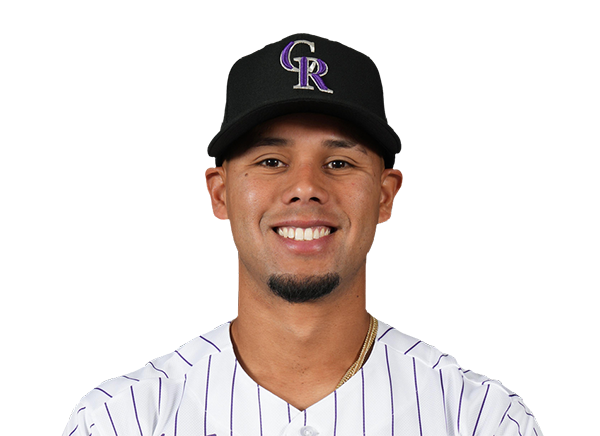 Ezequiel Tovar | 0-3 | 3 | 0 | 0 | 0 | 0 | 0 | 1 | 14 | .208 | .256 | .333 |
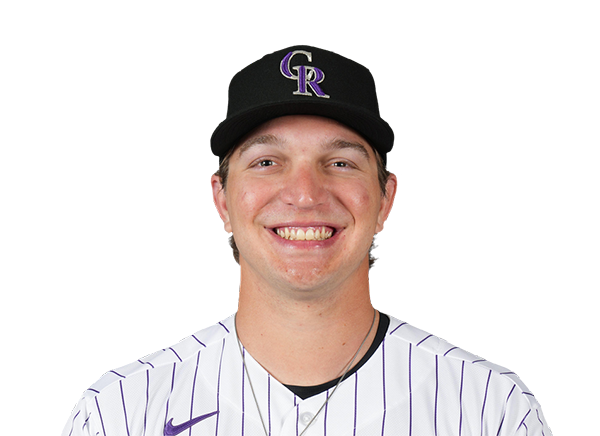 Zac Veen | 0-1 | 1 | 0 | 0 | 0 | 0 | 0 | 1 | 5 | .226 | .314 | .452 |
Baltimore Orioles
| Player | IP | H | R | ER | BB | K | HR | PC-ST | ERA | PC |
|---|---|---|---|---|---|---|---|---|---|---|
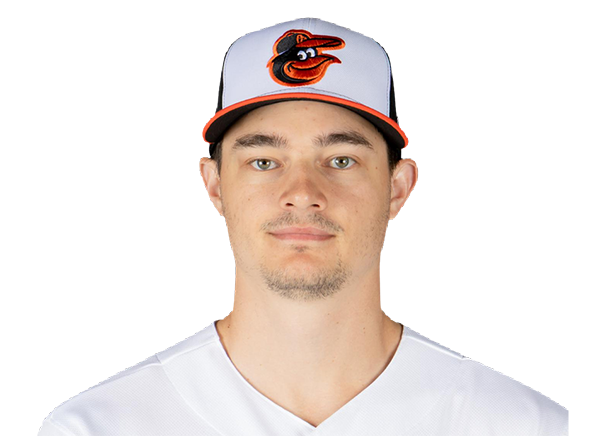 Cade Povich | 5.0 | 5 | 1 | 1 | 3 | 4 | 0 | 87-51 | 4.05 | 87 |
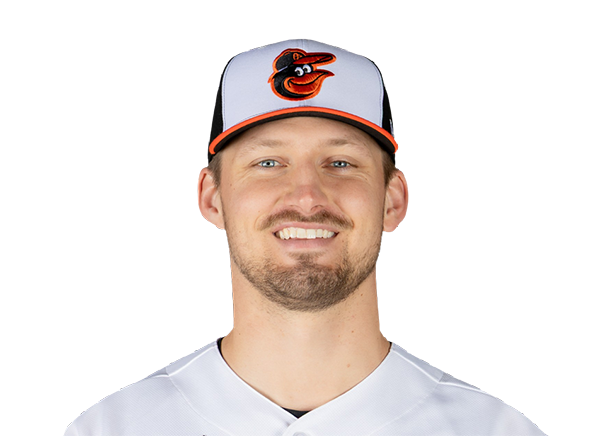 Grant Wolfram | 2.0 | 1 | 0 | 0 | 0 | 2 | 0 | 25-17 | 4.81 | 25 |
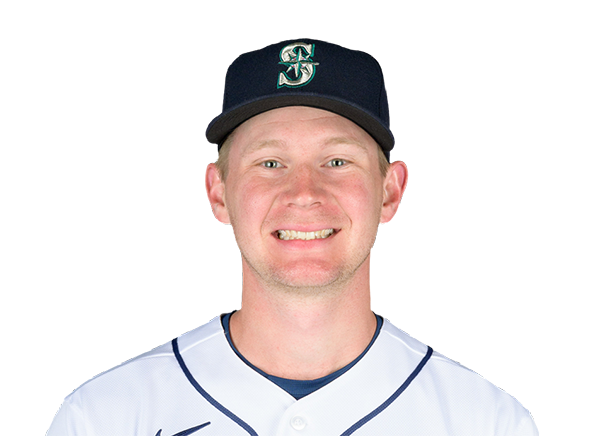 Alex Hoppe | 0.1 | 1 | 0 | 0 | 1 | 0 | 0 | 12-6 | 4.38 | 12 |
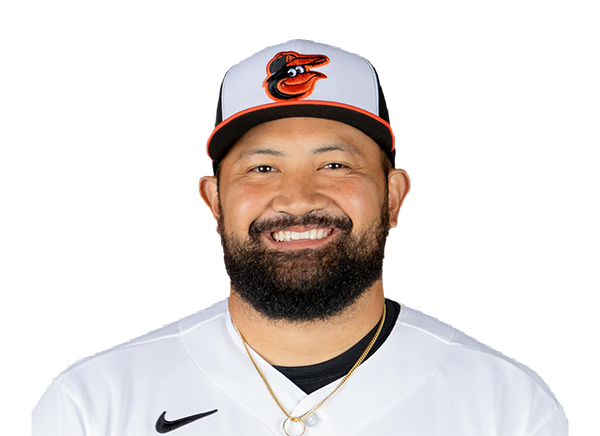 Rico Garcia | 0.2 | 0 | 0 | 0 | 0 | 1 | 0 | 5-5 | 3.22 | 5 |
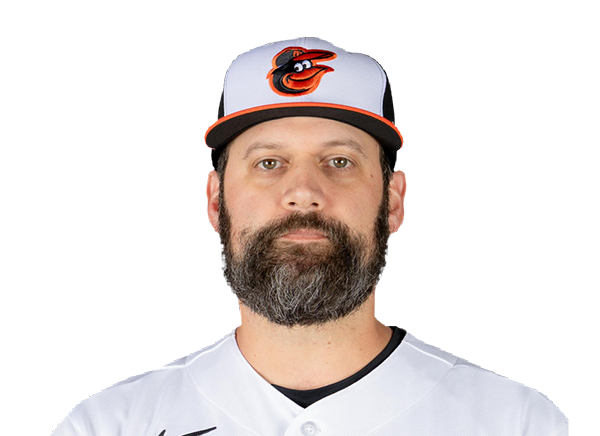 Andrew Kittredge | 1.0 | 1 | 0 | 0 | 0 | 1 | 0 | 9-6 | 3.12 | 9 |
Colorado Rockies
| Player | IP | H | R | ER | BB | K | HR | PC-ST | ERA | PC |
|---|---|---|---|---|---|---|---|---|---|---|
 Tanner Gordon | 5.0 | 3 | 1 | 1 | 1 | 3 | 0 | 60-40 | 5.18 | 60 |
 Mark Manfredi | 1.1 | 0 | 1 | 1 | 3 | 1 | 0 | 23-10 | 2.45 | 23 |
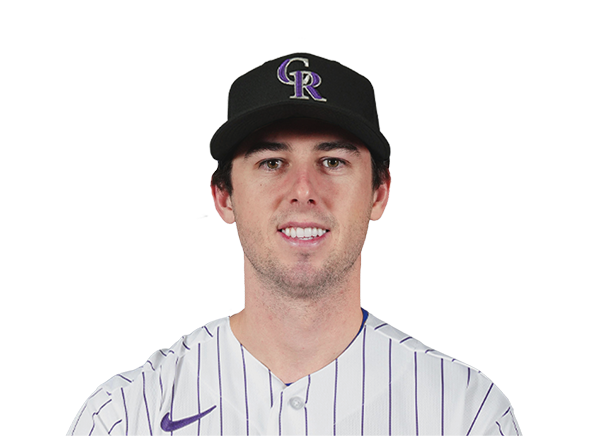 Nick Frasso | 0.2 | 0 | 0 | 0 | 2 | 0 | 0 | 19-9 | 4.09 | 19 |
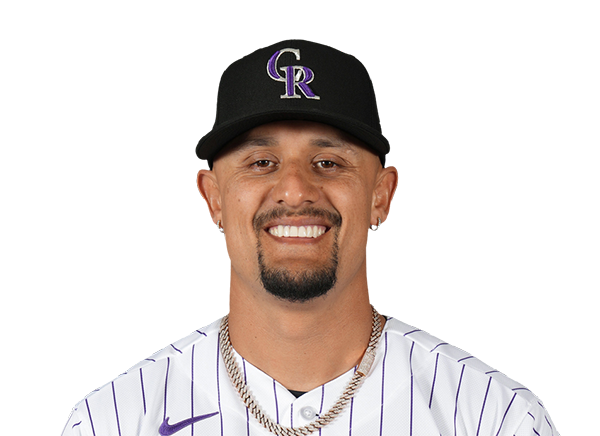 Brennan Bernardino | 1.0 | 1 | 0 | 0 | 0 | 0 | 0 | 17-11 | 2.57 | 17 |
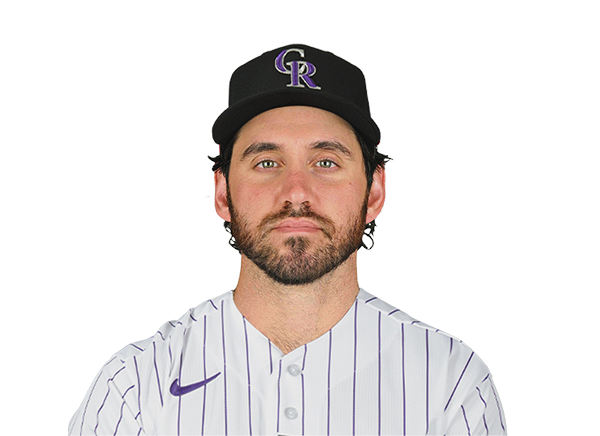 Jordan Romano | 1.0 | 0 | 0 | 0 | 0 | 1 | 0 | 6-5 | 4.68 | 6 |
H2H / Season Series
COL1–2
BAL
Last 5 Games
| Date | Opponent | Result |
|---|---|---|
| Aug 30 |  @ ATH | W8–5 |
| Aug 29 | @ ATH | W5–3 |
| Aug 28 | @ ATH | W4–3 |
| Aug 27 |  @ STL | L5–7 |
| Aug 26 | @ STL | W8–7 |
| Date | Opponent | Result |
|---|---|---|
| Aug 30 |  @ ATL | L2–3 |
| Aug 29 | @ ATL | L1–2 |
| Aug 28 | @ ATL | L4–6 |
| Aug 27 |  @ WSH | L1–7 |
| Aug 26 | @ WSH | W13–1 |
Standings
American League
| Team | W | L | PCT | GB | DIFF | STRK |
|---|---|---|---|---|---|---|
1 Rays | 82 | 55 | .599 | - | +53 | L1 |
2 White Sox | 72 | 65 | .526 | 10 | +41 | L2 |
3 Astros | 70 | 68 | .507 | 12.5 | -40 | W2 |
4 Yankees | 78 | 60 | .565 | 4.5 | +108 | L1 |
5 Red Sox | 75 | 63 | .543 | 7.5 | +85 | W1 |
6 Guardians | 69 | 68 | .504 | 13 | -2 | W1 |
| 7Orioles | 69 | 69 | .500 | 13.5 | -17 | W4 |
8 Rangers | 68 | 70 | .493 | 14.5 | -44 | W2 |
9 Blue Jays | 68 | 70 | .493 | 14.5 | -50 | W3 |
10 Twins | 66 | 72 | .478 | 16.5 | -46 | W2 |
11 Mariners | 64 | 74 | .464 | 18.5 | -73 | L5 |
12 Tigers | 63 | 74 | .460 | 19 | +55 | L2 |
13 Royals | 62 | 76 | .449 | 20.5 | -83 | L1 |
| 14Athletics | 53 | 85 | .384 | 29.5 | -198 | L4 |
15 Angels | 53 | 85 | .384 | 29.5 | -73 | W1 |
National League
| Team | W | L | PCT | GB | DIFF | STRK |
|---|---|---|---|---|---|---|
1 Brewers | 85 | 53 | .616 | - | +163 | L2 |
2 Dodgers | 82 | 55 | .599 | 2.5 | +153 | W1 |
| 3Braves | 82 | 56 | .594 | 3 | +113 | L1 |
4 Cubs | 78 | 60 | .565 | 7 | +141 | W1 |
5 Phillies | 78 | 60 | .565 | 7 | +31 | W5 |
6 Padres | 73 | 65 | .529 | 12 | +15 | W1 |
7 Diamondbacks | 73 | 66 | .525 | 12.5 | +4 | L2 |
8 Marlins | 69 | 69 | .500 | 16 | +12 | L1 |
| 9Cardinals | 68 | 70 | .493 | 17 | -15 | L2 |
10 Pirates | 67 | 71 | .486 | 18 | +26 | W2 |
| 11Nationals | 66 | 74 | .471 | 20 | +19 | W1 |
12 Reds | 65 | 73 | .471 | 20 | -113 | L1 |
13 Mets | 62 | 76 | .449 | 23 | -52 | W1 |
14 Giants | 57 | 81 | .413 | 28 | -70 | W2 |
| 15Rockies | 52 | 86 | .377 | 33 | -143 | L5 |
BAL
VS
COL
Pitchers
Cade Povich
Catchers
Samuel Basallo
Infielders
Jackson Holliday
Pete Alonso
Gunnar Henderson
Blaze Alexander
Outfielders
Dylan Beavers
Colton Cowser
Leody Taveras
Designated Hitters
Coby Mayo
Pitchers
Tanner Gordon
Catchers
Hunter Goodman
Infielders
Connor Norby
TJ Rumfield
Willi Castro
Ezequiel Tovar
Outfielders
Jake McCarthy
Mickey Moniak
Jordan Beck
Designated Hitters
Troy Johnston
Orioles
VS
Rockies
Batting
138
Team Games Played
138
4594
At Bats
4684
1080
Hits
1182
606
Runs Batted In
620
168
Home Runs
152
71
Stolen Bases
95
.235
Batting Average
.252
628
Runs
645
203
Doubles
247
19
Triples
26
1825
Total Bases
1937
517
Walks
443
1272
Strikeouts
1197
.317
On Base Percentage
.323
.397
Slugging Percentage
.414
.715
OBP Pct + SLG Pct
.737
138
Games Played
138
138
Games Started
138
52
Hit By Pitch
69
0.0
Wins Above Replacement
0.0
0.0
Offensive Wins Above Replacement
0.0
31
Caught Stealing
37
1
Is Qualified
1
587.8
Runs Created
638.3
4.3
Runs Created Per 27 Outs
4.7
.099
Walks Per Plate Appearance
.084
0.41
Walk To Strikeout Ratio
0.37
.162
Isolated Power
.161
.283
Secondary Average
.268
3.99
Pitches Per Plate Appearance
3.75
390
Extra Base Hits
425
5215
Plate Appearances
5260
27.3
At Bats Per Home Run
30.8
17
Sacrifice Hit
16
33
Sacrifice Flies
47
Pitching
138
Team Games Played
138
53
Quality Starts
22
69
Wins
52
69
Losses
86
39
Saves
30
76
Holds
54
1195
Hits
1387
569
Earned runs
736
145
Home Runs
187
457
Walks
456
1097
Strikeouts
935
8.0
Strikeouts Per 9 Innings
6.9
145.7
Pitches Per Start
148.8
1.34
Walks Plus Hits Per Inning Pitched
1.52
4.17
Earned Run Average
5.47
69
Losses
86
1228.2
Innings pitched
1211.2
.500
Win Percentage
.377
58
Save Opportunities
51
.254
Opponent Batting Average
.288
.322
Opponent's On-base pct.
.351
.406
Opponent's Slugging pct.
.486
.728
Opponent's OPB Pct + SLG Pct
.838
4704
At Bats
4823
235
Doubles
308
23
Triples
45
40
Batters Hit
53
76
Stolen Bases
112
138
Games Played
138
1
Complete Games
1
2
Shutouts
1
42
Wild Pitches
38
617
Runs Batted In
755
2
Balks
5
1228.2
Innings pitched
1211.2
8.0
Strikeouts Per 9 Innings
6.9
34
Caught Stealing
22
138
Games Started
138
0.0
Wins Above Replacement
0.0
1
Is Qualified
1
645
Runs
788
569
Earned Runs
736
1911
Total Bases
2346
Fielding
138
Team Games Played
138
1229
Full Innings
1212
4951
Total Chances
4882
3686
Putouts
3635
1183
Assists
1160
82
Errors
87
203
Double Plays
247
0.983
Fielding Percentage
0.982
35.7
Range Factor
35.6
0.0
Zone Rating
0.0
138
Games Played
138
0
Games Started
0
0.0
Defensive Wins Above Replacement
0.0
1
Qualified
1