

Orioles vs Tigers Live Score (27 Jul, 2026)
Game Information
Stage
Standard
Season
2026
First Pitch
Mon, Jul 27, 6:40 pm
Venue
Comerica Park
Location
Detroit, Michigan
Attendance
21,913
Live Situation
2Balls
1Strikes
0Outs
—Pitcher
—At Bat
Pitch Sequence
1
BALL
Slider
90 MPH
2
BALL
Four-seam FB
95 MPH
3
STRIKE LOOKING
Four-seam FB
96 MPH
4
BALL IN PLAY
Four-seam FB
96 MPH
Injury Report

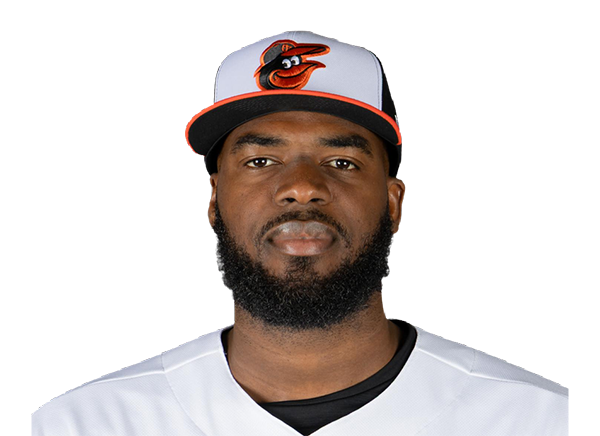






Team Stats
 BAL
DET


8
Runs
5
12
Hits
11
0
Errors
1
3
Home Runs
0
4
Walks
1
3
Strikeouts
10
Player Box Score
Baltimore Orioles
| Player | H-AB | AB | R | H | RBI | HR | BB | K | #P | AVG | OBP | SLG |
|---|---|---|---|---|---|---|---|---|---|---|---|---|
 Dylan Beavers | 1-3 | 3 | 0 | 1 | 1 | 0 | 0 | 0 | 6 | .250 | .335 | .356 |
 Tyler O'Neill | 1-1 | 1 | 1 | 1 | 1 | 1 | 0 | 0 | 3 | .210 | .294 | .375 |
 Colton Cowser | 0-0 | 0 | 0 | 0 | 0 | 0 | 1 | 0 | 5 | .207 | .315 | .332 |
 Pete Alonso | 2-5 | 5 | 1 | 2 | 0 | 0 | 0 | 0 | 19 | .251 | .347 | .468 |
 Gunnar Henderson | 1-4 | 4 | 0 | 1 | 0 | 0 | 1 | 2 | 23 | .221 | .292 | .401 |
 Taylor Ward | 0-3 | 3 | 0 | 0 | 1 | 0 | 2 | 0 | 28 | .251 | .386 | .354 |
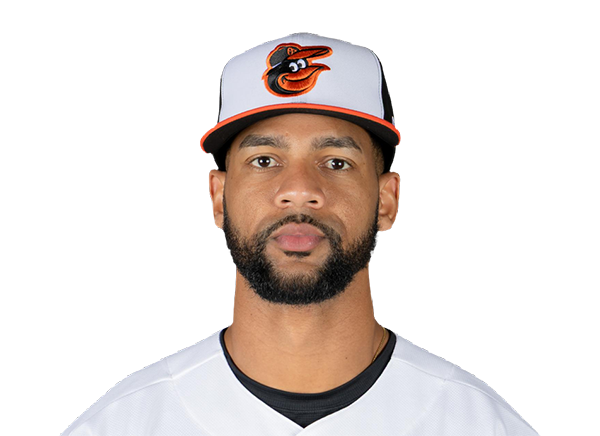 Leody Taveras | 1-5 | 5 | 2 | 1 | 1 | 1 | 0 | 0 | 20 | .228 | .310 | .352 |
 Jackson Holliday | 4-5 | 5 | 2 | 4 | 0 | 0 | 0 | 1 | 14 | .243 | .354 | .392 |
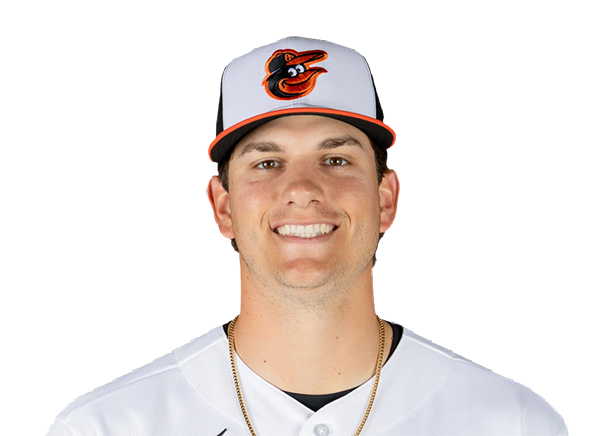 Coby Mayo | 2-4 | 4 | 2 | 2 | 3 | 1 | 0 | 0 | 15 | .201 | .266 | .414 |
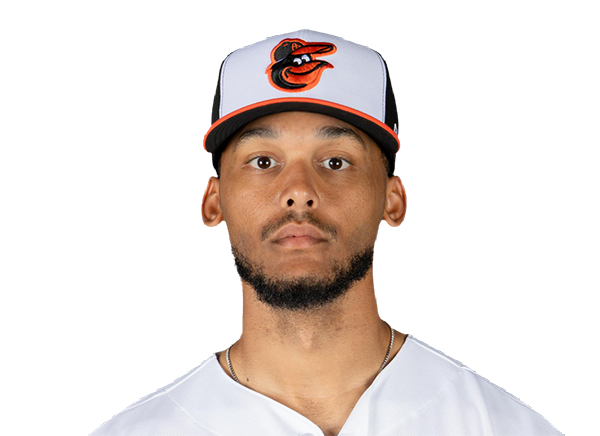 Jeremiah Jackson | 0-3 | 3 | 0 | 0 | 1 | 0 | 0 | 0 | 10 | .248 | .268 | .393 |
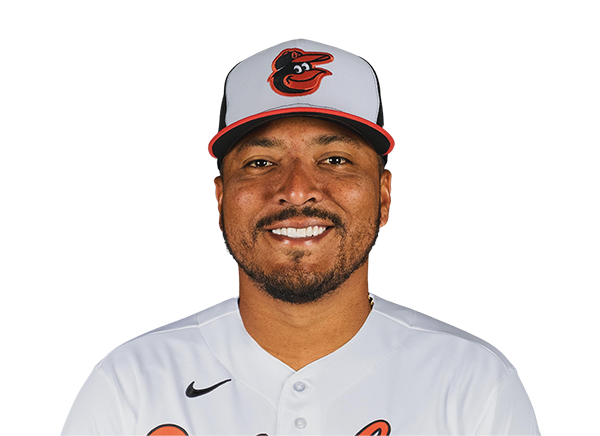 Chadwick Tromp | 0-4 | 4 | 0 | 0 | 0 | 0 | 0 | 0 | 12 | .143 | .143 | .143 |
Detroit Tigers
| Player | H-AB | AB | R | H | RBI | HR | BB | K | #P | AVG | OBP | SLG |
|---|---|---|---|---|---|---|---|---|---|---|---|---|
 Kevin McGonigle | 2-5 | 5 | 0 | 2 | 0 | 0 | 0 | 2 | 23 | .282 | .387 | .418 |
 Dillon Dingler | 1-5 | 5 | 1 | 1 | 0 | 0 | 0 | 1 | 19 | .273 | .340 | .528 |
 Colt Keith | 2-3 | 3 | 1 | 2 | 0 | 0 | 0 | 0 | 9 | .258 | .303 | .399 |
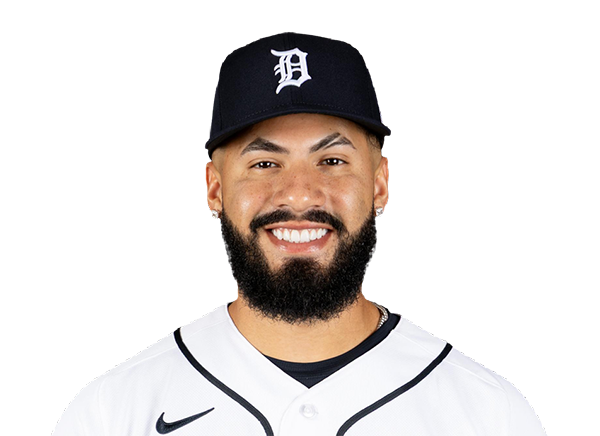 Gleyber Torres | 0-1 | 1 | 0 | 0 | 0 | 0 | 0 | 1 | 5 | .268 | .387 | .369 |
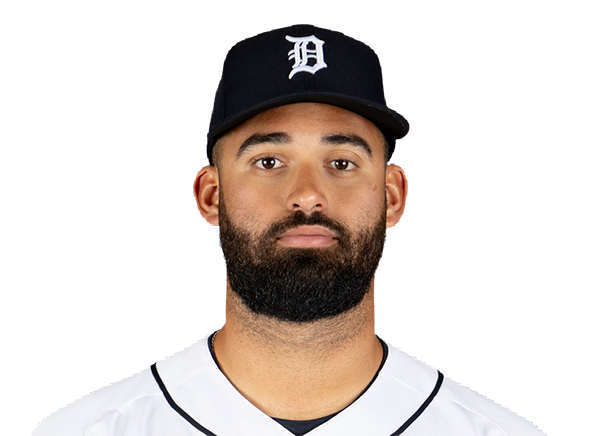 Riley Greene | 1-4 | 4 | 1 | 1 | 0 | 0 | 0 | 1 | 24 | .284 | .371 | .469 |
 Spencer Torkelson | 2-3 | 3 | 1 | 2 | 1 | 0 | 0 | 0 | 12 | .209 | .304 | .419 |
 Zach McKinstry | 2-3 | 3 | 1 | 2 | 1 | 0 | 1 | 0 | 12 | .206 | .284 | .310 |
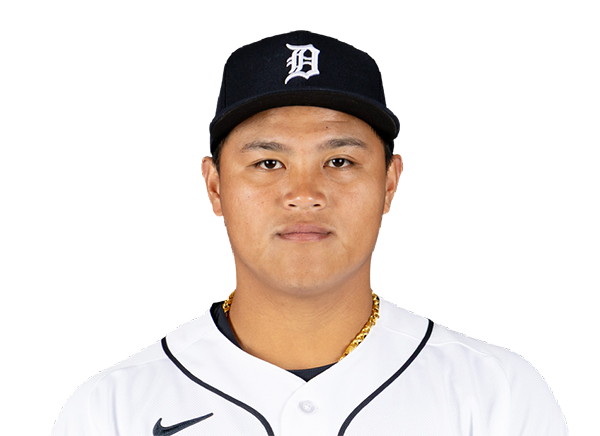 Hao-Yu Lee | 1-3 | 3 | 0 | 1 | 2 | 0 | 0 | 1 | 12 | .275 | .307 | .440 |
 James Outman | 0-4 | 4 | 0 | 0 | 0 | 0 | 0 | 3 | 14 | .157 | .202 | .315 |
 Matt Vierling | 0-3 | 3 | 0 | 0 | 1 | 0 | 0 | 1 | 16 | .201 | .250 | .318 |
Baltimore Orioles
| Player | IP | H | R | ER | BB | K | HR | PC-ST | ERA | PC |
|---|---|---|---|---|---|---|---|---|---|---|
 Kyle Bradish | 4.2 | 10 | 5 | 5 | 1 | 4 | 0 | 93-60 | 3.74 | 93 |
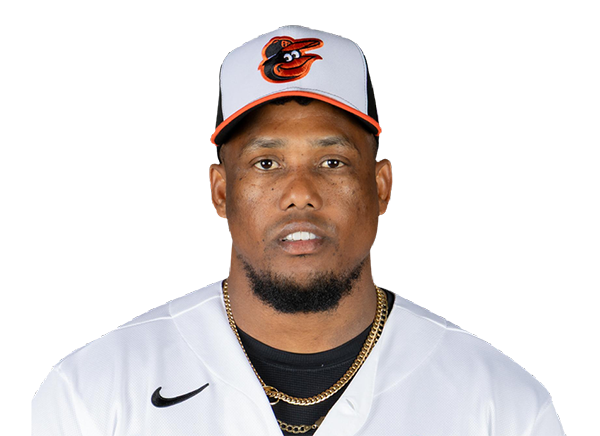 Yennier Cano | 1.0 | 0 | 0 | 0 | 0 | 1 | 0 | 8-6 | 2.27 | 8 |
 Grant Wolfram | 1.1 | 0 | 0 | 0 | 0 | 2 | 0 | 17-12 | 4.22 | 17 |
 Andrew Kittredge | 1.0 | 1 | 0 | 0 | 0 | 1 | 0 | 11-9 | 3.52 | 11 |
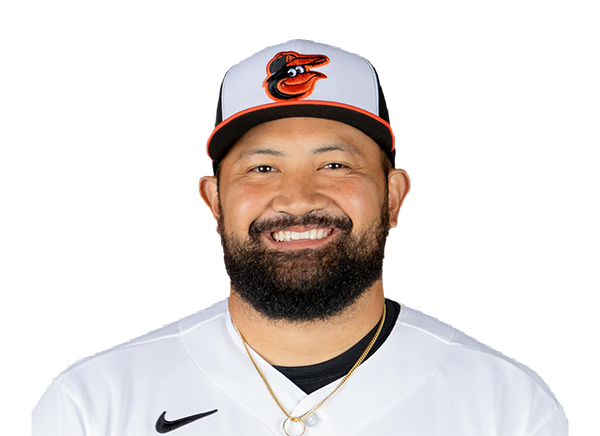 Rico Garcia | 1.0 | 0 | 0 | 0 | 0 | 2 | 0 | 17-10 | 2.93 | 17 |
Detroit Tigers
| Player | IP | H | R | ER | BB | K | HR | PC-ST | ERA | PC |
|---|---|---|---|---|---|---|---|---|---|---|
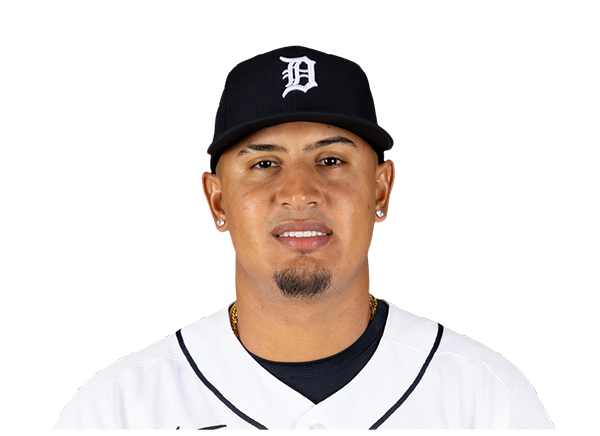 Keider Montero | 4.1 | 9 | 6 | 4 | 1 | 1 | 1 | 80-54 | 3.34 | 80 |
 Brenan Hanifee | 0.2 | 1 | 1 | 1 | 0 | 0 | 1 | 8-5 | 4.05 | 8 |
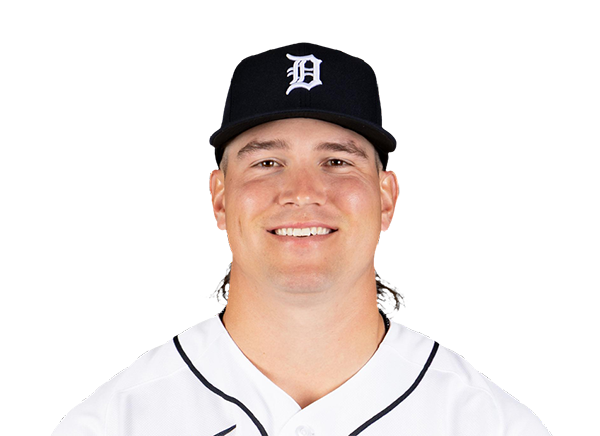 Tyler Holton | 0.1 | 1 | 1 | 1 | 1 | 0 | 1 | 10-6 | 3.04 | 10 |
 Drew Anderson | 1.2 | 1 | 0 | 0 | 0 | 0 | 0 | 22-13 | 4.13 | 22 |
 Jacob Waguespack | 2.0 | 0 | 0 | 0 | 2 | 2 | 0 | 35-21 | 1.47 | 35 |
H2H / Season Series
DET9–10
BAL
DET14–0
BAL
DET5–8
BAL
BAL1–4
DET
BAL5–3
DET
BAL7–4
DET
DET1–1
BAL
BAL6–5
DET
DET4–4
BAL
Last 5 Games
| Date | Opponent | Result |
|---|---|---|
| Aug 23 |  vs TB | L1–3 |
| Aug 22 | vs TB | W3–2 |
| Aug 21 | vs TB | W5–3 |
| Aug 20 |  vs NYY | L1–6 |
| Aug 19 | vs NYY | L3–5 |
| Date | Opponent | Result |
|---|---|---|
| Aug 23 |  @ KC | L7–11 |
| Aug 22 | @ KC | L1–3 |
| Aug 21 | @ KC | L2–5 |
| Aug 19 |  @ PIT | L3–4 |
| Aug 18 | @ PIT | L1–4 |
Standings
American League
| Team | W | L | PCT | GB | DIFF | STRK |
|---|---|---|---|---|---|---|
| 1Rays | 77 | 53 | .592 | - | +44 | W1 |
2 White Sox | 68 | 62 | .523 | 9 | +43 | W1 |
3 Astros | 65 | 66 | .496 | 12.5 | -44 | L2 |
| 4Yankees | 74 | 56 | .569 | 3 | +100 | W1 |
5 Red Sox | 71 | 59 | .546 | 6 | +99 | W3 |
6 Rangers | 65 | 66 | .496 | 12.5 | -46 | W1 |
7 Guardians | 65 | 66 | .496 | 12.5 | -9 | W4 |
8 Blue Jays | 64 | 68 | .485 | 14 | -55 | L1 |
9 Twins | 63 | 68 | .481 | 14.5 | -54 | L3 |
| 10Orioles | 63 | 68 | .481 | 14.5 | -35 | L1 |
11 Mariners | 62 | 68 | .477 | 15 | -44 | W2 |
| 12Tigers | 61 | 69 | .469 | 16 | +73 | L5 |
| 13Royals | 58 | 74 | .439 | 20 | -91 | W8 |
14 Angels | 52 | 79 | .397 | 25.5 | -70 | L1 |
15 Athletics | 51 | 80 | .389 | 26.5 | -187 | W2 |
National League
| Team | W | L | PCT | GB | DIFF | STRK |
|---|---|---|---|---|---|---|
1 Brewers | 81 | 49 | .623 | - | +163 | W3 |
2 Dodgers | 80 | 51 | .611 | 1.5 | +151 | W6 |
3 Braves | 75 | 55 | .577 | 6 | +108 | L2 |
4 Cubs | 74 | 56 | .569 | 7 | +98 | L3 |
5 Phillies | 73 | 58 | .557 | 8.5 | +27 | W9 |
6 Padres | 71 | 60 | .542 | 10.5 | +16 | W3 |
7 Diamondbacks | 69 | 62 | .527 | 12.5 | +9 | W1 |
8 Marlins | 67 | 64 | .511 | 14.5 | +21 | W3 |
9 Cardinals | 66 | 66 | .500 | 16 | -2 | L3 |
| 10Pirates | 63 | 69 | .477 | 19 | +25 | L3 |
11 Reds | 62 | 69 | .473 | 19.5 | -94 | L1 |
12 Nationals | 61 | 71 | .462 | 21 | +10 | L4 |
13 Mets | 59 | 72 | .450 | 22.5 | -40 | L1 |
14 Giants | 52 | 78 | .400 | 29 | -80 | L4 |
15 Rockies | 50 | 80 | .385 | 31 | -136 | L6 |
BAL
VS
DET
Pitchers
Kyle Bradish
Yennier Cano
Grant Wolfram
Andrew Kittredge
Rico Garcia
Catchers
Chadwick Tromp
Infielders
Pete Alonso
Jackson Holliday
Coby Mayo
Jeremiah Jackson
Outfielders
Dylan Beavers
Colton Cowser
Taylor Ward
Leody Taveras
Designated Hitters
Gunnar Henderson
Other Players
Tyler O'Neill
Pitchers
Keider Montero
Brenan Hanifee
Tyler Holton
Drew Anderson
Jacob Waguespack
Catchers
Dillon Dingler
Infielders
Kevin McGonigle
Colt Keith
Gleyber Torres
Spencer Torkelson
Hao-Yu Lee
Outfielders
Zach McKinstry
James Outman
Matt Vierling
Designated Hitters
Riley Greene
Orioles
VS
Tigers
Batting
130
Team Games Played
129
4318
At Bats
4352
1018
Hits
1050
562
Runs Batted In
553
158
Home Runs
153
68
Stolen Bases
36
.236
Batting Average
.241
582
Runs
580
187
Doubles
197
18
Triples
26
1715
Total Bases
1758
491
Walks
460
1197
Strikeouts
1102
.318
On Base Percentage
.318
.397
Slugging Percentage
.404
.716
OBP Pct + SLG Pct
.722
130
Games Played
129
130
Games Started
129
48
Hit By Pitch
49
0.0
Wins Above Replacement
0.0
0.0
Offensive Wins Above Replacement
0.0
29
Caught Stealing
18
1
Is Qualified
1
554.6
Runs Created
569.7
4.3
Runs Created Per 27 Outs
4.5
.100
Walks Per Plate Appearance
.094
0.41
Walk To Strikeout Ratio
0.42
.161
Isolated Power
.163
.284
Secondary Average
.273
4.00
Pitches Per Plate Appearance
3.92
363
Extra Base Hits
376
4907
Plate Appearances
4909
27.3
At Bats Per Home Run
28.4
16
Sacrifice Hit
6
32
Sacrifice Flies
37
Pitching
130
Team Games Played
129
51
Quality Starts
48
63
Wins
61
67
Losses
68
34
Saves
26
68
Holds
60
1125
Hits
987
540
Earned runs
451
139
Home Runs
132
430
Walks
396
1035
Strikeouts
1055
8.1
Strikeouts Per 9 Innings
8.3
145.6
Pitches Per Start
141.4
1.34
Walks Plus Hits Per Inning Pitched
1.21
4.20
Earned Run Average
3.56
67
Losses
68
1156.2
Innings pitched
1141.1
.485
Win Percentage
.473
52
Save Opportunities
54
.254
Opponent Batting Average
.231
.322
Opponent's On-base pct.
.303
.409
Opponent's Slugging pct.
.377
.731
Opponent's OPB Pct + SLG Pct
.680
4431
At Bats
4277
226
Doubles
193
23
Triples
18
37
Batters Hit
55
69
Stolen Bases
71
130
Games Played
129
1
Complete Games
0
2
Shutouts
14
40
Wild Pitches
29
588
Runs Batted In
479
2
Balks
3
1156.2
Innings pitched
1141.1
8.1
Strikeouts Per 9 Innings
8.3
31
Caught Stealing
25
130
Games Started
129
0.0
Wins Above Replacement
0.0
1
Is Qualified
1
615
Runs
503
540
Earned Runs
451
1814
Total Bases
1612
Fielding
130
Team Games Played
129
1157
Full Innings
1141
4670
Total Chances
4621
3470
Putouts
3424
1118
Assists
1138
82
Errors
59
187
Double Plays
197
0.982
Fielding Percentage
0.987
35.7
Range Factor
36.0
0.0
Zone Rating
0.0
130
Games Played
129
0
Games Started
0
0.0
Defensive Wins Above Replacement
0.0
1
Qualified
1