

Orioles vs Tigers Live Score (22 Feb, 2026)
Game Information
Stage
EXH
Season
2026
First Pitch
Sun, Feb 22, 1:05 pm
Venue
Publix Field at Joker Marchant Stadium
Location
Lakeland, Florida
Venue Type
Outdoor
Attendance
6,039
Live Situation
2Balls
1Strikes
0Outs
—Pitcher
—At Bat
Pitch Sequence
1
BALL
Slider
85 MPH
2
BALL
Slider
83 MPH
3
STRIKE LOOKING
Slider
82 MPH
4
BALL IN PLAY
Four-seam FB
91 MPH
Injury Report

Team Stats
 BAL
DET


4
Runs
4
9
Hits
7
0
Errors
1
2
Home Runs
1
3
Walks
3
8
Strikeouts
10
Player Box Score
Baltimore Orioles
| Player | H-AB | AB | R | H | RBI | HR | BB | K | #P | AVG | OBP | SLG |
|---|---|---|---|---|---|---|---|---|---|---|---|---|
 Colton Cowser | 0-3 | 3 | 0 | 0 | 0 | 0 | 0 | 2 | 0 | .000 | .000 | .000 |
 Enrique Bradfield Jr. | 0-2 | 2 | 0 | 0 | 0 | 0 | 0 | 1 | 0 | .000 | .250 | .000 |
 Pete Alonso | 1-2 | 2 | 1 | 1 | 1 | 1 | 1 | 0 | 0 | .400 | .500 | 1.600 |
 Ethan Anderson | 0-2 | 2 | 0 | 0 | 0 | 0 | 0 | 1 | 0 | .000 | .000 | .000 |
 Heston Kjerstad | 1-3 | 3 | 1 | 1 | 1 | 1 | 0 | 0 | 0 | .250 | .400 | 1.000 |
 Thomas Sosa | 0-1 | 1 | 0 | 0 | 0 | 0 | 0 | 0 | 0 | .000 | .000 | .000 |
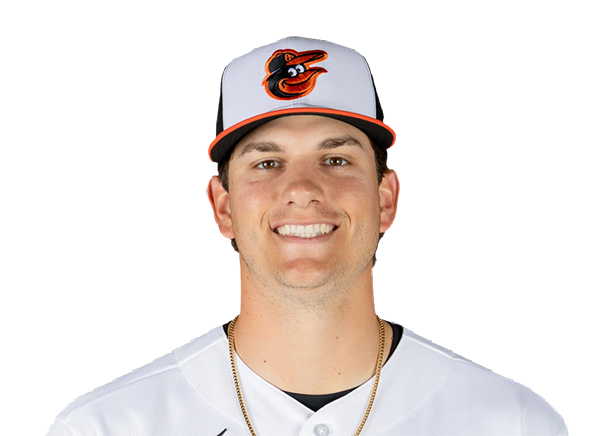 Coby Mayo | 2-3 | 3 | 0 | 2 | 0 | 0 | 0 | 0 | 0 | .400 | .400 | .600 |
|
Joshua Liranzo | 0-1 | 1 | 0 | 0 | 0 | 0 | 0 | 0 | 0 | .000 | .000 | .000 |
 Sam Huff | 0-3 | 3 | 0 | 0 | 0 | 0 | 0 | 0 | 0 | .400 | .400 | .800 |
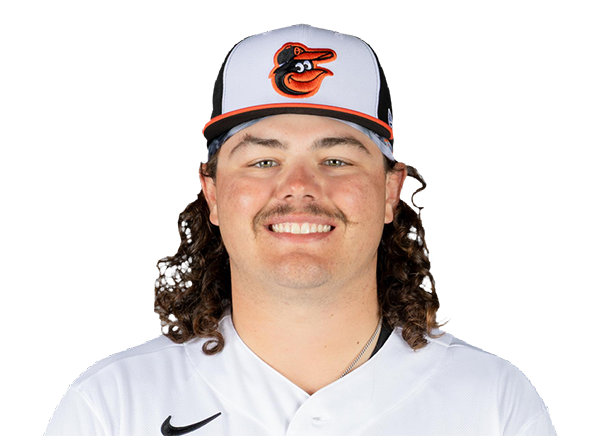 Creed Willems | 0-1 | 1 | 0 | 0 | 0 | 0 | 0 | 1 | 0 | .000 | .500 | .000 |
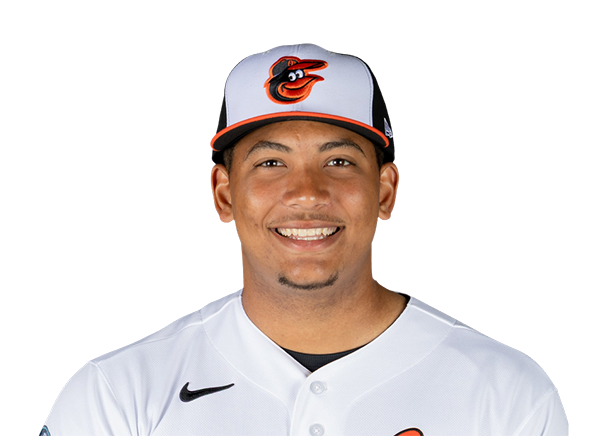 Samuel Basallo | 1-2 | 2 | 2 | 1 | 0 | 0 | 1 | 1 | 0 | .250 | .400 | .500 |
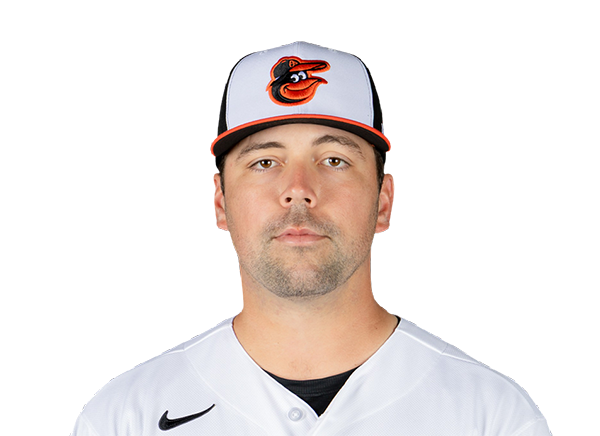 Silas Ardoin | 1-1 | 1 | 0 | 1 | 0 | 0 | 0 | 0 | 0 | 1.000 | 1.000 | 2.000 |
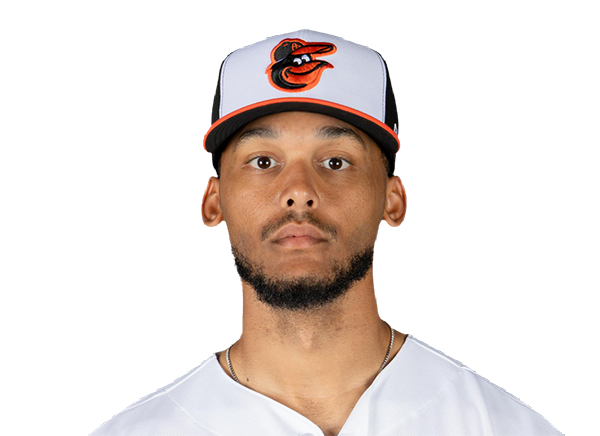 Jeremiah Jackson | 0-2 | 2 | 0 | 0 | 0 | 0 | 1 | 0 | 0 | .250 | .400 | .250 |
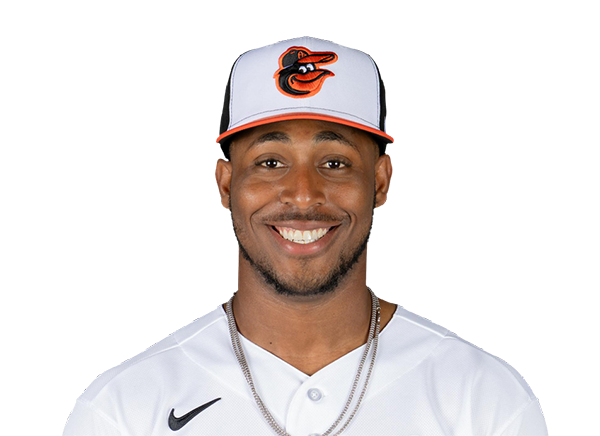 Aron Estrada | 0-1 | 1 | 0 | 0 | 0 | 0 | 0 | 1 | 0 | .000 | .000 | .000 |
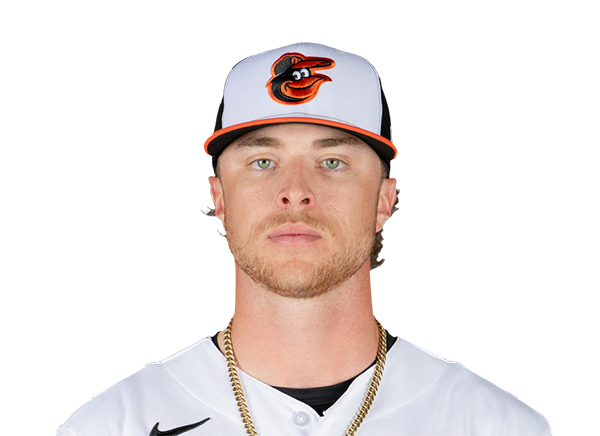 Reed Trimble | 2-3 | 3 | 0 | 2 | 1 | 0 | 0 | 0 | 0 | .400 | .400 | .400 |
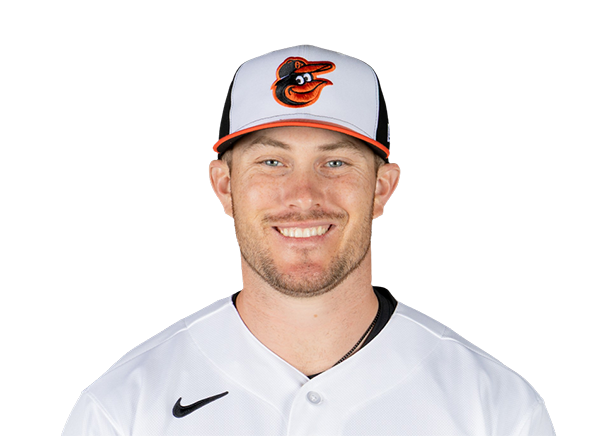 Will Robertson | 0-1 | 1 | 0 | 0 | 0 | 0 | 0 | 0 | 0 | .000 | .000 | .000 |
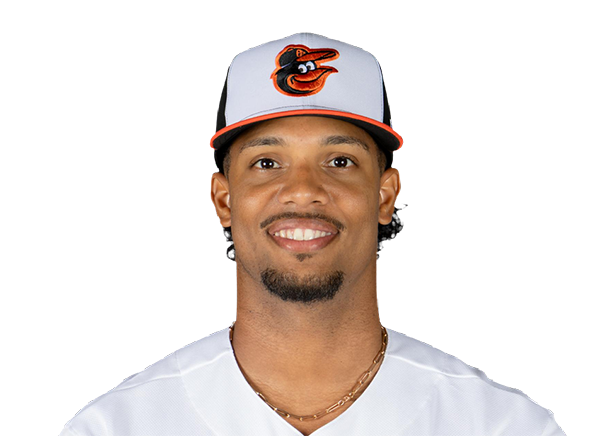 Jose Barrero | 1-3 | 3 | 0 | 1 | 1 | 0 | 0 | 0 | 0 | .200 | .200 | .400 |
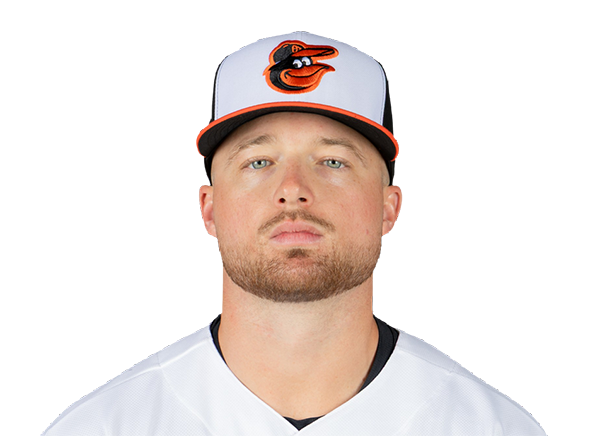 Payton Eeles | 0-0 | 0 | 0 | 0 | 0 | 0 | 0 | 0 | 0 | .000 | .000 | .000 |
|
Brandon Butterworth | 0-1 | 1 | 0 | 0 | 0 | 0 | 0 | 1 | 0 | .000 | .000 | .000 |
Detroit Tigers
| Player | H-AB | AB | R | H | RBI | HR | BB | K | #P | AVG | OBP | SLG |
|---|---|---|---|---|---|---|---|---|---|---|---|---|
 Parker Meadows | 0-3 | 3 | 0 | 0 | 0 | 0 | 0 | 0 | 0 | .000 | .000 | .000 |
 Max Clark | 1-2 | 2 | 0 | 1 | 1 | 0 | 0 | 1 | 0 | .400 | .400 | .400 |
 Austin Slater | 1-3 | 3 | 1 | 1 | 1 | 1 | 0 | 1 | 0 | .333 | .333 | 1.333 |
 Corey Julks | 1-2 | 2 | 0 | 1 | 0 | 0 | 0 | 0 | 0 | .500 | .500 | 1.500 |
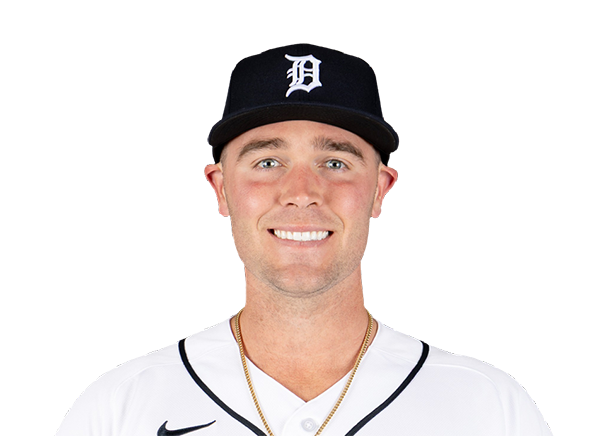 Kerry Carpenter | 0-3 | 3 | 0 | 0 | 0 | 0 | 0 | 2 | 0 | .000 | .000 | .000 |
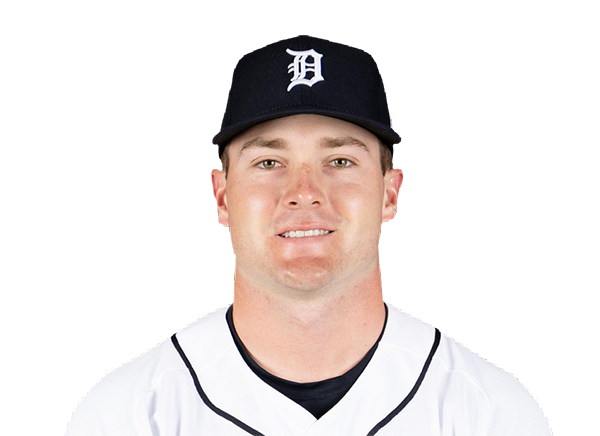 Kevin McGonigle | 0-1 | 1 | 0 | 0 | 0 | 0 | 0 | 1 | 0 | .333 | .333 | .333 |
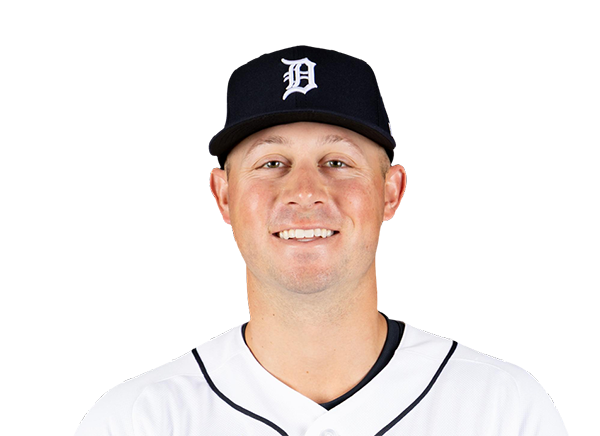 Spencer Torkelson | 1-3 | 3 | 1 | 1 | 0 | 0 | 0 | 1 | 0 | .333 | .333 | .667 |
|
Christopher Meyers | 0-0 | 0 | 0 | 0 | 0 | 0 | 1 | 0 | 0 | .000 | 1.000 | .000 |
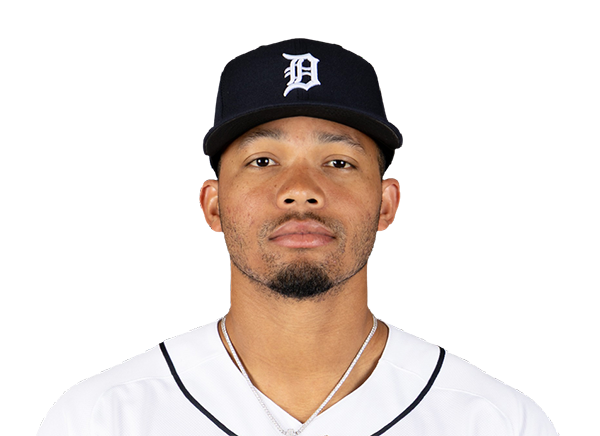 Wenceel Perez | 1-1 | 1 | 1 | 1 | 0 | 0 | 1 | 0 | 0 | 1.000 | 1.000 | 1.000 |
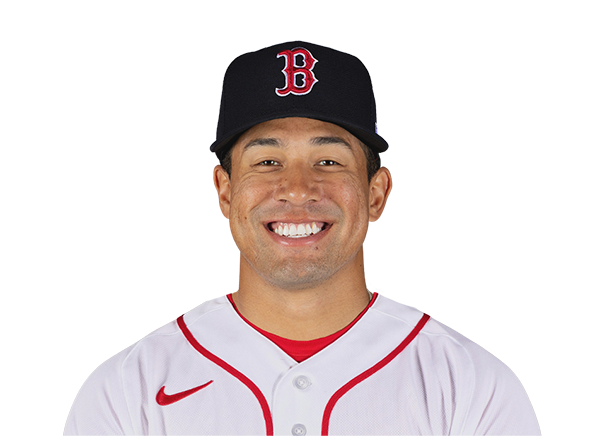 Jahmai Jones | 0-2 | 2 | 0 | 0 | 0 | 0 | 0 | 0 | 0 | .000 | .200 | .000 |
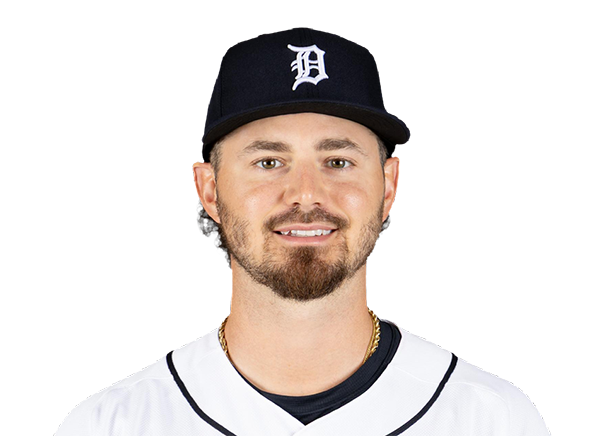 Zach McKinstry | 1-2 | 2 | 0 | 1 | 0 | 0 | 0 | 0 | 0 | .500 | .500 | .500 |
 Gage Workman | 0-2 | 2 | 0 | 0 | 0 | 0 | 0 | 1 | 0 | .000 | .000 | .000 |
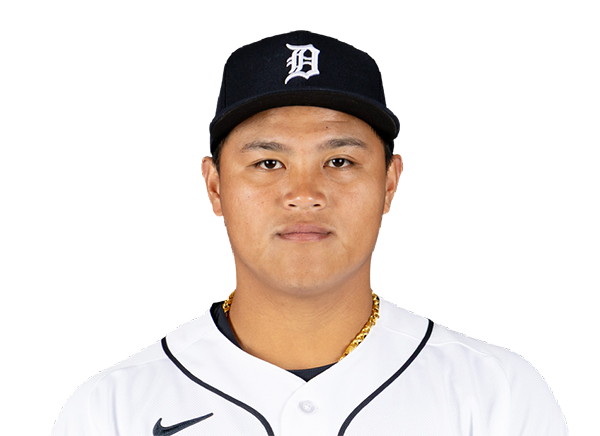 Hao-Yu Lee | 0-2 | 2 | 0 | 0 | 0 | 0 | 0 | 1 | 0 | .250 | .250 | .250 |
 Jace Jung | 0-2 | 2 | 0 | 0 | 0 | 0 | 0 | 0 | 0 | .000 | .000 | .000 |
 Max Anderson | 1-2 | 2 | 0 | 1 | 2 | 0 | 0 | 0 | 0 | .333 | .333 | .333 |
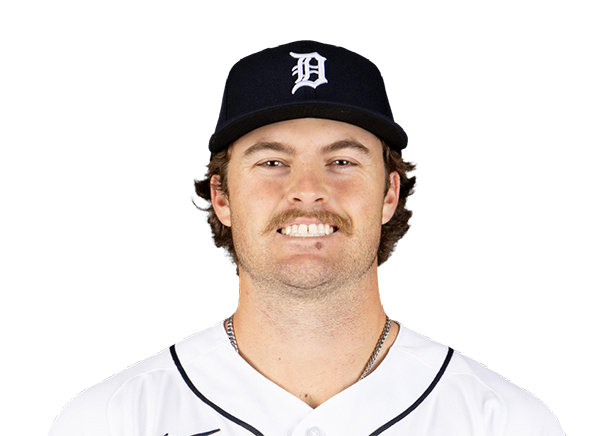 John Peck | 0-1 | 1 | 1 | 0 | 0 | 0 | 1 | 1 | 0 | .000 | .500 | .000 |
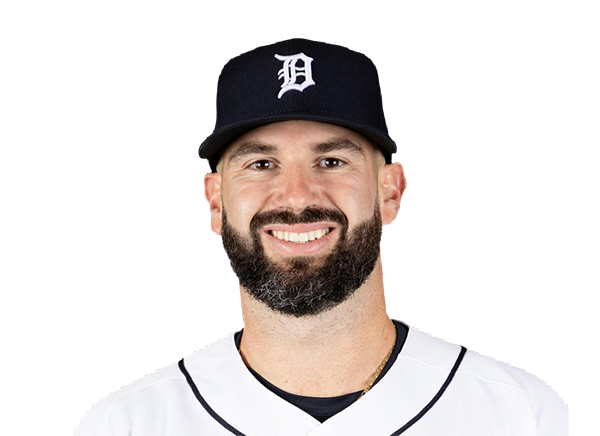 Tomas Nido | 0-1 | 1 | 0 | 0 | 0 | 0 | 0 | 1 | 0 | .000 | .500 | .000 |
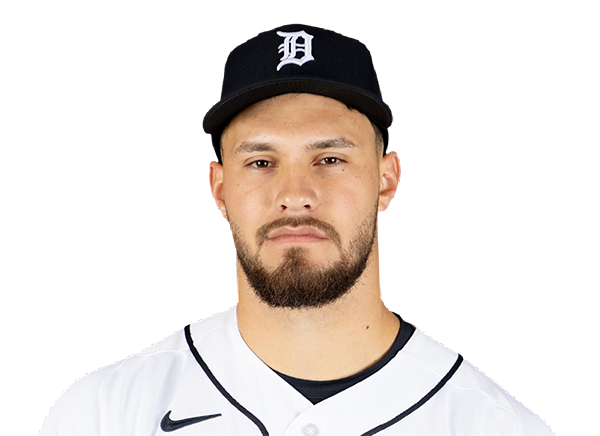 Josue Briceno | 0-2 | 2 | 0 | 0 | 0 | 0 | 0 | 0 | 0 | .000 | .000 | .000 |
Baltimore Orioles
| Player | IP | H | R | ER | BB | K | HR | PC-ST | ERA | PC |
|---|---|---|---|---|---|---|---|---|---|---|
 Kyle Bradish | 2.0 | 3 | 2 | 2 | 1 | 2 | 0 | ----- | 9.00 | -- |
 Brandon Young | 2.0 | 2 | 1 | 1 | 0 | 2 | 1 | ----- | 4.50 | -- |
 Cameron Foster | 1.0 | 0 | 0 | 0 | 0 | 2 | 0 | ----- | 0.00 | -- |
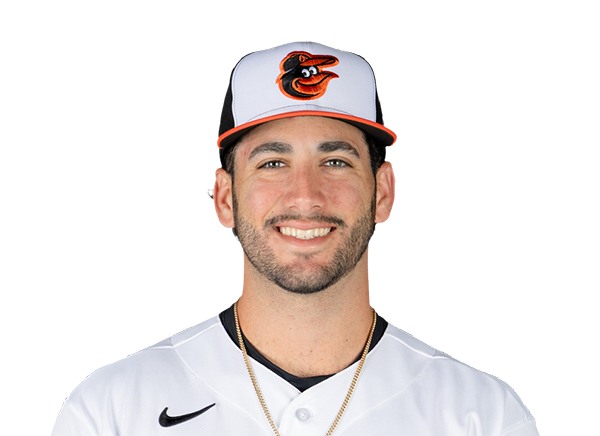 Anthony Nunez | 1.0 | 0 | 0 | 0 | 0 | 0 | 0 | ----- | 0.00 | -- |
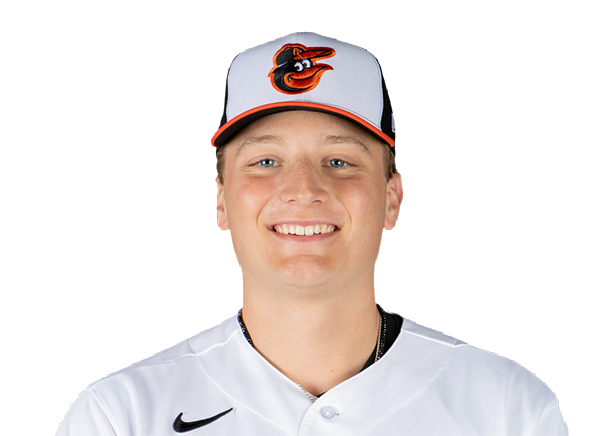 Cameron Weston | 2.0 | 1 | 0 | 0 | 1 | 4 | 0 | ----- | 0.00 | -- |
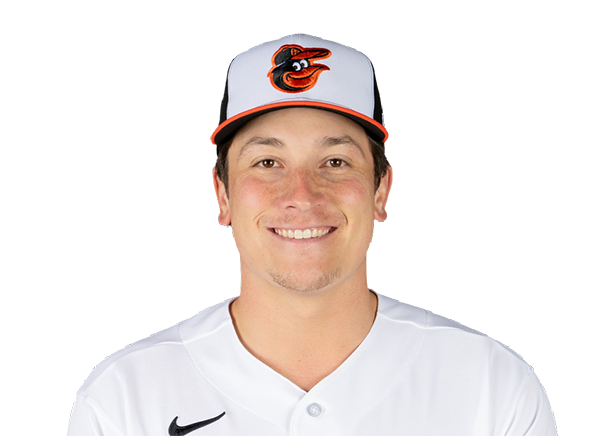 Andrew Magno | 1.0 | 1 | 1 | 1 | 1 | 0 | 0 | ----- | 9.00 | -- |
Detroit Tigers
| Player | IP | H | R | ER | BB | K | HR | PC-ST | ERA | PC |
|---|---|---|---|---|---|---|---|---|---|---|
 Jack Flaherty | 1.0 | 1 | 1 | 1 | 0 | 1 | 1 | ----- | 9.00 | -- |
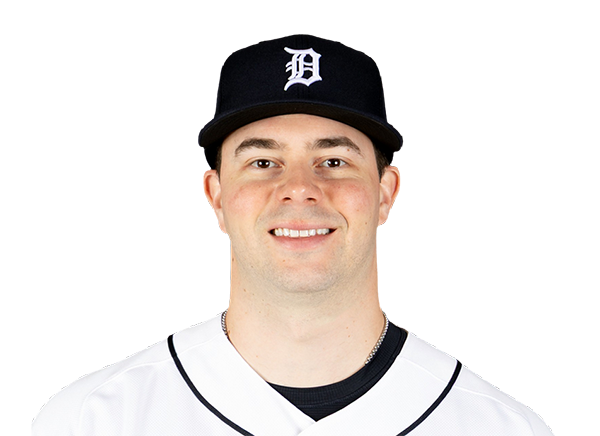 Scott Effross | 1.0 | 2 | 1 | 1 | 0 | 0 | 0 | ----- | 9.00 | -- |
 Konnor Pilkington | 1.0 | 2 | 1 | 1 | 0 | 1 | 1 | ----- | 9.00 | -- |
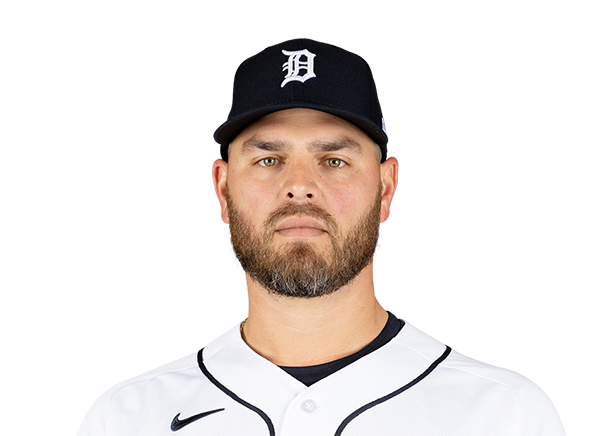 Tanner Rainey | 0.2 | 1 | 1 | 1 | 2 | 0 | 0 | ----- | 13.50 | -- |
|
Lael Lockhart | 0.1 | 0 | 0 | 0 | 0 | 0 | 0 | ----- | 0.00 | -- |
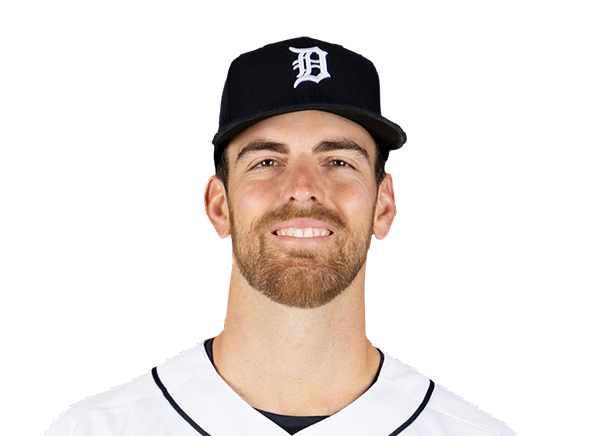 Bryan Sammons | 2.0 | 2 | 0 | 0 | 1 | 2 | 0 | ----- | 0.00 | -- |
 Sean Guenther | 1.0 | 0 | 0 | 0 | 0 | 0 | 0 | ----- | 0.00 | -- |
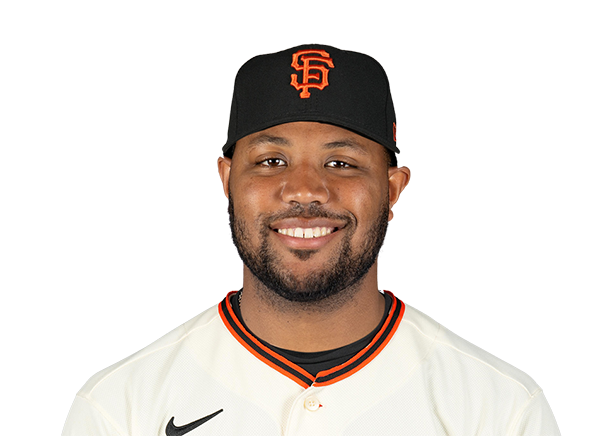 Dylan Smith | 1.0 | 1 | 0 | 0 | 0 | 2 | 0 | ----- | 0.00 | -- |
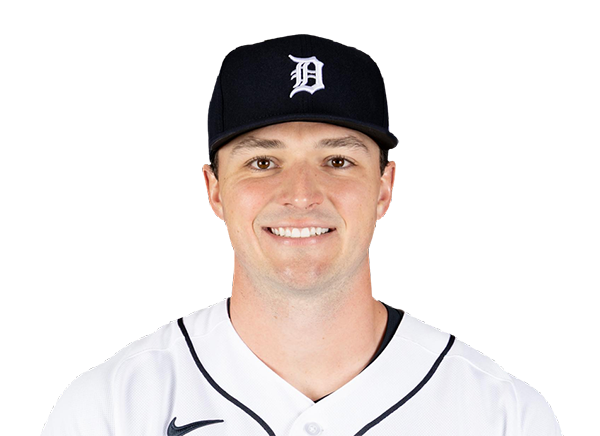 Tyler Mattison | 1.0 | 0 | 0 | 0 | 0 | 2 | 0 | ----- | 0.00 | -- |
H2H / Season Series
DET1–1
BAL
BAL6–5
DET
DET4–4
BAL
Last 5 Games
| Date | Opponent | Result |
|---|---|---|
| Sep 2 |  @ COL | L5–6 |
| Sep 1 | @ COL | L2–4 |
| Aug 31 | @ COL | W2–1 |
| Aug 30 |  @ ATH | W8–5 |
| Aug 29 | @ ATH | W5–3 |
| Date | Opponent | Result |
|---|---|---|
| Sep 2 |  @ MIN | W11–6 |
| Sep 1 | @ MIN | L2–15 |
| Aug 31 | @ MIN | L1–11 |
| Aug 30 |  vs LAD | L1–6 |
| Aug 29 | vs LAD | W2–1 |
Standings
American League
| Team | W | L | PCT | GB | DIFF | STRK |
|---|---|---|---|---|---|---|
1 Rays | 83 | 56 | .597 | - | +51 | L1 |
2 White Sox | 73 | 66 | .525 | 10 | +43 | L1 |
3 Astros | 71 | 69 | .507 | 12.5 | -42 | W1 |
4 Yankees | 80 | 60 | .571 | 3.5 | +115 | W2 |
5 Red Sox | 75 | 65 | .536 | 8.5 | +77 | L2 |
6 Guardians | 70 | 69 | .504 | 13 | -8 | L1 |
7 Rangers | 69 | 71 | .493 | 14.5 | -48 | L1 |
8 Blue Jays | 69 | 71 | .493 | 14.5 | -44 | W1 |
| 9Orioles | 69 | 71 | .493 | 14.5 | -20 | L2 |
| 10Twins | 67 | 73 | .479 | 16.5 | -38 | L1 |
11 Mariners | 66 | 74 | .471 | 17.5 | -65 | W2 |
| 12Tigers | 64 | 75 | .460 | 19 | +47 | W1 |
13 Royals | 62 | 78 | .443 | 21.5 | -89 | L3 |
| 14Athletics | 54 | 86 | .386 | 29.5 | -194 | W1 |
15 Angels | 53 | 87 | .379 | 30.5 | -80 | L2 |
National League
| Team | W | L | PCT | GB | DIFF | STRK |
|---|---|---|---|---|---|---|
1 Brewers | 87 | 53 | .621 | - | +172 | W2 |
2 Braves | 83 | 57 | .593 | 4 | +118 | W1 |
| 3Dodgers | 82 | 57 | .590 | 4.5 | +146 | L2 |
4 Phillies | 79 | 61 | .564 | 8 | +36 | L1 |
5 Cubs | 78 | 62 | .557 | 9 | +132 | L2 |
6 Diamondbacks | 74 | 67 | .525 | 13.5 | -1 | W1 |
7 Padres | 73 | 67 | .521 | 14 | +10 | L2 |
8 Marlins | 71 | 69 | .507 | 16 | +18 | W2 |
9 Cardinals | 70 | 70 | .500 | 17 | -8 | W2 |
10 Pirates | 68 | 72 | .486 | 19 | +26 | L1 |
11 Reds | 67 | 73 | .479 | 20 | -108 | W2 |
12 Nationals | 67 | 75 | .472 | 21 | +14 | L1 |
13 Mets | 63 | 77 | .450 | 24 | -50 | W1 |
14 Giants | 58 | 82 | .414 | 29 | -70 | W1 |
| 15Rockies | 54 | 86 | .386 | 33 | -140 | W2 |
BAL
VS
DET
Pitchers
Kyle Bradish
Brandon Young
Cameron Foster
Anthony Nunez
Cameron Weston
Andrew Magno
Catchers
Sam Huff
Creed Willems
Infielders
Pete Alonso
Ethan Anderson
Coby Mayo
Joshua Liranzo
Jeremiah Jackson
Aron Estrada
Jose Barrero
Payton Eeles
Brandon Butterworth
Outfielders
Colton Cowser
Enrique Bradfield Jr.
Heston Kjerstad
Thomas Sosa
Reed Trimble
Will Robertson
Designated Hitters
Samuel Basallo
Silas Ardoin
Pitchers
Jack Flaherty
Scott Effross
Konnor Pilkington
Tanner Rainey
Lael Lockhart
Bryan Sammons
Sean Guenther
Dylan Smith
Tyler Mattison
Catchers
Tomas Nido
Josue Briceno
Infielders
Spencer Torkelson
Christopher Meyers
Zach McKinstry
Gage Workman
Hao-Yu Lee
Jace Jung
Max Anderson
John Peck
Outfielders
Parker Meadows
Max Clark
Austin Slater
Corey Julks
Wenceel Perez
Jahmai Jones
Designated Hitters
Kerry Carpenter
Kevin McGonigle
Orioles
VS
Tigers
Batting
140
Team Games Played
139
4670
At Bats
4685
1098
Hits
1115
612
Runs Batted In
582
169
Home Runs
157
71
Stolen Bases
42
.235
Batting Average
.238
635
Runs
610
205
Doubles
217
19
Triples
28
1848
Total Bases
1859
523
Walks
484
1288
Strikeouts
1197
.317
On Base Percentage
.315
.396
Slugging Percentage
.397
.713
OBP Pct + SLG Pct
.711
140
Games Played
139
140
Games Started
139
53
Hit By Pitch
57
0.0
Wins Above Replacement
0.0
0.0
Offensive Wins Above Replacement
0.0
32
Caught Stealing
19
1
Is Qualified
1
594.4
Runs Created
595.6
4.3
Runs Created Per 27 Outs
4.3
.099
Walks Per Plate Appearance
.092
0.41
Walk To Strikeout Ratio
0.40
.161
Isolated Power
.159
.281
Secondary Average
.267
3.99
Pitches Per Plate Appearance
3.92
393
Extra Base Hits
402
5298
Plate Appearances
5277
27.6
At Bats Per Home Run
29.8
17
Sacrifice Hit
8
33
Sacrifice Flies
38
Pitching
140
Team Games Played
139
54
Quality Starts
51
69
Wins
64
71
Losses
75
39
Saves
27
78
Holds
64
1217
Hits
1077
577
Earned runs
506
147
Home Runs
143
462
Walks
439
1120
Strikeouts
1124
8.1
Strikeouts Per 9 Innings
8.2
145.9
Pitches Per Start
142.5
1.35
Walks Plus Hits Per Inning Pitched
1.23
4.16
Earned Run Average
3.70
71
Losses
75
1247.1
Innings pitched
1231.1
.493
Win Percentage
.460
60
Save Opportunities
57
.255
Opponent Batting Average
.233
.322
Opponent's On-base pct.
.307
.408
Opponent's Slugging pct.
.380
.730
Opponent's OPB Pct + SLG Pct
.687
4780
At Bats
4617
242
Doubles
212
25
Triples
19
40
Batters Hit
64
76
Stolen Bases
78
140
Games Played
139
1
Complete Games
0
2
Shutouts
14
42
Wild Pitches
34
627
Runs Batted In
536
2
Balks
3
1247.1
Innings pitched
1231.1
8.1
Strikeouts Per 9 Innings
8.2
34
Caught Stealing
29
140
Games Started
139
0.0
Wins Above Replacement
0.0
1
Is Qualified
1
655
Runs
563
577
Earned Runs
506
1950
Total Bases
1756
Fielding
140
Team Games Played
139
1247
Full Innings
1231
5020
Total Chances
5003
3742
Putouts
3694
1195
Assists
1243
83
Errors
66
205
Double Plays
217
0.983
Fielding Percentage
0.987
35.6
Range Factor
36.1
0.0
Zone Rating
0.0
140
Games Played
139
0
Games Started
0
0.0
Defensive Wins Above Replacement
0.0
1
Qualified
1