

Orioles vs Yankees Live Score (25 Sep, 2026)
Game Information
Stage
STD
Season
2026
First Pitch
Fri, Sep 25, 4:05 pm
Venue
Yankee Stadium
Location
Bronx, New York
Venue Type
Outdoor
Broadcast
MLB.TV
Attendance
0
Live Situation
0Balls
3Strikes
0Outs
—Pitcher
—At Bat
Pitch Sequence
1
STRIKE LOOKING
Sinker
98 MPH
2
STRIKE SWINGING
Slider
90 MPH
3
STRIKE LOOKING
Sinker
99 MPH
Injury Report


Team Stats
 BAL
NYY

10
Runs
2
13
Hits
9
1
Errors
0
4
Home Runs
0
6
Walks
1
12
Strikeouts
11
Player Box Score
Baltimore Orioles
| Player | H-AB | AB | R | H | RBI | HR | BB | K | #P | AVG | OBP | SLG |
|---|---|---|---|---|---|---|---|---|---|---|---|---|
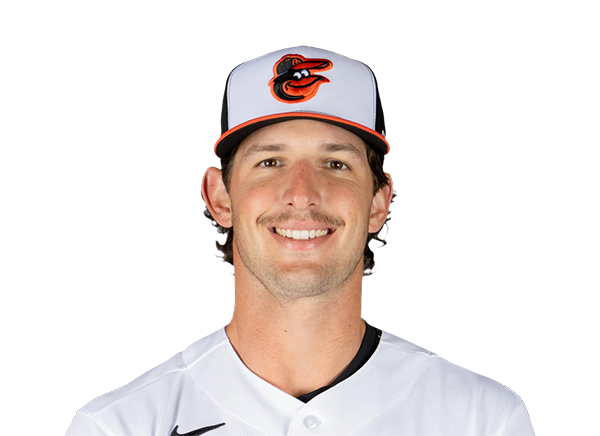 Dylan Beavers |
1-4 | 4 | 2 | 1 | 4 | 1 | 2 | 2 | 27 | .229 | .308 | .367 |
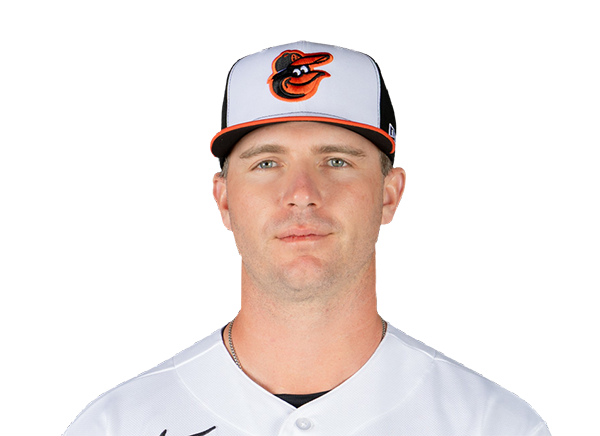 Pete Alonso |
3-5 | 5 | 2 | 3 | 3 | 2 | 0 | 1 | 14 | .267 | .361 | .523 |
 Gunnar Henderson |
2-5 | 5 | 0 | 2 | 1 | 0 | 0 | 2 | 18 | .226 | .311 | .404 |
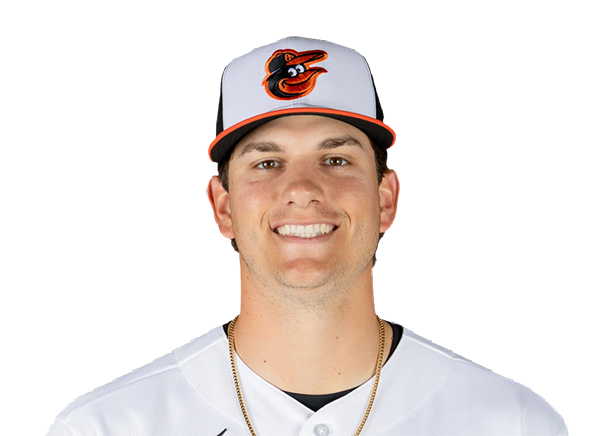 Coby Mayo |
0-4 | 4 | 1 | 0 | 0 | 0 | 1 | 3 | 30 | .223 | .292 | .458 |
 Christian Encarnacion-Strand |
2-5 | 5 | 0 | 2 | 0 | 0 | 0 | 1 | 17 | .277 | .325 | .513 |
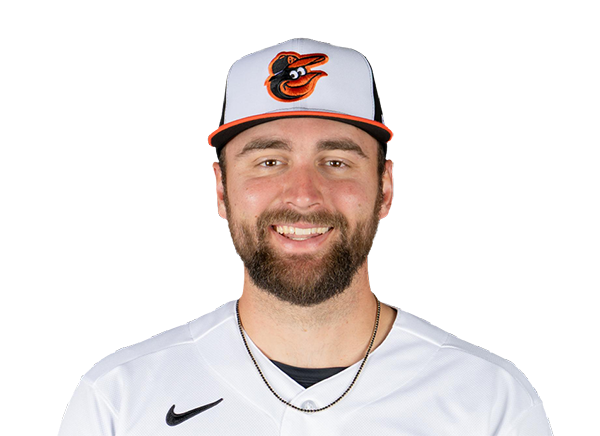 Colton Cowser |
2-4 | 4 | 1 | 2 | 0 | 0 | 1 | 0 | 24 | .226 | .317 | .370 |
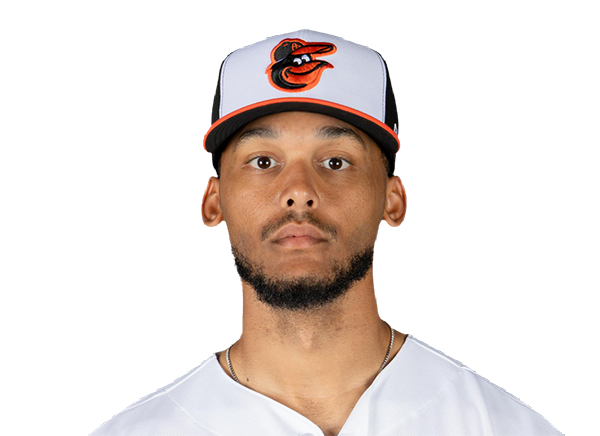 Jeremiah Jackson |
1-4 | 4 | 1 | 1 | 1 | 1 | 1 | 2 | 23 | .220 | .247 | .370 |
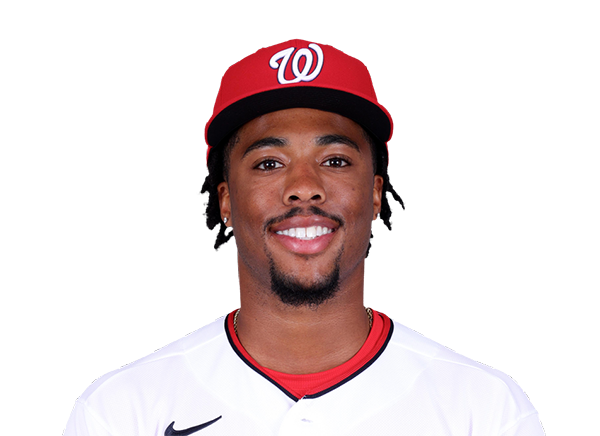 Christian Franklin |
2-5 | 5 | 2 | 2 | 1 | 0 | 0 | 1 | 14 | .156 | .296 | .200 |
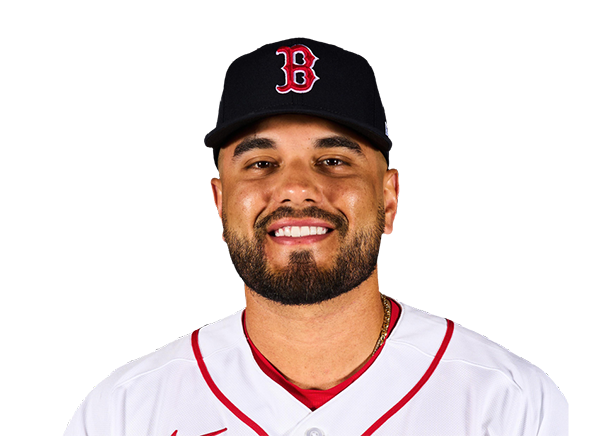 Carlos Narvaez |
0-4 | 4 | 1 | 0 | 0 | 0 | 1 | 0 | 21 | .161 | .241 | .226 |
New York Yankees
| Player | H-AB | AB | R | H | RBI | HR | BB | K | #P | AVG | OBP | SLG |
|---|---|---|---|---|---|---|---|---|---|---|---|---|
 Paul Goldschmidt |
0-4 | 4 | 0 | 0 | 1 | 0 | 0 | 0 | 16 | .252 | .313 | .452 |
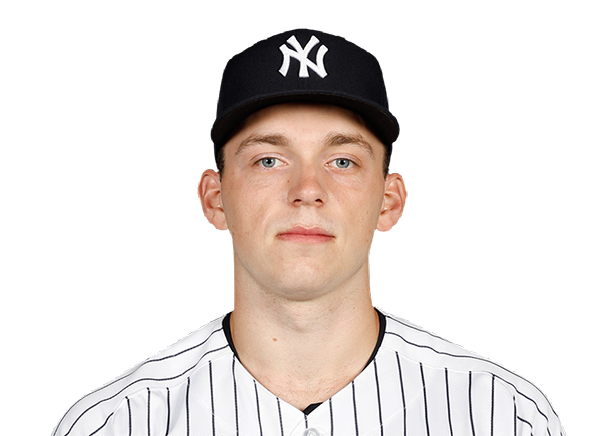 Ben Rice |
1-5 | 5 | 0 | 1 | 0 | 0 | 0 | 3 | 19 | .261 | .360 | .532 |
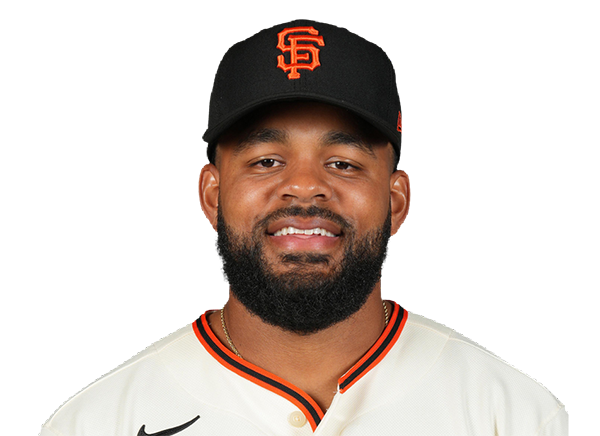 Heliot Ramos |
2-4 | 4 | 1 | 2 | 0 | 0 | 0 | 0 | 11 | .244 | .304 | .411 |
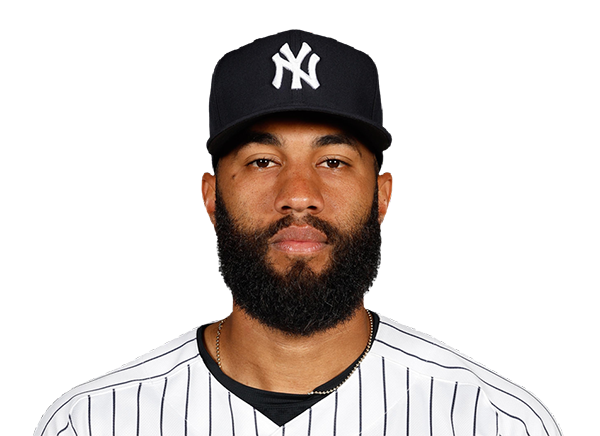 Amed Rosario |
2-4 | 4 | 0 | 2 | 1 | 0 | 0 | 1 | 14 | .238 | .279 | .405 |
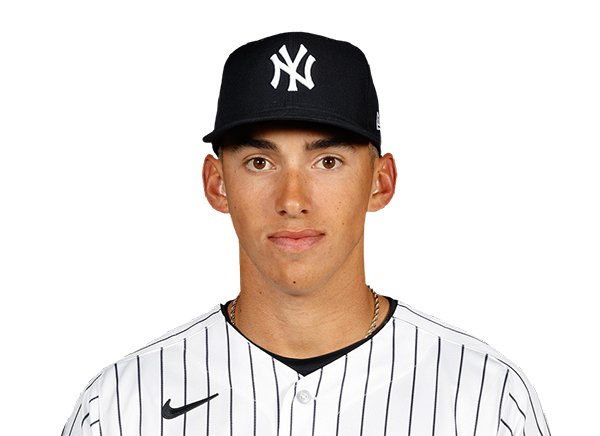 George Lombard Jr. |
0-4 | 4 | 0 | 0 | 0 | 0 | 0 | 2 | 16 | .237 | .285 | .414 |
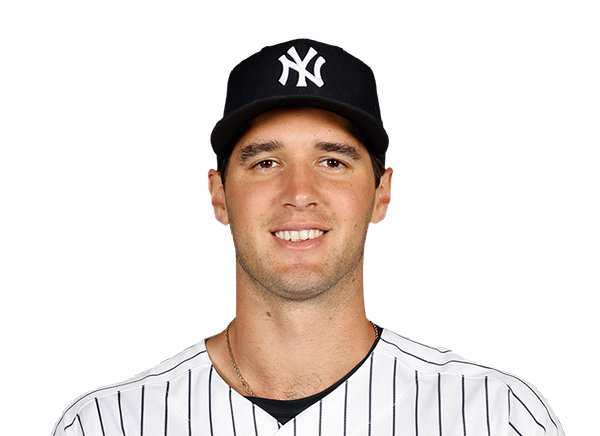 Spencer Jones |
1-4 | 4 | 1 | 1 | 0 | 0 | 0 | 1 | 12 | .245 | .313 | .432 |
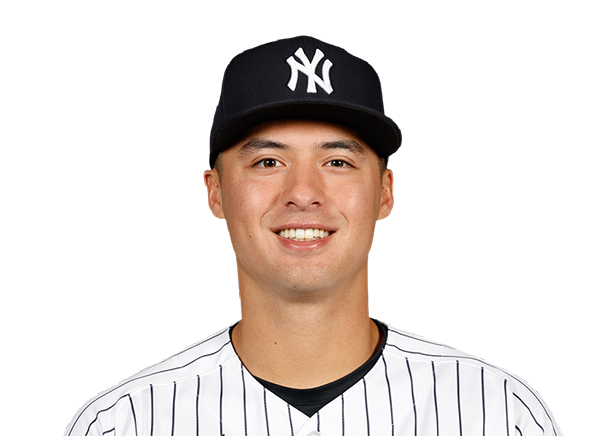 Anthony Volpe |
2-4 | 4 | 0 | 2 | 0 | 0 | 0 | 2 | 15 | .245 | .322 | .333 |
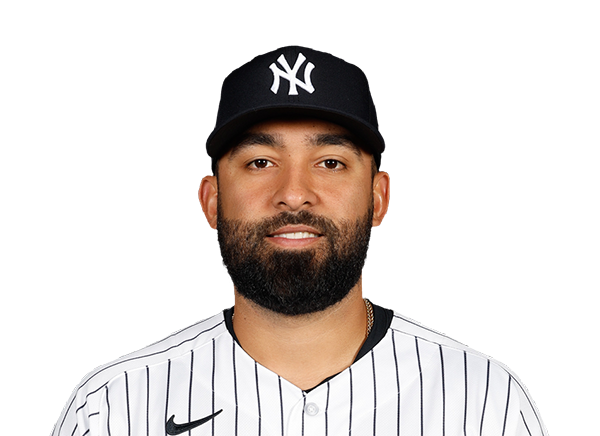 Ali Sanchez |
1-3 | 3 | 0 | 1 | 0 | 0 | 0 | 0 | 8 | .244 | .275 | .302 |
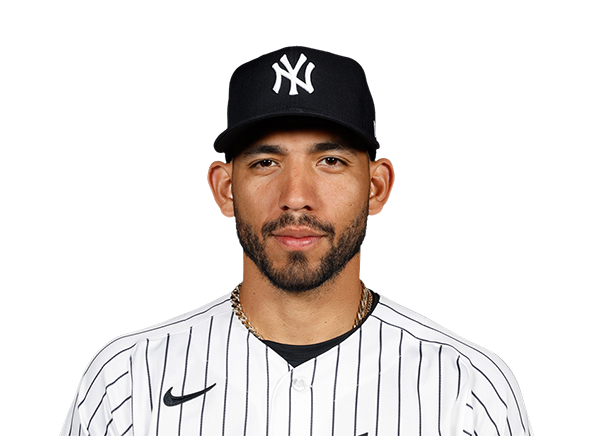 Jose Caballero |
0-3 | 3 | 0 | 0 | 0 | 0 | 1 | 2 | 24 | .231 | .290 | .365 |
Baltimore Orioles
| Player | IP | H | R | ER | BB | K | HR | PC-ST | ERA | PC |
|---|---|---|---|---|---|---|---|---|---|---|
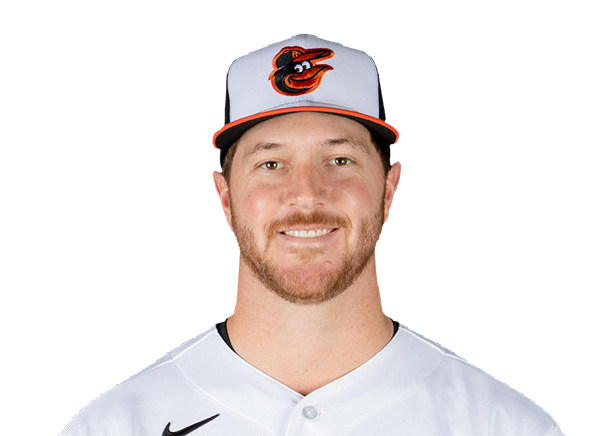 Trevor Rogers |
4.0 | 5 | 1 | 1 | 0 | 4 | 0 | 55-41 | 4.03 | 55 |
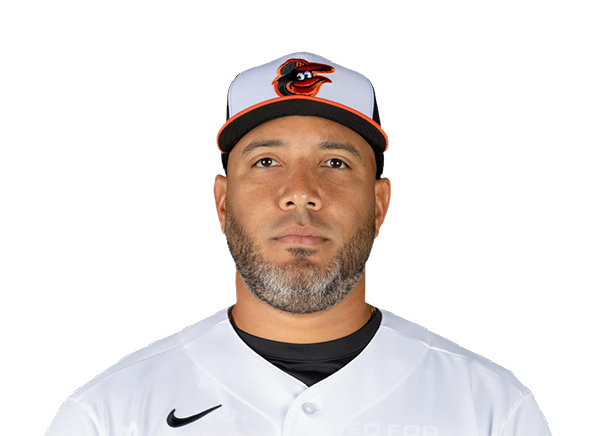 Albert Suarez |
4.0 | 3 | 0 | 0 | 0 | 5 | 0 | 58-41 | 3.86 | 58 |
 Alex Hoppe |
1.0 | 1 | 1 | 1 | 1 | 2 | 0 | 22-12 | 4.43 | 22 |
New York Yankees
| Player | IP | H | R | ER | BB | K | HR | PC-ST | ERA | PC |
|---|---|---|---|---|---|---|---|---|---|---|
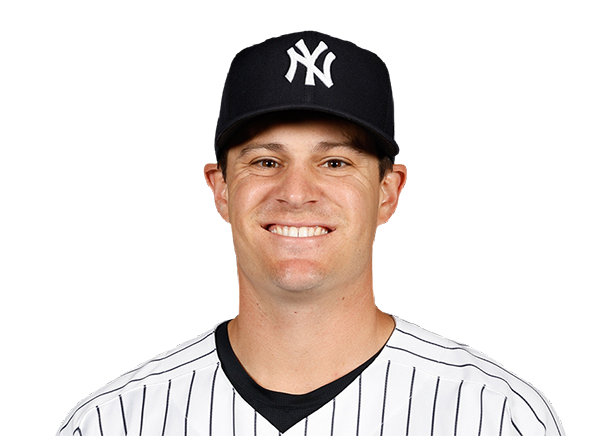 Brendan Beck |
5.0 | 6 | 7 | 7 | 3 | 8 | 2 | 97-60 | 9.95 | 97 |
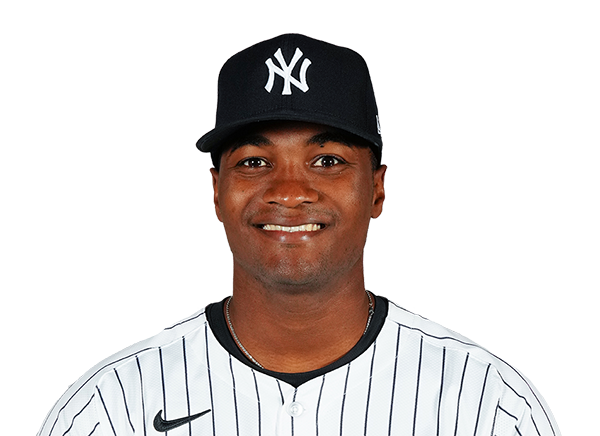 Yerry De los Santos |
2.0 | 4 | 2 | 2 | 0 | 2 | 2 | 43-27 | 2.05 | 43 |
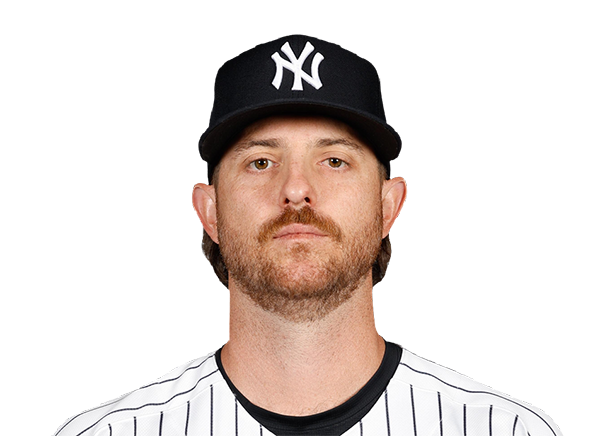 Paul Blackburn |
1.0 | 2 | 1 | 1 | 1 | 1 | 0 | 20-10 | 1.69 | 20 |
 David Bednar |
1.0 | 1 | 0 | 0 | 2 | 1 | 0 | 28-13 | 2.47 | 28 |
H2H / Season Series
NYY6–3
BAL
NYY2–10
BAL
BAL1–6
NYY
BAL3–5
NYY
BAL1–3
NYY
BAL7–0
NYY
BAL2–6
NYY
BAL3–2
NYY
NYY12–1
BAL
NYY11–3
BAL
Last 5 Games
| Date | Opponent | Result |
|---|---|---|
| Sep 25 | @ NYY | L3–6 |
| Sep 25 | @ NYY | W10–2 |
| Sep 23 |  vs TOR | W4–2 |
| Sep 23 | vs TOR | W4–2 |
| Sep 22 | vs TOR | T0–0 |
| Date | Opponent | Result |
|---|---|---|
| Sep 25 | vs BAL | W6–3 |
| Sep 25 | vs BAL | L2–10 |
| Sep 24 |  vs TB | W6–4 |
| Sep 23 | vs TB | W9–2 |
| Sep 22 | vs TB | L1–6 |
Standings
American League
| Team | W | L | PCT | GB | DIFF | STRK |
|---|---|---|---|---|---|---|
| 1Rays | 97 | 63 | .606 | - | +79 | W1 |
2 Guardians | 84 | 76 | .525 | 13 | +6 | W2 |
3 Astros | 79 | 81 | .494 | 18 | -52 | L1 |
| 4Yankees | 93 | 68 | .578 | 4.5 | +138 | W1 |
5 Red Sox | 87 | 74 | .540 | 10.5 | +82 | W2 |
6 White Sox | 83 | 77 | .519 | 14 | +57 | W2 |
7 Rangers | 79 | 81 | .494 | 18 | -48 | L1 |
| 8Orioles | 79 | 82 | .491 | 18.5 | -21 | L1 |
| 9Blue Jays | 78 | 82 | .488 | 19 | -46 | W1 |
10 Twins | 76 | 84 | .475 | 21 | -56 | W3 |
11 Tigers | 75 | 85 | .469 | 22 | +72 | W1 |
12 Mariners | 74 | 86 | .463 | 23 | -66 | L2 |
13 Royals | 68 | 92 | .425 | 29 | -115 | L2 |
14 Athletics | 64 | 96 | .400 | 33 | -218 | W1 |
15 Angels | 62 | 98 | .388 | 35 | -89 | W2 |
National League
| Team | W | L | PCT | GB | DIFF | STRK |
|---|---|---|---|---|---|---|
1 Brewers | 101 | 59 | .631 | - | +211 | W3 |
2 Dodgers | 98 | 62 | .613 | 3 | +196 | W1 |
3 Braves | 93 | 67 | .581 | 8 | +113 | L2 |
4 Padres | 89 | 71 | .556 | 12 | +33 | L1 |
5 Cubs | 88 | 73 | .547 | 13.5 | +143 | L2 |
6 Phillies | 87 | 73 | .544 | 14 | +22 | L3 |
7 Diamondbacks | 86 | 74 | .538 | 15 | +17 | W6 |
8 Pirates | 81 | 79 | .506 | 20 | +27 | L1 |
9 Marlins | 79 | 81 | .494 | 22 | +6 | W1 |
10 Cardinals | 77 | 83 | .481 | 24 | -26 | L2 |
11 Nationals | 76 | 84 | .475 | 25 | +10 | W3 |
12 Reds | 74 | 86 | .463 | 27 | -160 | L1 |
13 Mets | 73 | 87 | .456 | 28 | -36 | L2 |
14 Giants | 65 | 95 | .406 | 36 | -86 | L3 |
15 Rockies | 57 | 103 | .356 | 44 | -193 | L5 |
BAL
VS
NYY
Pitchers
Trevor Rogers
Catchers
Carlos Narvaez
Infielders
Pete Alonso
Gunnar Henderson
Christian Encarnacion-Strand
Jeremiah Jackson
Outfielders
Dylan Beavers
Colton Cowser
Christian Franklin
Designated Hitters
Coby Mayo
Pitchers
Brendan Beck
Catchers
Ali Sanchez
Infielders
Paul Goldschmidt
George Lombard Jr.
Anthony Volpe
Jose Caballero
Outfielders
Heliot Ramos
Amed Rosario
Spencer Jones
Designated Hitters
Ben Rice
Orioles
VS
Yankees
Batting
161
Team Games Played
161
5373
At Bats
5330
1257
Hits
1250
692
Runs Batted In
706
199
Home Runs
223
78
Stolen Bases
153
.234
Batting Average
.235
718
Runs
739
235
Doubles
224
20
Triples
19
2129
Total Bases
2181
586
Walks
572
1518
Strikeouts
1480
.314
On Base Percentage
.311
.396
Slugging Percentage
.409
.711
OBP Pct + SLG Pct
.720
161
Games Played
161
161
Games Started
161
62
Hit By Pitch
38
0.0
Wins Above Replacement
0.0
0.0
Offensive Wins Above Replacement
0.0
33
Caught Stealing
49
1
Is Qualified
1
679.5
Runs Created
696.5
4.3
Runs Created Per 27 Outs
4.4
.096
Walks Per Plate Appearance
.095
0.39
Walk To Strikeout Ratio
0.39
.162
Isolated Power
.175
.280
Secondary Average
.302
3.98
Pitches Per Plate Appearance
3.98
454
Extra Base Hits
466
6079
Plate Appearances
5997
27.0
At Bats Per Home Run
23.9
18
Sacrifice Hit
10
38
Sacrifice Flies
42
Pitching
161
Team Games Played
161
62
Quality Starts
65
79
Wins
93
82
Losses
68
46
Saves
45
84
Holds
86
1386
Hits
1204
651
Earned runs
519
169
Home Runs
165
535
Walks
488
1305
Strikeouts
1450
8.2
Strikeouts Per 9 Innings
9.1
146.1
Pitches Per Start
145.5
1.34
Walks Plus Hits Per Inning Pitched
1.17
4.08
Earned Run Average
3.24
82
Losses
68
1436.1
Innings pitched
1441.1
.491
Win Percentage
.578
68
Save Opportunities
73
.252
Opponent Batting Average
.224
.321
Opponent's On-base pct.
.294
.403
Opponent's Slugging pct.
.367
.725
Opponent's OPB Pct + SLG Pct
.661
5494
At Bats
5367
267
Doubles
218
28
Triples
26
50
Batters Hit
55
90
Stolen Bases
76
161
Games Played
161
1
Complete Games
0
2
Shutouts
15
45
Wild Pitches
35
709
Runs Batted In
575
4
Balks
3
1436.1
Innings pitched
1441.1
8.2
Strikeouts Per 9 Innings
9.1
38
Caught Stealing
22
161
Games Started
161
0.0
Wins Above Replacement
0.0
1
Is Qualified
1
739
Runs
601
651
Earned Runs
519
2216
Total Bases
1969
Fielding
161
Team Games Played
161
1436
Full Innings
1441
5779
Total Chances
5815
4309
Putouts
4324
1374
Assists
1395
96
Errors
96
235
Double Plays
224
0.983
Fielding Percentage
0.983
35.6
Range Factor
35.7
0.0
Zone Rating
0.0
161
Games Played
161
0
Games Started
0
0.0
Defensive Wins Above Replacement
0.0
1
Qualified
1