

Padres vs Orioles Live Score (14 Jun, 2026)
Game Information
Stage
Standard
Season
2026
First Pitch
Sun, Jun 14, 1:35 pm
Venue
Oriole Park at Camden Yards
Location
Baltimore, Maryland
Attendance
20,611
Live Situation
2Balls
0Strikes
0Outs
—Pitcher
—At Bat
Pitch Sequence
1
BALL
Four-seam FB
102 MPH
2
BALL
Four-seam FB
102 MPH
3
BALL IN PLAY
Four-seam FB
101 MPH
Injury Report





Team Stats
 SD
BAL


5
Runs
2
8
Hits
10
0
Errors
3
1
Home Runs
1
4
Walks
1
7
Strikeouts
10
Player Box Score
San Diego Padres
| Player | H-AB | AB | R | H | RBI | HR | BB | K | #P | AVG | OBP | SLG |
|---|---|---|---|---|---|---|---|---|---|---|---|---|
 Fernando Tatis Jr. | 2-4 | 4 | 0 | 2 | 2 | 0 | 0 | 0 | 13 | .282 | .347 | .350 |
 Jackson Merrill | 2-5 | 5 | 0 | 2 | 0 | 0 | 0 | 0 | 20 | .207 | .275 | .344 |
 Manny Machado | 0-4 | 4 | 0 | 0 | 0 | 0 | 1 | 2 | 22 | .175 | .254 | .359 |
 Xander Bogaerts | 0-3 | 3 | 0 | 0 | 0 | 0 | 1 | 0 | 11 | .228 | .309 | .349 |
 Gavin Sheets | 1-3 | 3 | 0 | 1 | 0 | 0 | 1 | 1 | 24 | .232 | .322 | .458 |
 Samad Taylor | 1-4 | 4 | 1 | 1 | 0 | 0 | 0 | 1 | 14 | .357 | .419 | .500 |
 Nick Solak | 0-2 | 2 | 0 | 0 | 0 | 0 | 0 | 0 | 5 | .250 | .200 | .250 |
 Will Wagner | 0-1 | 1 | 2 | 0 | 0 | 0 | 1 | 0 | 7 | .444 | .643 | .556 |
 Jase Bowen | 0-4 | 4 | 0 | 0 | 0 | 0 | 0 | 3 | 17 | .120 | .154 | .120 |
 Rodolfo Duran | 2-4 | 4 | 2 | 2 | 3 | 1 | 0 | 0 | 16 | .176 | .333 | .500 |
Baltimore Orioles
| Player | H-AB | AB | R | H | RBI | HR | BB | K | #P | AVG | OBP | SLG |
|---|---|---|---|---|---|---|---|---|---|---|---|---|
 Taylor Ward | 1-5 | 5 | 0 | 1 | 0 | 0 | 0 | 1 | 19 | .258 | .404 | .352 |
 Gunnar Henderson | 2-4 | 4 | 0 | 2 | 1 | 0 | 0 | 0 | 9 | .227 | .297 | .418 |
 Adley Rutschman | 0-4 | 4 | 0 | 0 | 0 | 0 | 0 | 2 | 19 | .265 | .343 | .481 |
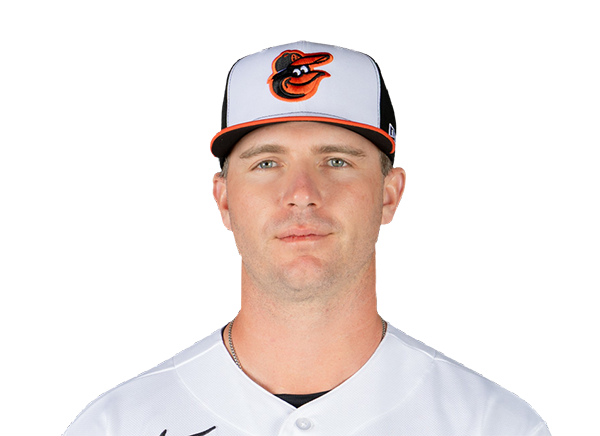 Pete Alonso | 1-3 | 3 | 0 | 1 | 0 | 0 | 1 | 0 | 22 | .253 | .335 | .473 |
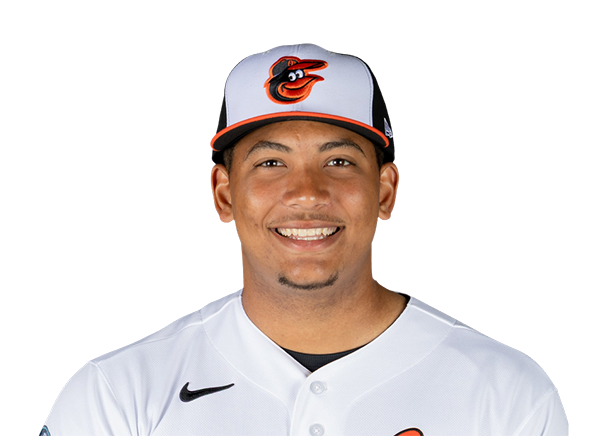 Samuel Basallo | 1-4 | 4 | 0 | 1 | 0 | 0 | 0 | 1 | 14 | .258 | .321 | .469 |
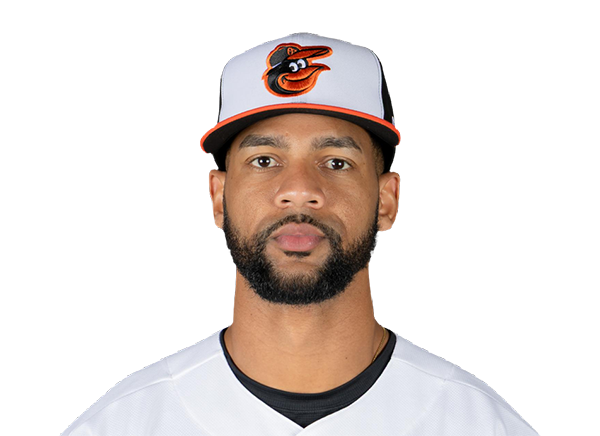 Leody Taveras | 1-3 | 3 | 0 | 1 | 0 | 0 | 0 | 0 | 13 | .259 | .343 | .373 |
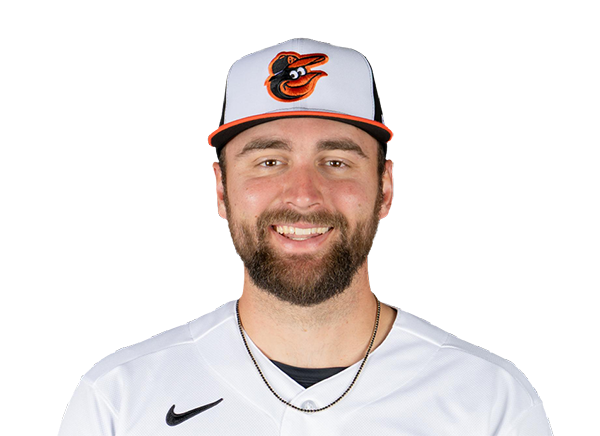 Colton Cowser | 1-3 | 3 | 0 | 1 | 0 | 0 | 0 | 1 | 14 | .223 | .312 | .385 |
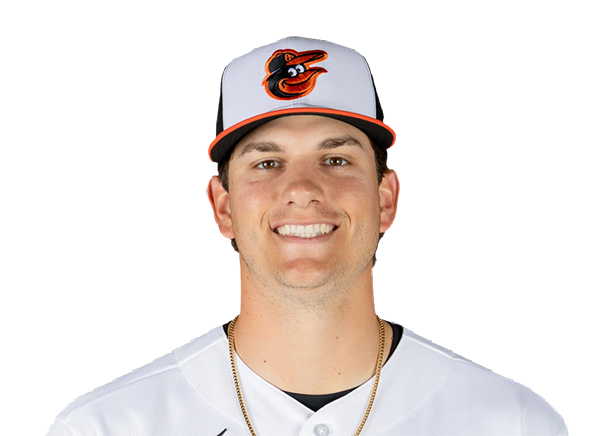 Coby Mayo | 0-1 | 1 | 0 | 0 | 0 | 0 | 0 | 1 | 6 | .194 | .259 | .383 |
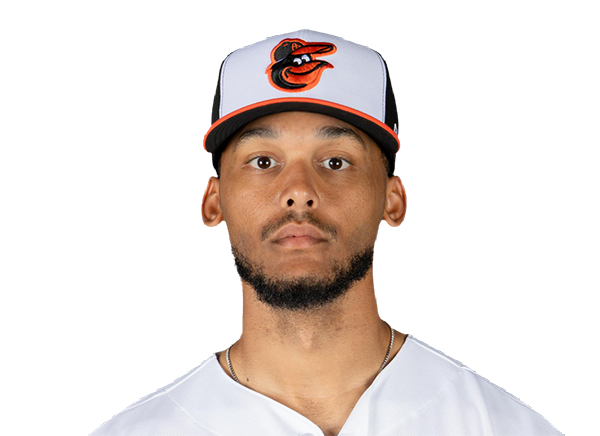 Jeremiah Jackson | 1-2 | 2 | 1 | 1 | 1 | 1 | 0 | 1 | 8 | .257 | .275 | .417 |
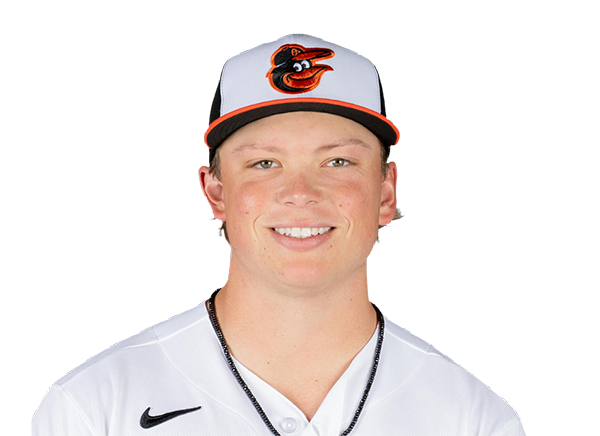 Jackson Holliday | 0-2 | 2 | 0 | 0 | 0 | 0 | 0 | 2 | 10 | .197 | .280 | .366 |
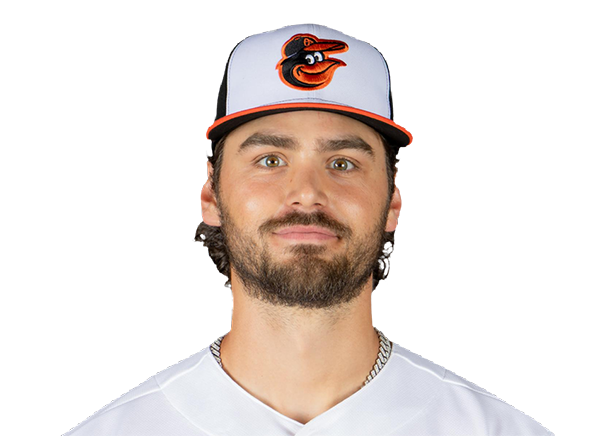 Blaze Alexander | 2-4 | 4 | 1 | 2 | 0 | 0 | 0 | 1 | 11 | .303 | .355 | .421 |
San Diego Padres
| Player | IP | H | R | ER | BB | K | HR | PC-ST | ERA | PC |
|---|---|---|---|---|---|---|---|---|---|---|
 Walker Buehler | 5.0 | 6 | 1 | 1 | 0 | 5 | 1 | 86-60 | 4.14 | 86 |
 Bradgley Rodriguez | 1.0 | 1 | 0 | 0 | 1 | 2 | 0 | 20-11 | 2.16 | 20 |
 Jason Adam | 0.1 | 2 | 1 | 1 | 0 | 0 | 0 | 8-5 | 1.78 | 8 |
 Adrian Morejon | 1.1 | 1 | 0 | 0 | 0 | 0 | 0 | 13-10 | 4.00 | 13 |
 Mason Miller | 1.1 | 0 | 0 | 0 | 0 | 3 | 0 | 18-12 | 0.90 | 18 |
Baltimore Orioles
| Player | IP | H | R | ER | BB | K | HR | PC-ST | ERA | PC |
|---|---|---|---|---|---|---|---|---|---|---|
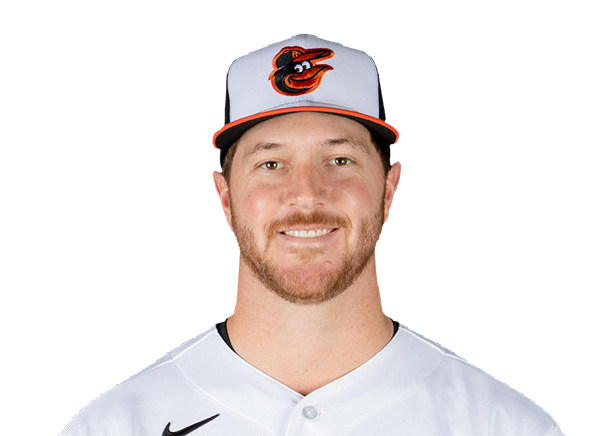 Trevor Rogers | 6.0 | 5 | 2 | 2 | 2 | 4 | 0 | 82-55 | 5.86 | 82 |
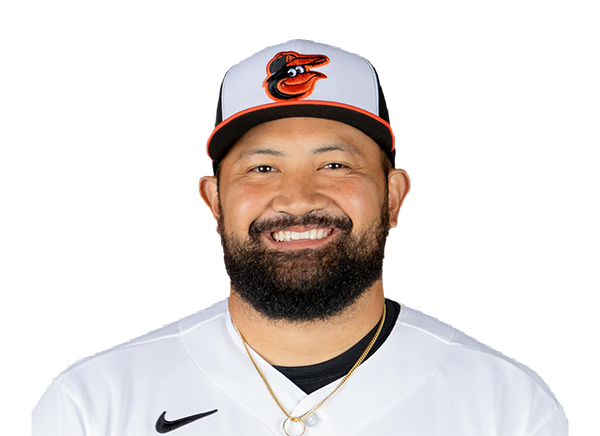 Rico Garcia | 1.0 | 1 | 2 | 2 | 1 | 1 | 1 | 19-10 | 1.82 | 19 |
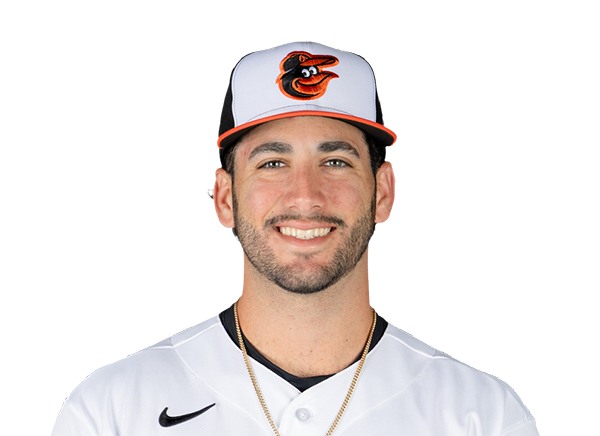 Anthony Nunez | 1.0 | 1 | 0 | 0 | 1 | 0 | 0 | 23-15 | 4.98 | 23 |
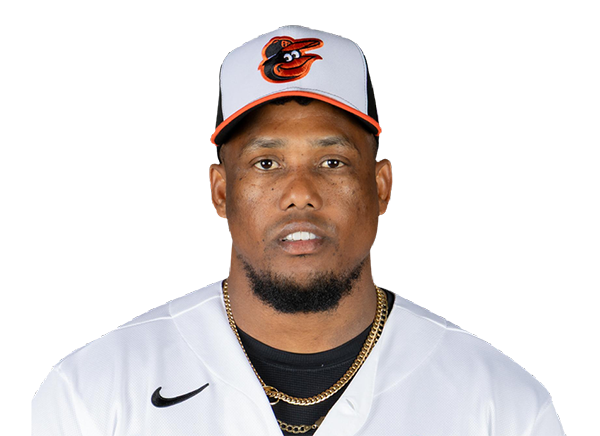 Yennier Cano | 1.0 | 1 | 1 | 0 | 0 | 2 | 0 | 25-16 | 2.19 | 25 |
H2H / Season Series
BAL2–5
SD
BAL3–9
SD
BAL7–3
SD
Last 5 Games
| Date | Opponent | Result |
|---|---|---|
| Aug 22 |  vs MIN | W7–5 |
| Aug 21 | vs MIN | W6–2 |
| Aug 19 |  @ NYM | L2–4 |
| Aug 18 | @ NYM | W5–2 |
| Aug 17 | @ NYM | L1–2 |
| Date | Opponent | Result |
|---|---|---|
| Aug 22 |  vs TB | W3–2 |
| Aug 21 | vs TB | W5–3 |
| Aug 20 |  vs NYY | L1–6 |
| Aug 19 | vs NYY | L3–5 |
| Aug 18 | vs NYY | L1–3 |
Standings
American League
| Team | W | L | PCT | GB | DIFF | STRK |
|---|---|---|---|---|---|---|
| 1Rays | 76 | 53 | .589 | - | +42 | L3 |
2 White Sox | 67 | 62 | .519 | 9 | +42 | L1 |
3 Astros | 65 | 65 | .500 | 11.5 | -43 | L1 |
| 4Yankees | 73 | 56 | .566 | 3 | +95 | L1 |
5 Red Sox | 70 | 59 | .543 | 6 | +98 | W2 |
6 Rangers | 64 | 66 | .492 | 12.5 | -48 | L1 |
7 Blue Jays | 64 | 67 | .489 | 13 | -50 | W1 |
| 8Twins | 63 | 66 | .488 | 13 | -45 | L1 |
9 Guardians | 63 | 66 | .488 | 13 | -15 | W2 |
| 10Orioles | 63 | 67 | .485 | 13.5 | -33 | W2 |
11 Mariners | 62 | 68 | .477 | 14.5 | -44 | W2 |
12 Tigers | 61 | 68 | .473 | 15 | +77 | L4 |
13 Royals | 57 | 74 | .435 | 20 | -95 | W7 |
14 Angels | 52 | 78 | .400 | 24.5 | -68 | W1 |
15 Athletics | 50 | 80 | .385 | 26.5 | -188 | W1 |
National League
| Team | W | L | PCT | GB | DIFF | STRK |
|---|---|---|---|---|---|---|
1 Brewers | 81 | 49 | .623 | - | +163 | W3 |
2 Dodgers | 79 | 51 | .608 | 2 | +147 | W5 |
3 Braves | 75 | 55 | .577 | 6 | +108 | L2 |
4 Cubs | 74 | 56 | .569 | 7 | +98 | L3 |
5 Phillies | 72 | 58 | .554 | 9 | +25 | W8 |
| 6Padres | 69 | 60 | .535 | 11.5 | +7 | W1 |
7 Diamondbacks | 68 | 61 | .527 | 12.5 | +13 | W2 |
8 Marlins | 66 | 64 | .508 | 15 | +17 | W2 |
9 Cardinals | 66 | 65 | .504 | 15.5 | 0 | L2 |
10 Pirates | 63 | 68 | .481 | 18.5 | +29 | L2 |
11 Reds | 61 | 68 | .473 | 19.5 | -98 | L2 |
12 Nationals | 61 | 70 | .466 | 20.5 | +14 | L3 |
| 13Mets | 59 | 71 | .454 | 22 | -39 | W1 |
14 Giants | 52 | 77 | .403 | 28.5 | -79 | L3 |
15 Rockies | 50 | 78 | .391 | 30 | -130 | L4 |
SD
VS
BAL
Pitchers
Walker Buehler
Bradgley Rodriguez
Jason Adam
Adrian Morejon
Mason Miller
Catchers
Rodolfo Duran
Infielders
Fernando Tatis Jr.
Manny Machado
Xander Bogaerts
Gavin Sheets
Outfielders
Jackson Merrill
Samad Taylor
Jase Bowen
Designated Hitters
Nick Solak
Will Wagner
Pitchers
Trevor Rogers
Rico Garcia
Anthony Nunez
Yennier Cano
Catchers
Samuel Basallo
Infielders
Gunnar Henderson
Pete Alonso
Coby Mayo
Jeremiah Jackson
Jackson Holliday
Outfielders
Taylor Ward
Leody Taveras
Colton Cowser
Blaze Alexander
Designated Hitters
Adley Rutschman
Padres
VS
Orioles
Batting
129
Team Games Played
129
4243
At Bats
4283
1010
Hits
1010
530
Runs Batted In
559
144
Home Runs
157
124
Stolen Bases
68
.238
Batting Average
.236
549
Runs
579
187
Doubles
185
11
Triples
18
1651
Total Bases
1702
443
Walks
490
1047
Strikeouts
1188
.315
On Base Percentage
.319
.389
Slugging Percentage
.397
.704
OBP Pct + SLG Pct
.716
129
Games Played
129
129
Games Started
129
51
Hit By Pitch
48
0.0
Wins Above Replacement
0.0
0.0
Offensive Wins Above Replacement
0.0
33
Caught Stealing
29
1
Is Qualified
1
530.3
Runs Created
551.4
4.2
Runs Created Per 27 Outs
4.3
.092
Walks Per Plate Appearance
.101
0.42
Walk To Strikeout Ratio
0.41
.151
Isolated Power
.162
.277
Secondary Average
.285
3.92
Pitches Per Plate Appearance
4.00
342
Extra Base Hits
360
4792
Plate Appearances
4871
29.5
At Bats Per Home Run
27.3
19
Sacrifice Hit
16
35
Sacrifice Flies
32
Pitching
129
Team Games Played
129
28
Quality Starts
51
69
Wins
62
60
Losses
67
38
Saves
34
80
Holds
68
1037
Hits
1117
510
Earned runs
538
140
Home Runs
138
442
Walks
427
1043
Strikeouts
1031
8.2
Strikeouts Per 9 Innings
8.1
146.7
Pitches Per Start
145.7
1.30
Walks Plus Hits Per Inning Pitched
1.35
4.03
Earned Run Average
4.22
60
Losses
67
1139.0
Innings pitched
1146.2
.535
Win Percentage
.481
53
Save Opportunities
52
.242
Opponent Batting Average
.254
.319
Opponent's On-base pct.
.322
.392
Opponent's Slugging pct.
.410
.710
Opponent's OPB Pct + SLG Pct
.732
4280
At Bats
4397
187
Doubles
224
16
Triples
23
51
Batters Hit
37
81
Stolen Bases
69
129
Games Played
129
0
Complete Games
1
9
Shutouts
2
34
Wild Pitches
40
524
Runs Batted In
586
3
Balks
2
1139.0
Innings pitched
1146.2
8.2
Strikeouts Per 9 Innings
8.1
40
Caught Stealing
30
129
Games Started
129
0.0
Wins Above Replacement
0.0
1
Is Qualified
1
542
Runs
613
510
Earned Runs
538
1676
Total Bases
1801
Fielding
129
Team Games Played
129
1139
Full Innings
1147
4606
Total Chances
4629
3417
Putouts
3440
1134
Assists
1107
55
Errors
82
187
Double Plays
185
0.988
Fielding Percentage
0.982
36.0
Range Factor
35.7
0.0
Zone Rating
0.0
129
Games Played
129
0
Games Started
0
0.0
Defensive Wins Above Replacement
0.0
1
Qualified
1