

Pirates vs Diamondbacks Live Score (7 May, 2026)
Game Information
Stage
Standard
Season
2026
First Pitch
Wed, May 6, 9:40 pm
Venue
Chase Field
Location
Phoenix, Arizona
Attendance
21,719
Live Situation
1Balls
1Strikes
0Outs
—Pitcher
—At Bat
Pitch Sequence
1
STRIKE SWINGING
Four-seam FB
97 MPH
2
BALL
Four-seam FB
97 MPH
3
BALL IN PLAY
Four-seam FB
96 MPH
Injury Report
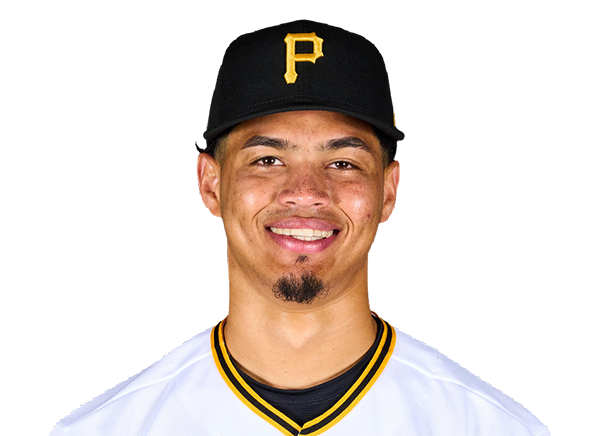

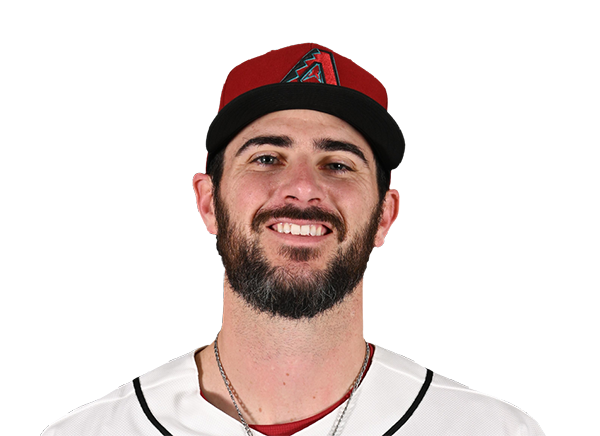


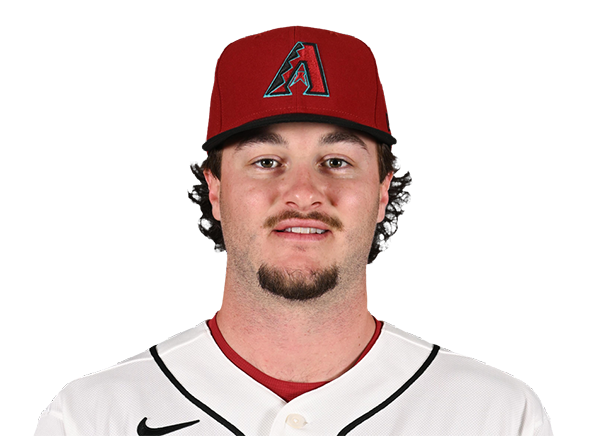
Team Stats
 PIT
ARI


1
Runs
0
7
Hits
2
0
Errors
0
1
Home Runs
0
2
Walks
1
7
Strikeouts
8
Player Box Score
Pittsburgh Pirates
| Player | H-AB | AB | R | H | RBI | HR | BB | K | #P | AVG | OBP | SLG |
|---|---|---|---|---|---|---|---|---|---|---|---|---|
 Oneil Cruz | 0-4 | 4 | 0 | 0 | 0 | 0 | 0 | 1 | 11 | .250 | .306 | .473 |
 Brandon Lowe | 2-4 | 4 | 1 | 2 | 1 | 1 | 0 | 0 | 16 | .252 | .360 | .546 |
 Bryan Reynolds | 2-4 | 4 | 0 | 2 | 0 | 0 | 0 | 1 | 10 | .260 | .402 | .420 |
 Ryan O'Hearn | 0-3 | 3 | 0 | 0 | 0 | 0 | 1 | 0 | 17 | .294 | .381 | .452 |
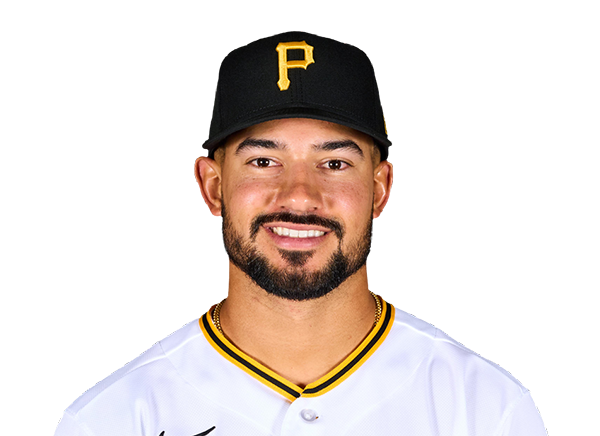 Nick Gonzales | 0-3 | 3 | 0 | 0 | 0 | 0 | 0 | 1 | 16 | .309 | .366 | .350 |
 Jared Triolo | 0-0 | 0 | 0 | 0 | 0 | 0 | 0 | 0 | 0 | .222 | .300 | .296 |
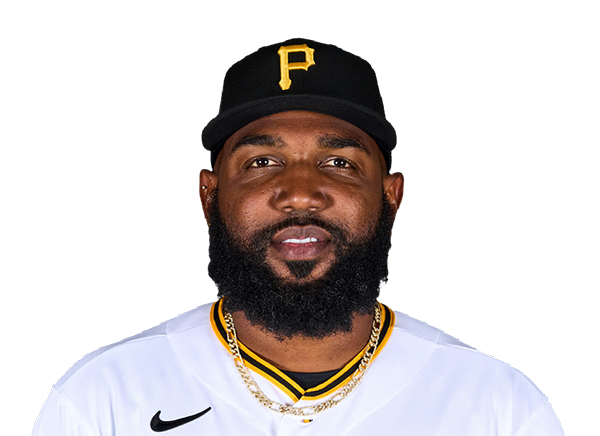 Marcell Ozuna | 1-4 | 4 | 0 | 1 | 0 | 0 | 0 | 0 | 13 | .186 | .256 | .288 |
 Spencer Horwitz | 1-4 | 4 | 0 | 1 | 0 | 0 | 0 | 1 | 11 | .242 | .358 | .384 |
 Billy Cook | 0-0 | 0 | 0 | 0 | 0 | 0 | 0 | 0 | 0 | .308 | .308 | .308 |
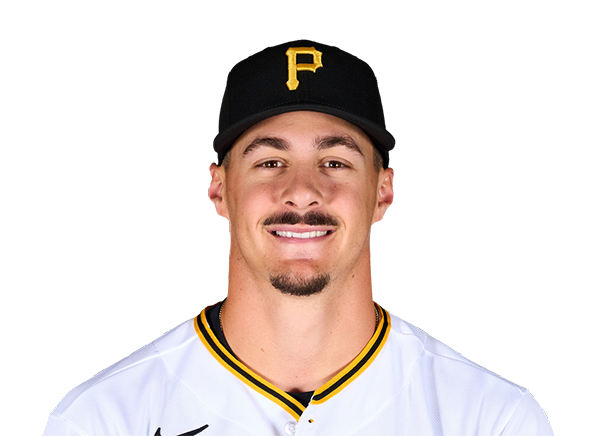 Konnor Griffin | 1-4 | 4 | 0 | 1 | 0 | 0 | 0 | 2 | 15 | .266 | .331 | .404 |
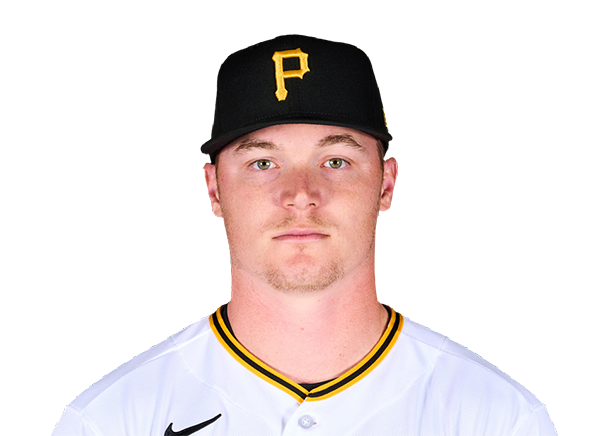 Henry Davis | 0-3 | 3 | 0 | 0 | 0 | 0 | 1 | 1 | 20 | .156 | .253 | .273 |
Arizona Diamondbacks
| Player | H-AB | AB | R | H | RBI | HR | BB | K | #P | AVG | OBP | SLG |
|---|---|---|---|---|---|---|---|---|---|---|---|---|
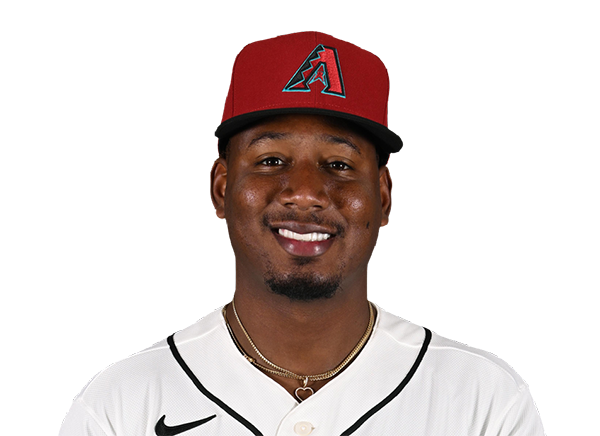 Geraldo Perdomo | 0-3 | 3 | 0 | 0 | 0 | 0 | 1 | 1 | 15 | .239 | .351 | .394 |
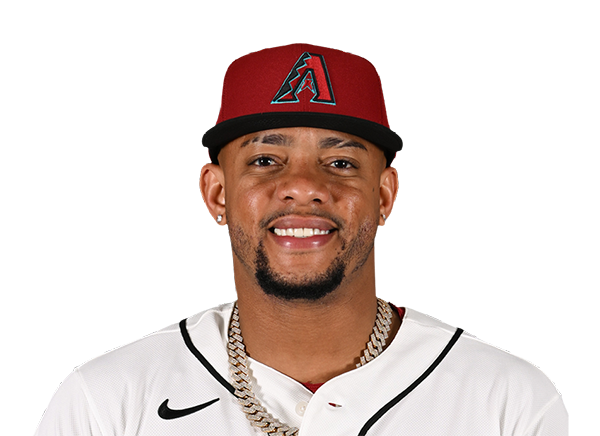 Ketel Marte | 0-4 | 4 | 0 | 0 | 0 | 0 | 0 | 0 | 16 | .215 | .269 | .363 |
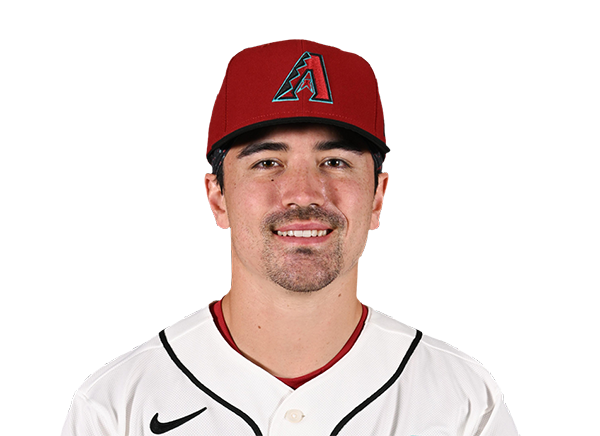 Corbin Carroll | 0-4 | 4 | 0 | 0 | 0 | 0 | 0 | 0 | 12 | .256 | .355 | .487 |
 Adrian Del Castillo | 0-3 | 3 | 0 | 0 | 0 | 0 | 0 | 1 | 12 | .214 | .243 | .386 |
 Ildemaro Vargas | 0-3 | 3 | 0 | 0 | 0 | 0 | 0 | 0 | 6 | .364 | .386 | .627 |
 Lourdes Gurriel Jr. | 1-3 | 3 | 0 | 1 | 0 | 0 | 0 | 1 | 14 | .255 | .340 | .298 |
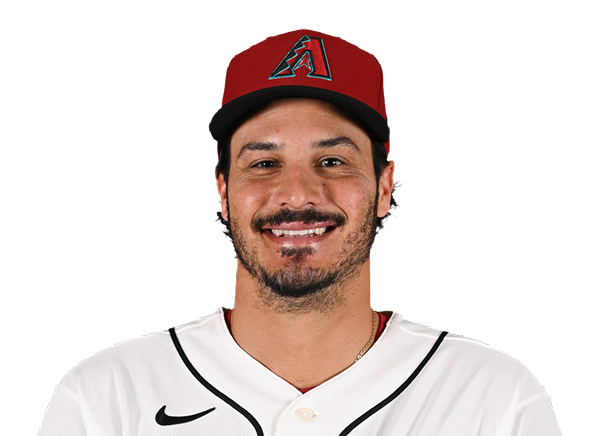 Nolan Arenado | 1-3 | 3 | 0 | 1 | 0 | 0 | 0 | 1 | 9 | .274 | .325 | .434 |
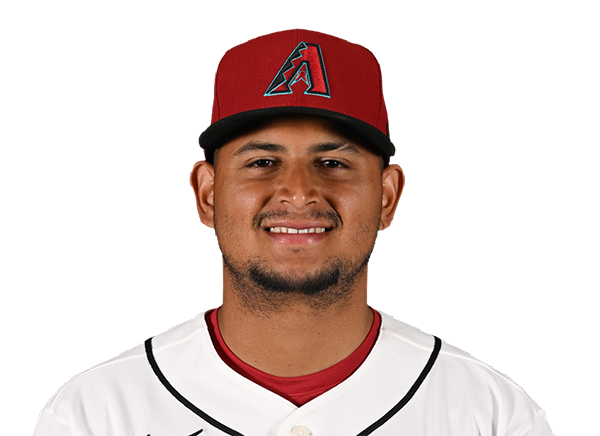 Gabriel Moreno | 0-3 | 3 | 0 | 0 | 0 | 0 | 0 | 2 | 14 | .250 | .295 | .411 |
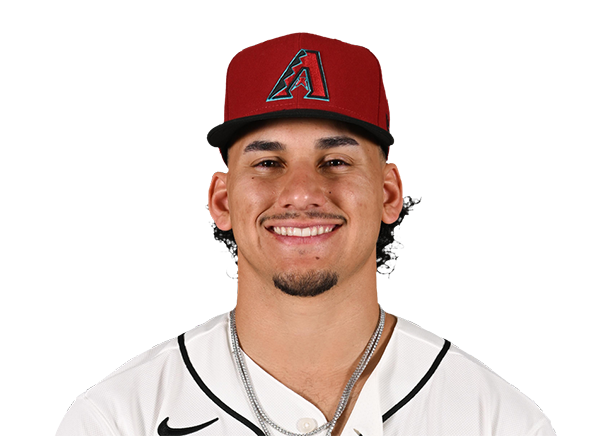 Alek Thomas | 0-2 | 2 | 0 | 0 | 0 | 0 | 0 | 1 | 10 | .185 | .227 | .348 |
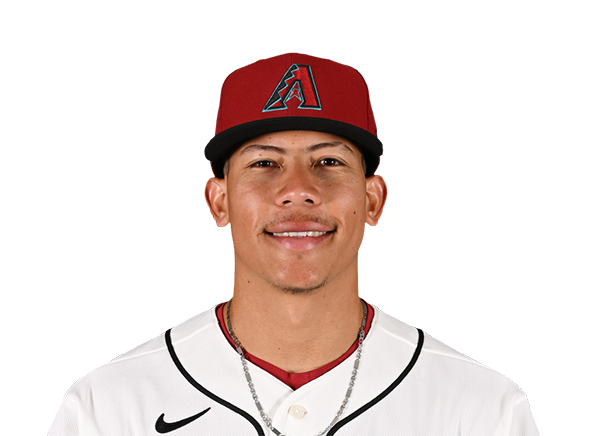 Jose Fernandez | 0-1 | 1 | 0 | 0 | 0 | 0 | 0 | 1 | 4 | .301 | .337 | .430 |
Pittsburgh Pirates
| Player | IP | H | R | ER | BB | K | HR | PC-ST | ERA | PC |
|---|---|---|---|---|---|---|---|---|---|---|
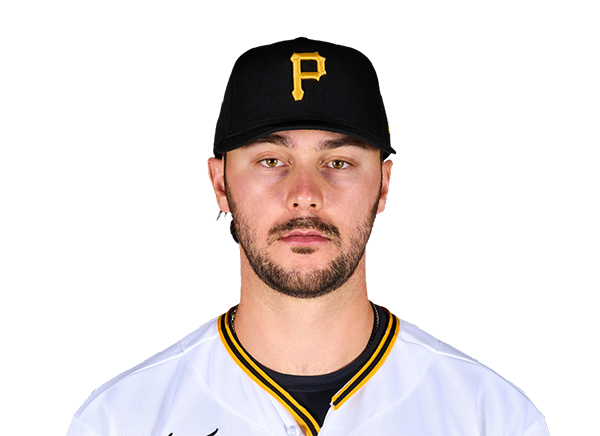 Paul Skenes | 8.0 | 2 | 0 | 0 | 0 | 7 | 0 | 97-65 | 2.36 | 97 |
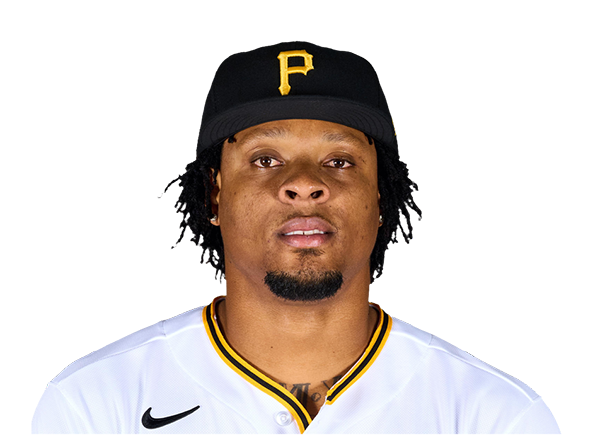 Gregory Soto | 1.0 | 0 | 0 | 0 | 1 | 1 | 0 | 15-8 | 1.50 | 15 |
Arizona Diamondbacks
| Player | IP | H | R | ER | BB | K | HR | PC-ST | ERA | PC |
|---|---|---|---|---|---|---|---|---|---|---|
 Michael Soroka | 6.1 | 7 | 1 | 1 | 2 | 6 | 1 | 93-65 | 4.14 | 93 |
 Kevin Ginkel | 0.2 | 0 | 0 | 0 | 0 | 0 | 0 | 9-6 | 3.45 | 9 |
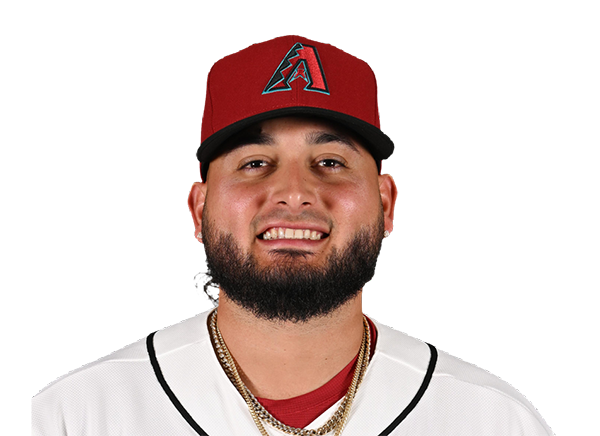 Juan Morillo | 1.0 | 0 | 0 | 0 | 0 | 0 | 0 | 12-6 | 2.16 | 12 |
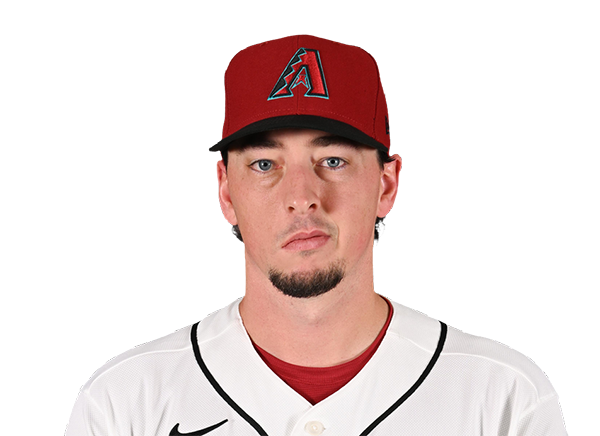 Taylor Clarke | 1.0 | 0 | 0 | 0 | 0 | 1 | 0 | 15-9 | 2.60 | 15 |
H2H / Season Series
PIT0–3
ARI
PIT7–8
ARI
PIT3–2
ARI
ARI2–4
PIT
ARI0–1
PIT
ARI9–0
PIT
Last 5 Games
| Date | Opponent | Result |
|---|---|---|
| Aug 22 |  @ LAD | L3–4 |
| Aug 21 | @ LAD | L4–5 |
| Aug 19 |  vs DET | W4–3 |
| Aug 18 | vs DET | W4–1 |
| Aug 17 | vs DET | L5–8 |
| Date | Opponent | Result |
|---|---|---|
| Aug 22 |  vs CIN | L5–11 |
| Aug 21 | vs CIN | W9–0 |
| Aug 19 |  @ BOS | W7–6 |
| Aug 18 | @ BOS | L4–9 |
| Aug 17 | @ BOS | L1–11 |
Standings
American League
| Team | W | L | PCT | GB | DIFF | STRK |
|---|---|---|---|---|---|---|
1 Rays | 76 | 53 | .589 | - | +42 | L3 |
2 White Sox | 67 | 62 | .519 | 9 | +42 | L1 |
3 Astros | 65 | 65 | .500 | 11.5 | -43 | L1 |
4 Yankees | 73 | 56 | .566 | 3 | +95 | L1 |
| 5Red Sox | 70 | 59 | .543 | 6 | +98 | W2 |
6 Rangers | 64 | 66 | .492 | 12.5 | -48 | L1 |
7 Guardians | 64 | 66 | .492 | 12.5 | -14 | W3 |
8 Blue Jays | 64 | 67 | .489 | 13 | -50 | W1 |
9 Twins | 63 | 67 | .485 | 13.5 | -47 | L2 |
10 Orioles | 63 | 67 | .485 | 13.5 | -33 | W2 |
11 Mariners | 62 | 68 | .477 | 14.5 | -44 | W2 |
| 12Tigers | 61 | 68 | .473 | 15 | +77 | L4 |
13 Royals | 57 | 74 | .435 | 20 | -95 | W7 |
14 Angels | 52 | 78 | .400 | 24.5 | -68 | W1 |
15 Athletics | 50 | 80 | .385 | 26.5 | -188 | W1 |
National League
| Team | W | L | PCT | GB | DIFF | STRK |
|---|---|---|---|---|---|---|
1 Brewers | 81 | 49 | .623 | - | +163 | W3 |
| 2Dodgers | 79 | 51 | .608 | 2 | +147 | W5 |
3 Braves | 75 | 55 | .577 | 6 | +108 | L2 |
4 Cubs | 74 | 56 | .569 | 7 | +98 | L3 |
5 Phillies | 72 | 58 | .554 | 9 | +25 | W8 |
6 Padres | 70 | 60 | .538 | 11 | +9 | W2 |
| 7Diamondbacks | 68 | 62 | .523 | 13 | +7 | L1 |
8 Marlins | 66 | 64 | .508 | 15 | +17 | W2 |
9 Cardinals | 66 | 65 | .504 | 15.5 | 0 | L2 |
| 10Pirates | 63 | 68 | .481 | 18.5 | +29 | L2 |
| 11Reds | 62 | 68 | .477 | 19 | -92 | W1 |
12 Nationals | 61 | 70 | .466 | 20.5 | +14 | L3 |
13 Mets | 59 | 71 | .454 | 22 | -39 | W1 |
14 Giants | 52 | 77 | .403 | 28.5 | -79 | L3 |
15 Rockies | 50 | 79 | .388 | 30.5 | -131 | L5 |
PIT
VS
ARI
Pitchers
Paul Skenes
Gregory Soto
Catchers
Henry Davis
Infielders
Brandon Lowe
Ryan O'Hearn
Nick Gonzales
Jared Triolo
Spencer Horwitz
Konnor Griffin
Outfielders
Oneil Cruz
Bryan Reynolds
Billy Cook
Designated Hitters
Marcell Ozuna
Pitchers
Michael Soroka
Kevin Ginkel
Juan Morillo
Taylor Clarke
Catchers
Gabriel Moreno
Infielders
Geraldo Perdomo
Ketel Marte
Ildemaro Vargas
Nolan Arenado
Outfielders
Corbin Carroll
Lourdes Gurriel Jr.
Alek Thomas
Designated Hitters
Adrian Del Castillo
Other Players
Jose Fernandez
Pirates
VS
Diamondbacks
Batting
131
Team Games Played
130
4514
At Bats
4369
1150
Hits
1069
623
Runs Batted In
565
156
Home Runs
129
108
Stolen Bases
89
.255
Batting Average
.245
653
Runs
593
202
Doubles
226
14
Triples
33
1848
Total Bases
1748
464
Walks
439
1237
Strikeouts
944
.331
On Base Percentage
.318
.409
Slugging Percentage
.400
.741
OBP Pct + SLG Pct
.718
131
Games Played
130
131
Games Started
130
69
Hit By Pitch
47
0.0
Wins Above Replacement
0.0
0.0
Offensive Wins Above Replacement
0.0
20
Caught Stealing
20
1
Is Qualified
1
625.4
Runs Created
573.6
4.8
Runs Created Per 27 Outs
4.5
.091
Walks Per Plate Appearance
.089
0.38
Walk To Strikeout Ratio
0.47
.155
Isolated Power
.155
.277
Secondary Average
.272
3.91
Pitches Per Plate Appearance
3.94
372
Extra Base Hits
388
5088
Plate Appearances
4930
28.9
At Bats Per Home Run
33.9
8
Sacrifice Hit
32
30
Sacrifice Flies
40
Pitching
131
Team Games Played
130
39
Quality Starts
47
63
Wins
68
68
Losses
62
25
Saves
31
51
Holds
71
1064
Hits
1111
557
Earned runs
538
134
Home Runs
153
483
Walks
381
1220
Strikeouts
881
9.4
Strikeouts Per 9 Innings
6.9
150.9
Pitches Per Start
140.9
1.32
Walks Plus Hits Per Inning Pitched
1.29
4.29
Earned Run Average
4.20
68
Losses
62
1168.1
Innings pitched
1154.0
.481
Win Percentage
.523
45
Save Opportunities
46
.240
Opponent Batting Average
.253
.322
Opponent's On-base pct.
.317
.390
Opponent's Slugging pct.
.419
.712
Opponent's OPB Pct + SLG Pct
.736
4437
At Bats
4399
238
Doubles
220
13
Triples
26
71
Batters Hit
50
80
Stolen Bases
76
131
Games Played
130
1
Complete Games
1
7
Shutouts
8
44
Wild Pitches
26
586
Runs Batted In
571
4
Balks
5
1168.1
Innings pitched
1154.0
9.4
Strikeouts Per 9 Innings
6.9
27
Caught Stealing
17
131
Games Started
130
0.0
Wins Above Replacement
0.0
1
Is Qualified
1
624
Runs
586
557
Earned Runs
538
1730
Total Bases
1842
Fielding
131
Team Games Played
130
1168
Full Innings
1154
4613
Total Chances
4641
3505
Putouts
3462
1025
Assists
1131
83
Errors
48
202
Double Plays
226
0.982
Fielding Percentage
0.990
34.9
Range Factor
35.8
0.0
Zone Rating
0.0
131
Games Played
130
0
Games Started
0
0.0
Defensive Wins Above Replacement
0.0
1
Qualified
1