

Pirates vs Marlins Live Score (11 Aug, 2026)
Game Information
Stage
Standard
Season
2026
First Pitch
Tue, Aug 11, 6:40 pm
Venue
loanDepot park
Location
Miami, Florida
Attendance
9,366
Home Runs
Brandon Lowe
25 HR
.253 AVG
74 RBI

Heriberto Hernandez
16 HR
.227 AVG
44 RBI
Batting Average
Nick Gonzales
.306 AVG
.359 OBP
.399 SLG
Otto Lopez
.318 AVG
.351 OBP
.470 SLG

Runs Batted In
Brandon Lowe
74 RBI
25 HR
.253 AVG
Otto Lopez
53 RBI
9 HR
.318 AVG
Earned Run Average
Paul Skenes
3.96 ERA
9 W
162 K

Sandy Alcantara
3.52 ERA
13 W
128 K
Wins
Braxton Ashcraft
11 W
4.08 ERA
145 K

Sandy Alcantara
13 W
3.52 ERA
128 K
Strikeouts
Paul Skenes
162 K
9 W
3.96 ERA
Sandy Alcantara
128 K
13 W
3.52 ERA
Injury Report

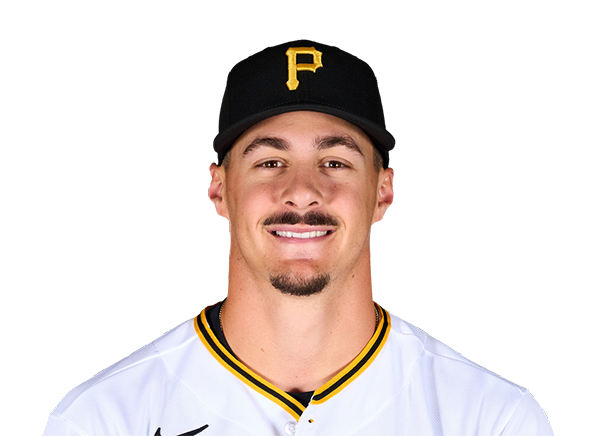






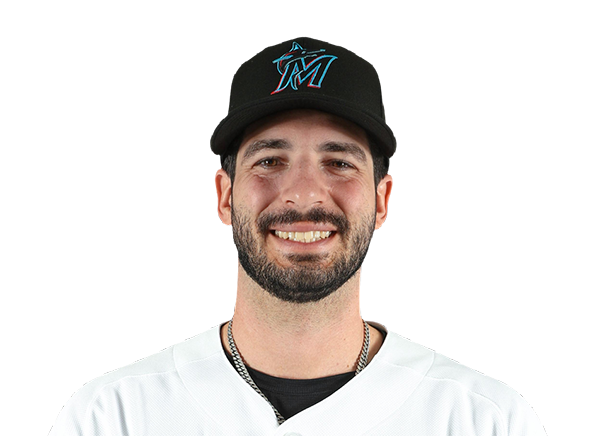
Team Stats
 PIT
MIA


Array
Runs
Array
4
Hits
5
2
Errors
0
—
Home Runs
—
—
Walks
—
—
Strikeouts
—
Standings
American League
| Team | W | L | PCT | GB | DIFF | STRK |
|---|---|---|---|---|---|---|
1 Rays | 76 | 53 | .589 | - | +42 | L3 |
2 White Sox | 67 | 62 | .519 | 9 | +42 | L1 |
3 Astros | 65 | 65 | .500 | 11.5 | -43 | L1 |
4 Yankees | 73 | 56 | .566 | 3 | +95 | L1 |
5 Red Sox | 70 | 59 | .543 | 6 | +98 | W2 |
6 Rangers | 64 | 66 | .492 | 12.5 | -48 | L1 |
7 Blue Jays | 64 | 67 | .489 | 13 | -50 | W1 |
8 Twins | 63 | 66 | .488 | 13 | -45 | L1 |
9 Guardians | 63 | 66 | .488 | 13 | -15 | W2 |
10 Orioles | 63 | 67 | .485 | 13.5 | -33 | W2 |
11 Mariners | 62 | 68 | .477 | 14.5 | -44 | W2 |
12 Tigers | 61 | 68 | .473 | 15 | +77 | L4 |
13 Royals | 57 | 74 | .435 | 20 | -95 | W7 |
14 Angels | 52 | 78 | .400 | 24.5 | -68 | W1 |
15 Athletics | 50 | 80 | .385 | 26.5 | -188 | W1 |
National League
| Team | W | L | PCT | GB | DIFF | STRK |
|---|---|---|---|---|---|---|
1 Brewers | 81 | 49 | .623 | - | +163 | W3 |
2 Dodgers | 79 | 51 | .608 | 2 | +147 | W5 |
3 Braves | 75 | 55 | .577 | 6 | +108 | L2 |
4 Cubs | 74 | 56 | .569 | 7 | +98 | L3 |
5 Phillies | 72 | 58 | .554 | 9 | +25 | W8 |
6 Padres | 69 | 60 | .535 | 11.5 | +7 | W1 |
7 Diamondbacks | 68 | 61 | .527 | 12.5 | +13 | W2 |
| 8Marlins | 66 | 64 | .508 | 15 | +17 | W2 |
9 Cardinals | 66 | 65 | .504 | 15.5 | 0 | L2 |
| 10Pirates | 63 | 68 | .481 | 18.5 | +29 | L2 |
11 Reds | 61 | 68 | .473 | 19.5 | -98 | L2 |
12 Nationals | 61 | 70 | .466 | 20.5 | +14 | L3 |
13 Mets | 59 | 71 | .454 | 22 | -39 | W1 |
14 Giants | 52 | 77 | .403 | 28.5 | -79 | L3 |
15 Rockies | 50 | 78 | .391 | 30 | -130 | L4 |
PIT
VS
MIA
Pitchers
Paul Skenes
Catchers

Henry Davis
Infielders
Brandon Lowe

Spencer Horwitz
Nick Gonzales
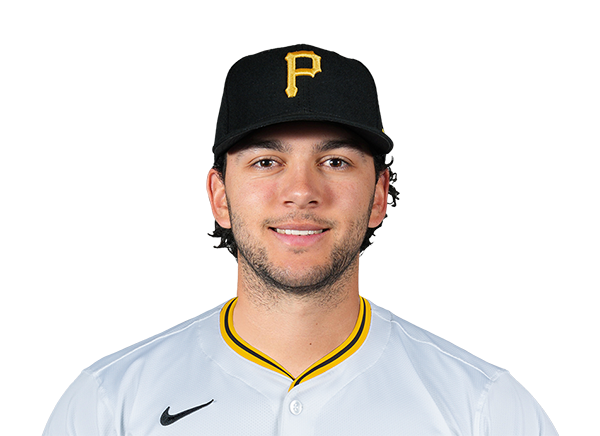
Jacob Gonzalez
Outfielders

Jake Mangum

Bryan Reynolds
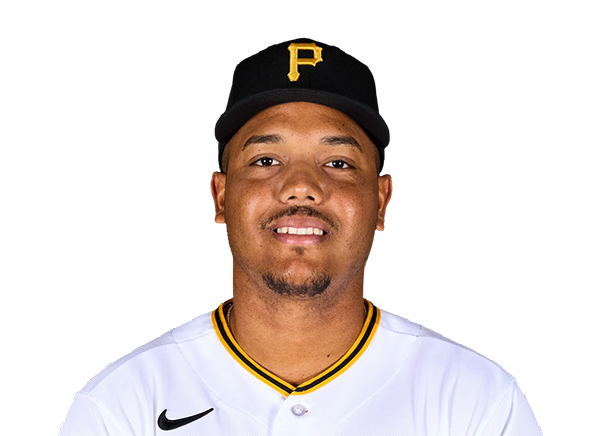
Esmerlyn Valdez
Designated Hitters

Ronny Simon
Pitchers
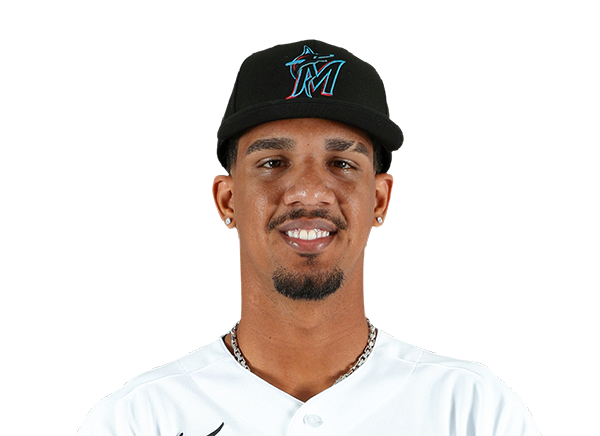
Eury Perez
Catchers

Joe Mack
Infielders
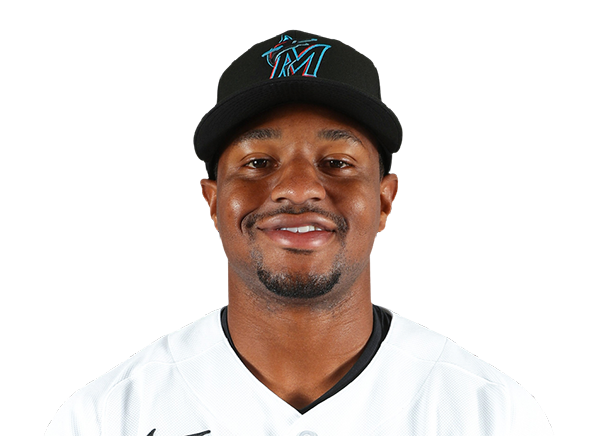
Xavier Edwards
Otto Lopez

Griffin Conine
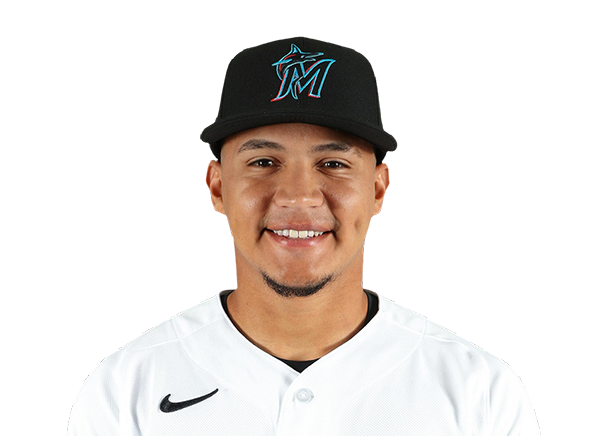
Javier Sanoja
Outfielders
Heriberto Hernandez
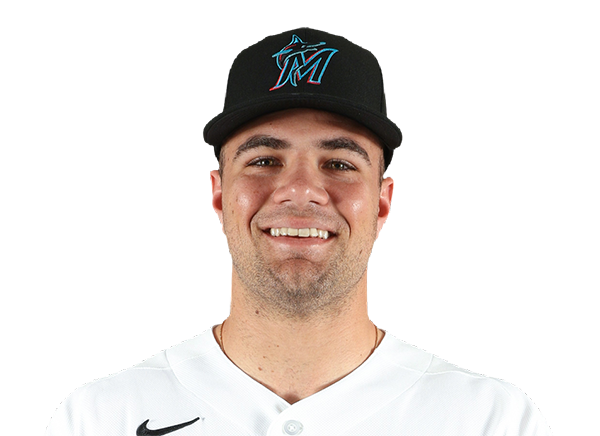
Jakob Marsee

Esteury Ruiz
Designated Hitters
Owen Caissie
Pirates
VS
Marlins
Batting
121
Team Games Played
120
4179
At Bats
3986
1068
Hits
998
576
Runs Batted In
504
145
Home Runs
121
103
Stolen Bases
125
.256
Batting Average
.250
602
Runs
526
187
Doubles
195
12
Triples
27
1714
Total Bases
1610
438
Walks
401
1145
Strikeouts
975
.333
On Base Percentage
.326
.410
Slugging Percentage
.404
.743
OBP Pct + SLG Pct
.730
121
Games Played
120
121
Games Started
120
63
Hit By Pitch
63
0.0
Wins Above Replacement
0.0
0.0
Offensive Wins Above Replacement
0.0
20
Caught Stealing
39
1
Is Qualified
1
584.3
Runs Created
543.7
4.8
Runs Created Per 27 Outs
4.7
.093
Walks Per Plate Appearance
.089
0.38
Walk To Strikeout Ratio
0.41
.155
Isolated Power
.154
.279
Secondary Average
.276
3.91
Pitches Per Plate Appearance
3.81
344
Extra Base Hits
343
4717
Plate Appearances
4506
28.8
At Bats Per Home Run
32.9
6
Sacrifice Hit
18
28
Sacrifice Flies
37
Pitching
121
Team Games Played
120
37
Quality Starts
41
58
Wins
61
63
Losses
59
23
Saves
29
51
Holds
67
991
Hits
909
518
Earned runs
460
126
Home Runs
120
439
Walks
399
1122
Strikeouts
1007
9.4
Strikeouts Per 9 Innings
8.6
151.1
Pitches Per Start
143.2
1.32
Walks Plus Hits Per Inning Pitched
1.24
4.32
Earned Run Average
3.93
63
Losses
59
1079.2
Innings pitched
1053.0
.479
Win Percentage
.508
43
Save Opportunities
44
.241
Opponent Batting Average
.230
.322
Opponent's On-base pct.
.309
.394
Opponent's Slugging pct.
.374
.716
Opponent's OPB Pct + SLG Pct
.683
4110
At Bats
3949
223
Doubles
173
13
Triples
18
67
Batters Hit
61
78
Stolen Bases
104
121
Games Played
120
0
Complete Games
1
7
Shutouts
12
43
Wild Pitches
35
546
Runs Batted In
482
4
Balks
3
1079.2
Innings pitched
1053.0
9.4
Strikeouts Per 9 Innings
8.6
25
Caught Stealing
29
121
Games Started
120
0.0
Wins Above Replacement
0.0
1
Is Qualified
1
583
Runs
509
518
Earned Runs
460
1618
Total Bases
1478
Fielding
121
Team Games Played
120
1080
Full Innings
1053
4254
Total Chances
4222
3239
Putouts
3159
942
Assists
984
73
Errors
79
187
Double Plays
195
0.983
Fielding Percentage
0.981
34.9
Range Factor
35.4
0.0
Zone Rating
0.0
121
Games Played
120
0
Games Started
0
0.0
Defensive Wins Above Replacement
0.0
1
Qualified
1