

Rangers vs Blue Jays Live Score (25 Jun, 2026)
Game Information
Stage
Standard
Season
2026
First Pitch
Thu, Jun 25, 7:07 pm
Venue
Rogers Centre
Location
Toronto, Ontario
Attendance
35,273
Live Situation
2Balls
3Strikes
0Outs
—Pitcher
—At Bat
Pitch Sequence
1
STRIKE FOUL
Four-seam FB
95 MPH
2
STRIKE SWINGING
Curve
80 MPH
3
BALL
Four-seam FB
96 MPH
4
BALL
Four-seam FB
95 MPH
5
STRIKE LOOKING
Four-seam FB
94 MPH
Injury Report




Team Stats
 TEX
TOR


6
Runs
5
10
Hits
6
0
Errors
0
3
Home Runs
1
6
Walks
1
5
Strikeouts
8
Player Box Score
Texas Rangers
| Player | H-AB | AB | R | H | RBI | HR | BB | K | #P | AVG | OBP | SLG |
|---|---|---|---|---|---|---|---|---|---|---|---|---|
 Joc Pederson | 2-3 | 3 | 2 | 2 | 1 | 1 | 2 | 0 | 27 | .248 | .349 | .467 |
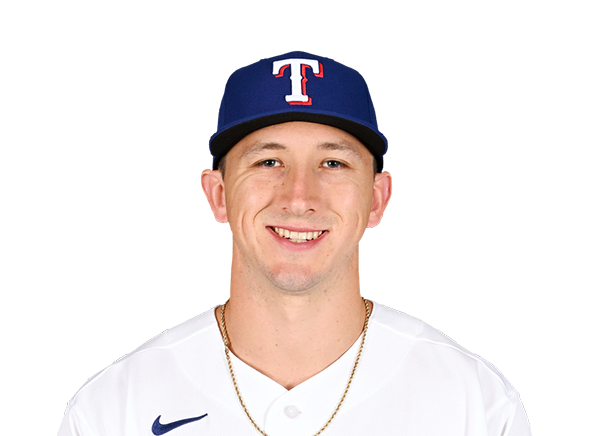 Wyatt Langford | 1-5 | 5 | 1 | 1 | 3 | 1 | 0 | 1 | 15 | .268 | .315 | .490 |
 Corey Seager | 0-3 | 3 | 1 | 0 | 0 | 0 | 2 | 0 | 14 | .183 | .287 | .367 |
 Brandon Nimmo | 0-3 | 3 | 0 | 0 | 0 | 0 | 1 | 1 | 13 | .265 | .332 | .425 |
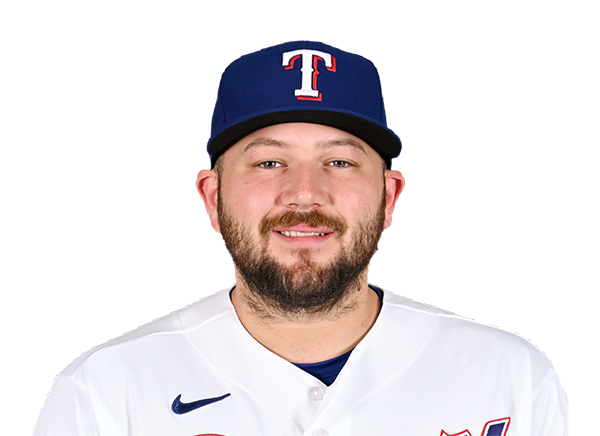 Jake Burger | 2-4 | 4 | 1 | 2 | 2 | 1 | 0 | 1 | 16 | .255 | .315 | .451 |
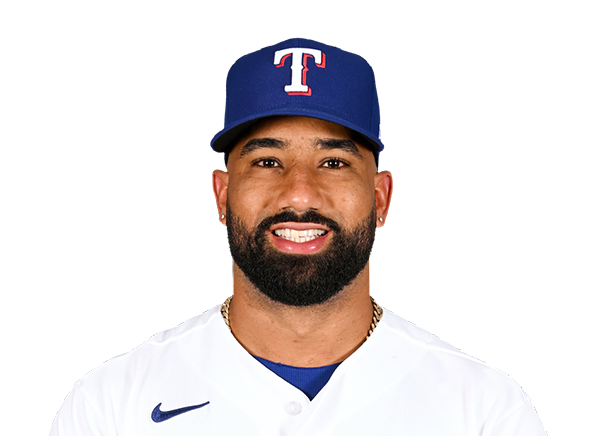 Ezequiel Duran | 0-4 | 4 | 0 | 0 | 0 | 0 | 0 | 2 | 13 | .261 | .318 | .415 |
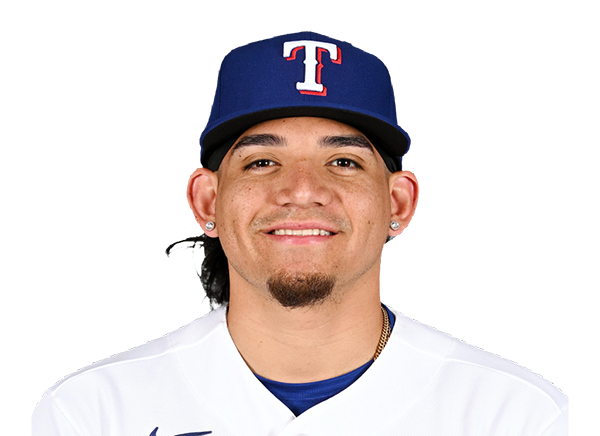 Alejandro Osuna | 1-4 | 4 | 0 | 1 | 0 | 0 | 0 | 0 | 18 | .260 | .364 | .293 |
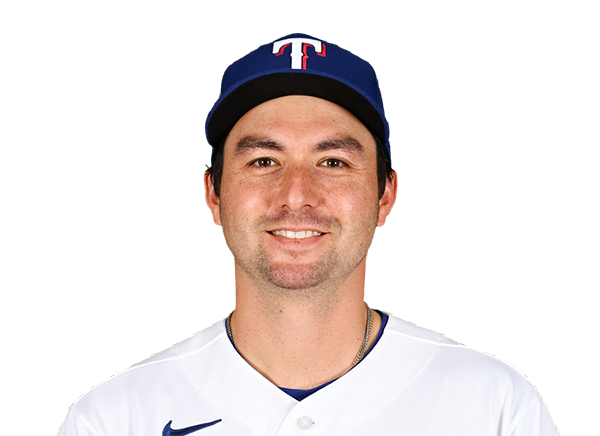 Kyle Higashioka | 2-3 | 3 | 0 | 2 | 0 | 0 | 1 | 0 | 16 | .233 | .311 | .368 |
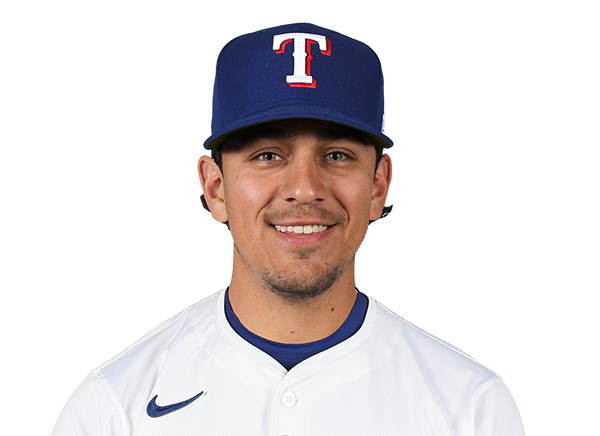 Nicky Lopez | 2-4 | 4 | 1 | 2 | 0 | 0 | 0 | 0 | 10 | .333 | .370 | .391 |
Toronto Blue Jays
| Player | H-AB | AB | R | H | RBI | HR | BB | K | #P | AVG | OBP | SLG |
|---|---|---|---|---|---|---|---|---|---|---|---|---|
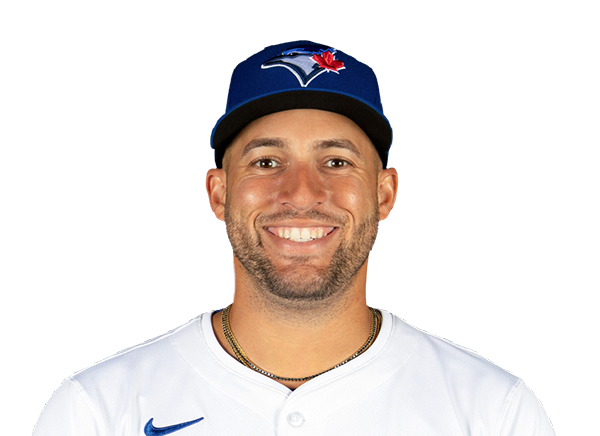 George Springer | 0-4 | 4 | 0 | 0 | 0 | 0 | 0 | 1 | 19 | .219 | .309 | .373 |
 Ernie Clement | 2-4 | 4 | 1 | 2 | 0 | 0 | 0 | 0 | 11 | .294 | .315 | .438 |
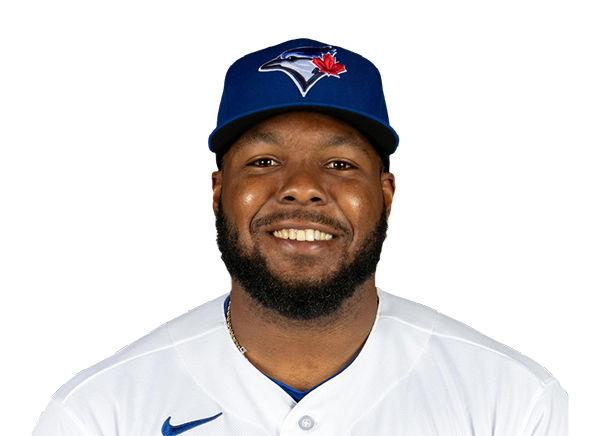 Vladimir Guerrero Jr. | 0-4 | 4 | 0 | 0 | 0 | 0 | 0 | 2 | 21 | .273 | .356 | .358 |
 Kazuma Okamoto | 2-4 | 4 | 2 | 2 | 2 | 1 | 0 | 0 | 20 | .241 | .324 | .469 |
 Alejandro Kirk | 1-4 | 4 | 1 | 1 | 0 | 0 | 0 | 0 | 10 | .196 | .250 | .294 |
 Nathan Lukes | 0-2 | 2 | 1 | 0 | 0 | 0 | 1 | 1 | 14 | .297 | .344 | .414 |
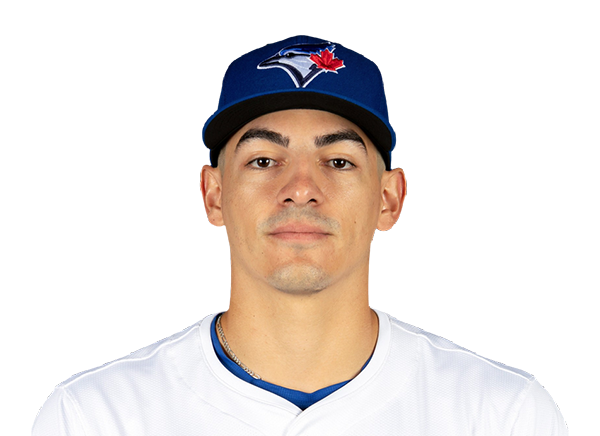 Brandon Valenzuela | 0-1 | 1 | 0 | 0 | 0 | 0 | 0 | 1 | 5 | .250 | .331 | .438 |
 Davis Schneider | 0-2 | 2 | 0 | 0 | 1 | 0 | 0 | 2 | 15 | .155 | .284 | .299 |
 Myles Straw | 1-2 | 2 | 0 | 1 | 2 | 0 | 0 | 0 | 7 | .246 | .312 | .341 |
 Andres Gimenez | 0-1 | 1 | 0 | 0 | 0 | 0 | 0 | 0 | 7 | .231 | .274 | .371 |
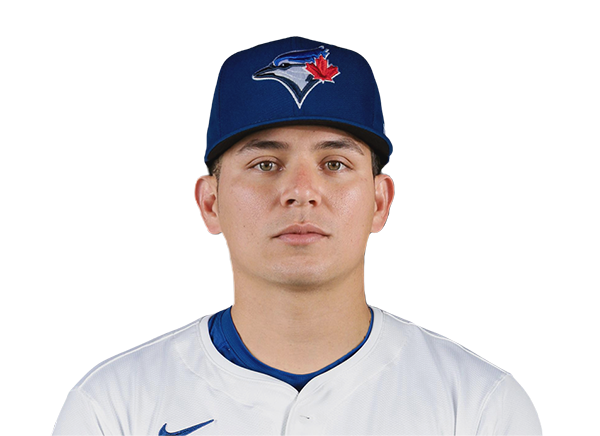 Luis Urias | 0-2 | 2 | 0 | 0 | 0 | 0 | 0 | 0 | 6 | .333 | .400 | .667 |
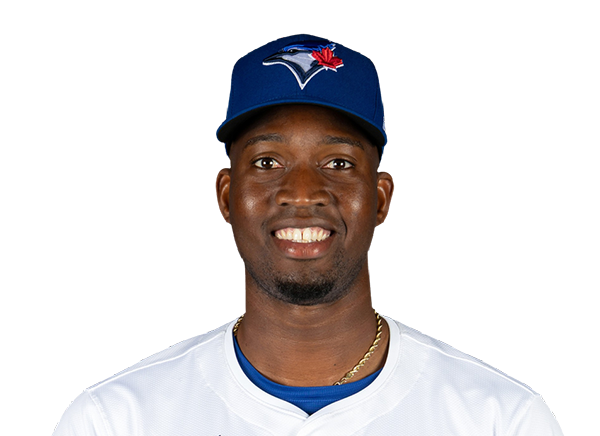 Jesus Sanchez | 0-1 | 1 | 0 | 0 | 0 | 0 | 0 | 1 | 6 | .277 | .319 | .441 |
Texas Rangers
| Player | IP | H | R | ER | BB | K | HR | PC-ST | ERA | PC |
|---|---|---|---|---|---|---|---|---|---|---|
 MacKenzie Gore | 7.0 | 4 | 3 | 3 | 1 | 5 | 0 | 98-66 | 4.05 | 98 |
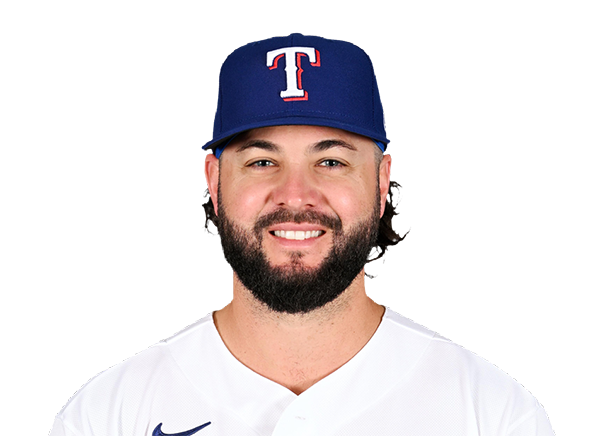 Jakob Junis | 1.0 | 0 | 0 | 0 | 0 | 1 | 0 | 18-10 | 2.14 | 18 |
 Jacob Latz | 1.0 | 2 | 2 | 2 | 0 | 2 | 1 | 25-18 | 1.89 | 25 |
Toronto Blue Jays
| Player | IP | H | R | ER | BB | K | HR | PC-ST | ERA | PC |
|---|---|---|---|---|---|---|---|---|---|---|
 Kevin Gausman | 6.0 | 10 | 6 | 6 | 2 | 4 | 3 | 99-67 | 4.36 | 99 |
 Simeon Woods Richardson | 3.0 | 0 | 0 | 0 | 4 | 1 | 0 | 43-20 | 6.40 | 43 |
H2H / Season Series
TOR2–3
TEX
TOR4–7
TEX
TOR4–5
TEX
TOR5–6
TEX
Last 5 Games
| Date | Opponent | Result |
|---|---|---|
| Aug 22 |  vs LAA | L0–3 |
| Aug 21 | vs LAA | W2–1 |
| Aug 20 |  vs WSH | W2–0 |
| Aug 19 | vs WSH | L0–6 |
| Aug 18 | vs WSH | W5–0 |
| Date | Opponent | Result |
|---|---|---|
| Aug 22 |  @ NYY | W4–3 |
| Aug 21 | @ NYY | L1–3 |
| Aug 20 |  @ TB | W5–1 |
| Aug 19 | @ TB | L6–7 |
| Aug 18 | @ TB | W10–5 |
Standings
American League
| Team | W | L | PCT | GB | DIFF | STRK |
|---|---|---|---|---|---|---|
| 1Rays | 76 | 53 | .589 | - | +42 | L3 |
2 White Sox | 67 | 62 | .519 | 9 | +42 | L1 |
3 Astros | 65 | 65 | .500 | 11.5 | -43 | L1 |
| 4Yankees | 73 | 56 | .566 | 3 | +95 | L1 |
5 Red Sox | 70 | 59 | .543 | 6 | +98 | W2 |
| 6Rangers | 64 | 66 | .492 | 12.5 | -48 | L1 |
7 Guardians | 64 | 66 | .492 | 12.5 | -14 | W3 |
| 8Blue Jays | 64 | 67 | .489 | 13 | -50 | W1 |
9 Twins | 63 | 67 | .485 | 13.5 | -47 | L2 |
10 Orioles | 63 | 67 | .485 | 13.5 | -33 | W2 |
11 Mariners | 62 | 68 | .477 | 14.5 | -44 | W2 |
12 Tigers | 61 | 68 | .473 | 15 | +77 | L4 |
13 Royals | 57 | 74 | .435 | 20 | -95 | W7 |
| 14Angels | 52 | 78 | .400 | 24.5 | -68 | W1 |
15 Athletics | 50 | 80 | .385 | 26.5 | -188 | W1 |
National League
| Team | W | L | PCT | GB | DIFF | STRK |
|---|---|---|---|---|---|---|
1 Brewers | 81 | 49 | .623 | - | +163 | W3 |
2 Dodgers | 79 | 51 | .608 | 2 | +147 | W5 |
3 Braves | 75 | 55 | .577 | 6 | +108 | L2 |
4 Cubs | 74 | 56 | .569 | 7 | +98 | L3 |
5 Phillies | 72 | 58 | .554 | 9 | +25 | W8 |
6 Padres | 70 | 60 | .538 | 11 | +9 | W2 |
7 Diamondbacks | 68 | 62 | .523 | 13 | +7 | L1 |
8 Marlins | 66 | 64 | .508 | 15 | +17 | W2 |
9 Cardinals | 66 | 65 | .504 | 15.5 | 0 | L2 |
10 Pirates | 63 | 68 | .481 | 18.5 | +29 | L2 |
11 Reds | 62 | 68 | .477 | 19 | -92 | W1 |
| 12Nationals | 61 | 70 | .466 | 20.5 | +14 | L3 |
13 Mets | 59 | 71 | .454 | 22 | -39 | W1 |
14 Giants | 52 | 77 | .403 | 28.5 | -79 | L3 |
15 Rockies | 50 | 79 | .388 | 30.5 | -131 | L5 |
TEX
VS
TOR
Pitchers
MacKenzie Gore
Jakob Junis
Jacob Latz
Catchers
Kyle Higashioka
Infielders
Corey Seager
Jake Burger
Ezequiel Duran
Nicky Lopez
Outfielders
Wyatt Langford
Brandon Nimmo
Alejandro Osuna
Designated Hitters
Joc Pederson
Pitchers
Kevin Gausman
Simeon Woods Richardson
Catchers
Alejandro Kirk
Infielders
Ernie Clement
Vladimir Guerrero Jr.
Kazuma Okamoto
Andres Gimenez
Luis Urias
Outfielders
Nathan Lukes
Davis Schneider
Myles Straw
Jesus Sanchez
Designated Hitters
George Springer
Other Players
Brandon Valenzuela
Rangers
VS
Blue Jays
Batting
130
Team Games Played
131
4315
At Bats
4423
1039
Hits
1087
497
Runs Batted In
495
141
Home Runs
124
62
Stolen Bases
65
.241
Batting Average
.246
516
Runs
518
184
Doubles
207
20
Triples
8
1686
Total Bases
1682
414
Walks
360
1109
Strikeouts
956
.314
On Base Percentage
.307
.391
Slugging Percentage
.380
.705
OBP Pct + SLG Pct
.687
130
Games Played
131
130
Games Started
131
57
Hit By Pitch
46
0.0
Wins Above Replacement
0.0
0.0
Offensive Wins Above Replacement
0.0
17
Caught Stealing
14
1
Is Qualified
1
533.3
Runs Created
518.7
4.2
Runs Created Per 27 Outs
4.0
.086
Walks Per Plate Appearance
.074
0.37
Walk To Strikeout Ratio
0.38
.150
Isolated Power
.135
.256
Secondary Average
.227
3.86
Pitches Per Plate Appearance
3.80
345
Extra Base Hits
339
4837
Plate Appearances
4892
30.6
At Bats Per Home Run
35.7
25
Sacrifice Hit
21
25
Sacrifice Flies
39
Pitching
130
Team Games Played
131
41
Quality Starts
40
64
Wins
64
66
Losses
67
36
Saves
44
65
Holds
85
1082
Hits
1040
532
Earned runs
512
155
Home Runs
134
386
Walks
479
1094
Strikeouts
1139
8.6
Strikeouts Per 9 Innings
8.8
144.4
Pitches Per Start
148.9
1.29
Walks Plus Hits Per Inning Pitched
1.30
4.20
Earned Run Average
3.95
66
Losses
67
1139.1
Innings pitched
1166.1
.492
Win Percentage
.489
52
Save Opportunities
59
.247
Opponent Batting Average
.238
.314
Opponent's On-base pct.
.315
.409
Opponent's Slugging pct.
.374
.723
Opponent's OPB Pct + SLG Pct
.690
4384
At Bats
4367
204
Doubles
174
21
Triples
9
52
Batters Hit
33
81
Stolen Bases
126
130
Games Played
131
0
Complete Games
1
12
Shutouts
8
41
Wild Pitches
41
546
Runs Batted In
540
1
Balks
5
1139.1
Innings pitched
1166.1
8.6
Strikeouts Per 9 Innings
8.8
23
Caught Stealing
39
130
Games Started
131
0.0
Wins Above Replacement
0.0
1
Is Qualified
1
564
Runs
568
532
Earned Runs
512
1793
Total Bases
1634
Fielding
130
Team Games Played
131
1139
Full Innings
1166
4469
Total Chances
4696
3418
Putouts
3499
998
Assists
1118
53
Errors
79
184
Double Plays
207
0.988
Fielding Percentage
0.983
34.9
Range Factor
35.6
0.0
Zone Rating
0.0
130
Games Played
131
0
Games Started
0
0.0
Defensive Wins Above Replacement
0.0
1
Qualified
1