

Rangers vs Orioles Live Score (31 Mar, 2026)
Game Information
Stage
Standard
Season
2026
First Pitch
Tue, Mar 31, 6:35 pm
Venue
Oriole Park at Camden Yards
Location
Baltimore, Maryland
Attendance
13,542
Live Situation
0Balls
1Strikes
0Outs
—Pitcher
—At Bat
Pitch Sequence
1
STRIKE LOOKING
Cutter
91 MPH
2
BALL IN PLAY
Splitter
89 MPH
Injury Report





Team Stats
 TEX
BAL


8
Runs
5
13
Hits
9
0
Errors
0
3
Home Runs
1
3
Walks
1
11
Strikeouts
11
Player Box Score
Texas Rangers
| Player | H-AB | AB | R | H | RBI | HR | BB | K | #P | AVG | OBP | SLG |
|---|---|---|---|---|---|---|---|---|---|---|---|---|
 Brandon Nimmo | 2-5 | 5 | 1 | 2 | 1 | 0 | 0 | 1 | 14 | .409 | .458 | .545 |
 Wyatt Langford | 2-5 | 5 | 1 | 2 | 1 | 0 | 0 | 1 | 19 | .167 | .167 | .250 |
 Corey Seager | 2-4 | 4 | 2 | 2 | 2 | 1 | 1 | 1 | 16 | .333 | .458 | .667 |
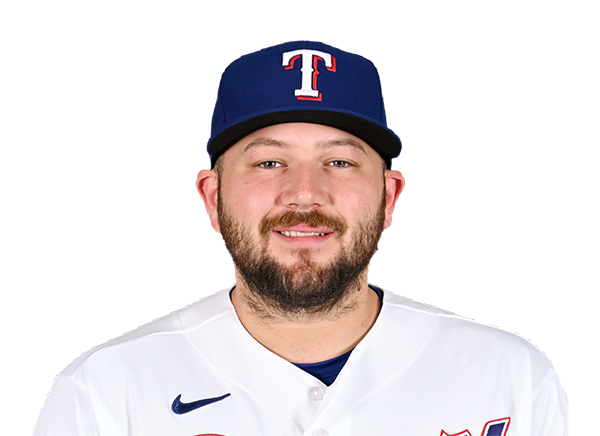 Jake Burger | 1-5 | 5 | 1 | 1 | 0 | 0 | 0 | 3 | 22 | .409 | .435 | .727 |
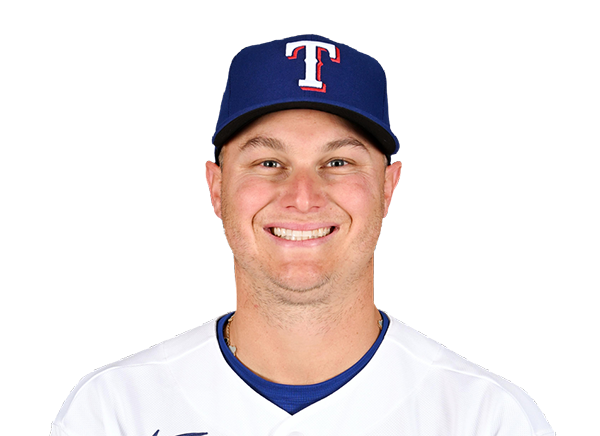 Joc Pederson | 0-4 | 4 | 0 | 0 | 0 | 0 | 1 | 2 | 26 | .000 | .182 | .000 |
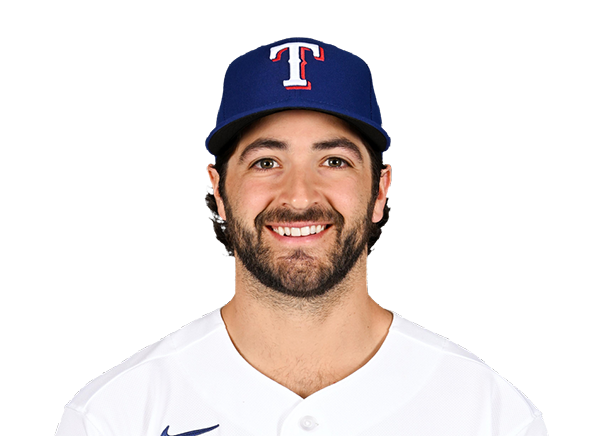 Josh Smith | 1-5 | 5 | 0 | 1 | 0 | 0 | 0 | 1 | 13 | .200 | .333 | .200 |
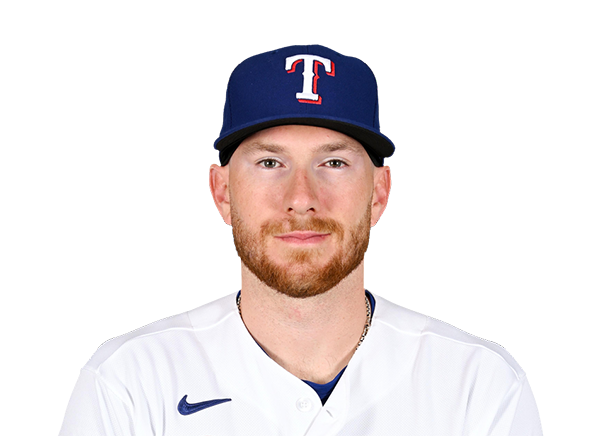 Danny Jansen | 3-5 | 5 | 1 | 3 | 3 | 1 | 0 | 1 | 18 | .308 | .308 | .615 |
 Evan Carter | 1-3 | 3 | 1 | 1 | 0 | 0 | 1 | 0 | 12 | .286 | .412 | .429 |
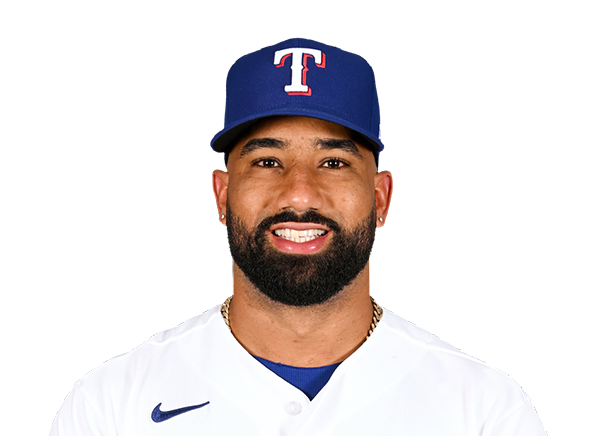 Ezequiel Duran | 1-4 | 4 | 1 | 1 | 1 | 1 | 0 | 1 | 11 | .222 | .222 | .667 |
Baltimore Orioles
| Player | H-AB | AB | R | H | RBI | HR | BB | K | #P | AVG | OBP | SLG |
|---|---|---|---|---|---|---|---|---|---|---|---|---|
 Taylor Ward | 4-5 | 5 | 1 | 4 | 2 | 0 | 0 | 1 | 25 | .300 | .391 | .350 |
 Gunnar Henderson | 1-5 | 5 | 0 | 1 | 2 | 0 | 0 | 1 | 17 | .190 | .261 | .381 |
 Pete Alonso | 2-4 | 4 | 1 | 2 | 1 | 1 | 0 | 1 | 13 | .316 | .381 | .474 |
 Adley Rutschman | 0-3 | 3 | 0 | 0 | 0 | 0 | 1 | 0 | 21 | .286 | .412 | .500 |
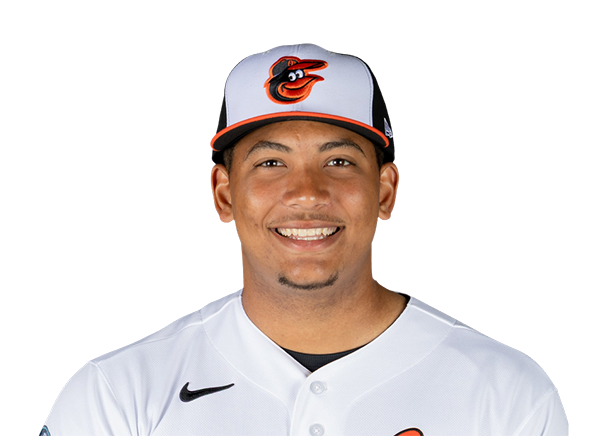 Samuel Basallo | 0-4 | 4 | 0 | 0 | 0 | 0 | 0 | 1 | 17 | .143 | .250 | .143 |
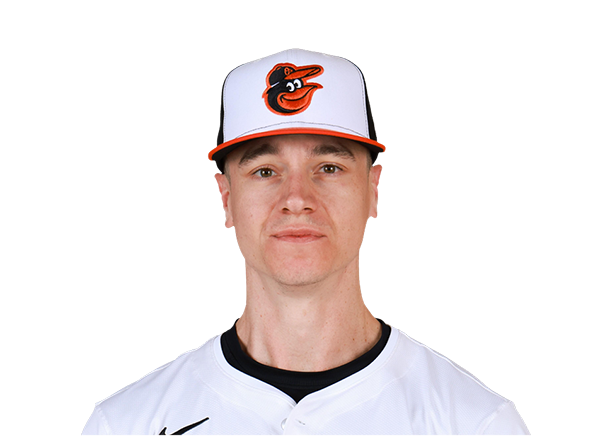 Tyler O'Neill | 0-3 | 3 | 1 | 0 | 0 | 0 | 0 | 2 | 10 | .143 | .294 | .357 |
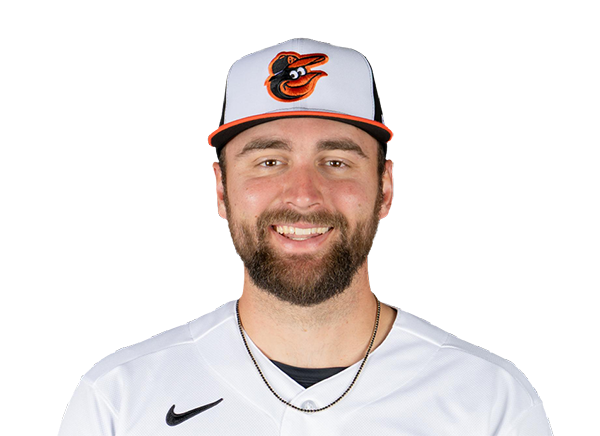 Colton Cowser | 1-4 | 4 | 1 | 1 | 0 | 0 | 0 | 0 | 15 | .300 | .333 | .400 |
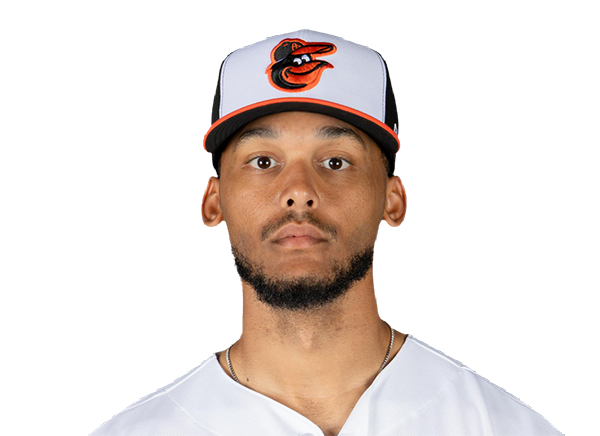 Jeremiah Jackson | 0-4 | 4 | 0 | 0 | 0 | 0 | 0 | 2 | 11 | .250 | .250 | .250 |
 Blaze Alexander | 1-4 | 4 | 1 | 1 | 0 | 0 | 0 | 3 | 13 | .364 | .364 | .364 |
Texas Rangers
| Player | IP | H | R | ER | BB | K | HR | PC-ST | ERA | PC |
|---|---|---|---|---|---|---|---|---|---|---|
 Jacob deGrom | 4.2 | 6 | 3 | 3 | 0 | 7 | 1 | 79-56 | 5.79 | 79 |
 Cole Winn | 1.1 | 0 | 0 | 0 | 1 | 1 | 0 | 14-9 | 0.00 | 14 |
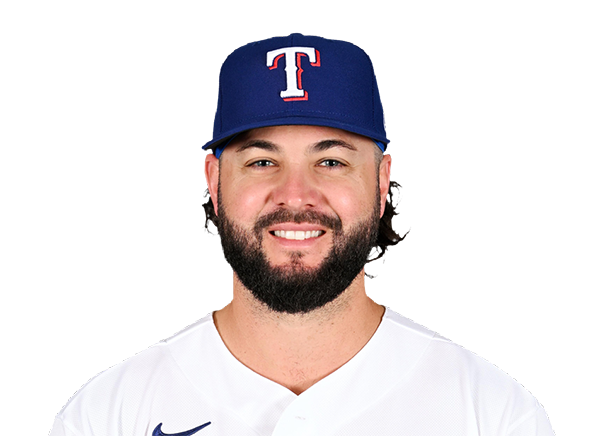 Jakob Junis | 1.0 | 1 | 0 | 0 | 0 | 1 | 0 | 15-12 | 0.00 | 15 |
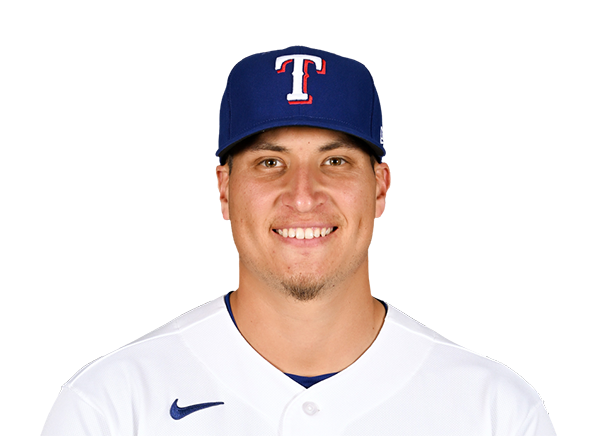 Robert Garcia | 1.0 | 0 | 0 | 0 | 0 | 1 | 0 | 15-11 | 0.00 | 15 |
 Chris Martin | 1.0 | 2 | 2 | 2 | 0 | 1 | 0 | 19-13 | 10.80 | 19 |
Baltimore Orioles
| Player | IP | H | R | ER | BB | K | HR | PC-ST | ERA | PC |
|---|---|---|---|---|---|---|---|---|---|---|
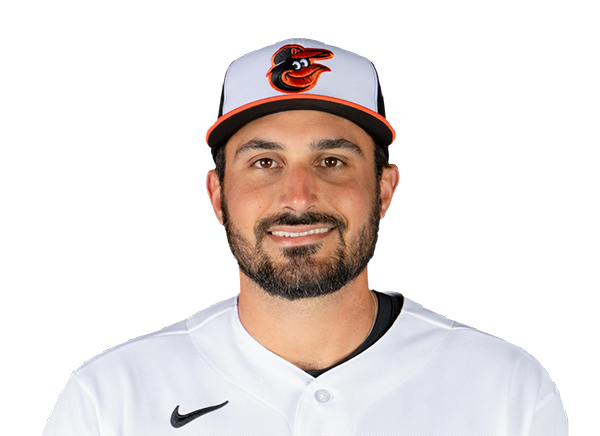 Zach Eflin | 3.2 | 4 | 1 | 1 | 2 | 7 | 1 | 74-44 | 2.45 | 74 |
 Grant Wolfram | 1.1 | 3 | 2 | 2 | 0 | 2 | 0 | 23-16 | 7.71 | 23 |
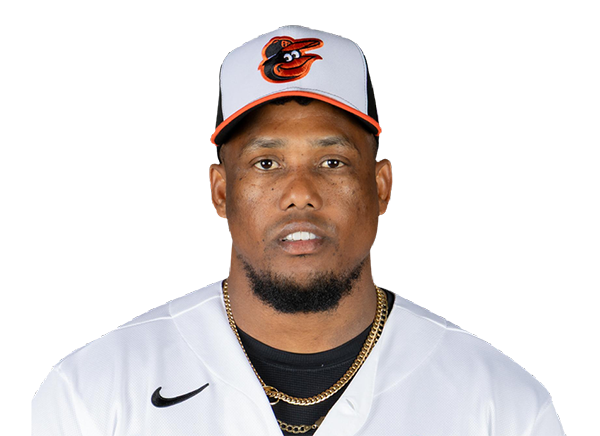 Yennier Cano | 1.0 | 2 | 1 | 1 | 0 | 0 | 0 | 9-6 | 5.40 | 9 |
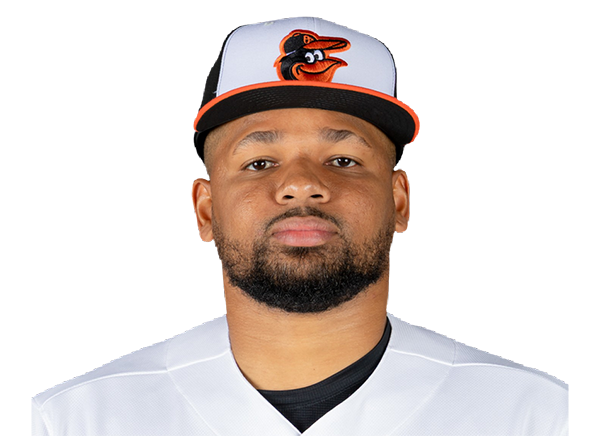 Yaramil Hiraldo | 1.0 | 2 | 3 | 3 | 1 | 0 | 1 | 24-12 | 21.60 | 24 |
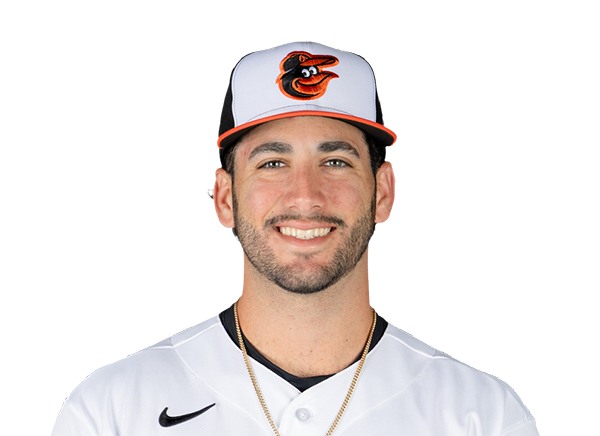 Anthony Nunez | 2.0 | 2 | 1 | 1 | 0 | 2 | 1 | 21-17 | 2.25 | 21 |
H2H / Season Series
TEX5–10
BAL
TEX5–1
BAL
TEX2–1
BAL
BAL8–3
TEX
BAL5–8
TEX
BAL2–5
TEX
Last 5 Games
| Date | Opponent | Result |
|---|---|---|
| Aug 22 |  vs LAA | L0–3 |
| Aug 21 | vs LAA | W2–1 |
| Aug 20 |  vs WSH | W2–0 |
| Aug 19 | vs WSH | L0–6 |
| Aug 18 | vs WSH | W5–0 |
| Date | Opponent | Result |
|---|---|---|
| Aug 22 |  vs TB | W3–2 |
| Aug 21 | vs TB | W5–3 |
| Aug 20 |  vs NYY | L1–6 |
| Aug 19 | vs NYY | L3–5 |
| Aug 18 | vs NYY | L1–3 |
Standings
American League
| Team | W | L | PCT | GB | DIFF | STRK |
|---|---|---|---|---|---|---|
| 1Rays | 76 | 52 | .594 | - | +43 | L2 |
2 White Sox | 67 | 61 | .523 | 9 | +47 | W1 |
3 Astros | 65 | 64 | .504 | 11.5 | -42 | W1 |
| 4Yankees | 73 | 56 | .566 | 3.5 | +95 | L1 |
5 Red Sox | 69 | 59 | .539 | 7 | +97 | W1 |
| 6Rangers | 64 | 65 | .496 | 12.5 | -45 | W2 |
7 Blue Jays | 64 | 67 | .489 | 13.5 | -50 | W1 |
8 Twins | 63 | 66 | .488 | 13.5 | -45 | L1 |
9 Guardians | 63 | 66 | .488 | 13.5 | -15 | W2 |
| 10Orioles | 62 | 67 | .481 | 14.5 | -34 | W1 |
11 Tigers | 61 | 67 | .477 | 15 | +79 | L3 |
12 Mariners | 61 | 68 | .473 | 15.5 | -45 | W1 |
13 Royals | 56 | 74 | .431 | 21 | -97 | W6 |
| 14Angels | 51 | 78 | .395 | 25.5 | -71 | L1 |
15 Athletics | 49 | 80 | .380 | 27.5 | -189 | L5 |
National League
| Team | W | L | PCT | GB | DIFF | STRK |
|---|---|---|---|---|---|---|
1 Brewers | 81 | 49 | .623 | - | +163 | W3 |
2 Dodgers | 78 | 51 | .605 | 2.5 | +146 | W4 |
3 Braves | 75 | 55 | .577 | 6 | +108 | L2 |
4 Cubs | 74 | 55 | .574 | 6.5 | +99 | L2 |
5 Phillies | 72 | 58 | .554 | 9 | +25 | W8 |
6 Padres | 69 | 60 | .535 | 11.5 | +7 | W1 |
7 Diamondbacks | 68 | 61 | .527 | 12.5 | +13 | W2 |
8 Marlins | 66 | 64 | .508 | 15 | +17 | W2 |
9 Cardinals | 66 | 65 | .504 | 15.5 | 0 | L2 |
10 Pirates | 63 | 67 | .485 | 18 | +30 | L1 |
11 Reds | 61 | 68 | .473 | 19.5 | -98 | L2 |
| 12Nationals | 61 | 70 | .466 | 20.5 | +14 | L3 |
13 Mets | 58 | 71 | .450 | 22.5 | -44 | L1 |
14 Giants | 52 | 76 | .406 | 28 | -78 | L2 |
15 Rockies | 50 | 78 | .391 | 30 | -130 | L4 |
TEX
VS
BAL
Pitchers
Jacob deGrom
Cole Winn
Jakob Junis
Robert Garcia
Chris Martin
Catchers
Danny Jansen
Infielders
Corey Seager
Jake Burger
Josh Smith
Ezequiel Duran
Outfielders
Brandon Nimmo
Wyatt Langford
Evan Carter
Designated Hitters
Joc Pederson
Pitchers
Zach Eflin
Grant Wolfram
Yennier Cano
Yaramil Hiraldo
Anthony Nunez
Catchers
Adley Rutschman
Infielders
Gunnar Henderson
Pete Alonso
Jeremiah Jackson
Blaze Alexander
Outfielders
Taylor Ward
Tyler O'Neill
Colton Cowser
Designated Hitters
Samuel Basallo
Rangers
VS
Orioles
Batting
129
Team Games Played
129
4288
At Bats
4283
1038
Hits
1010
497
Runs Batted In
559
141
Home Runs
157
62
Stolen Bases
68
.242
Batting Average
.236
516
Runs
579
184
Doubles
185
20
Triples
18
1685
Total Bases
1702
411
Walks
490
1105
Strikeouts
1188
.315
On Base Percentage
.319
.393
Slugging Percentage
.397
.708
OBP Pct + SLG Pct
.716
129
Games Played
129
129
Games Started
129
56
Hit By Pitch
48
0.0
Wins Above Replacement
0.0
0.0
Offensive Wins Above Replacement
0.0
17
Caught Stealing
29
1
Is Qualified
1
534.7
Runs Created
551.4
4.2
Runs Created Per 27 Outs
4.3
.086
Walks Per Plate Appearance
.101
0.37
Walk To Strikeout Ratio
0.41
.151
Isolated Power
.162
.257
Secondary Average
.285
3.86
Pitches Per Plate Appearance
4.00
345
Extra Base Hits
360
4806
Plate Appearances
4871
30.4
At Bats Per Home Run
27.3
25
Sacrifice Hit
16
25
Sacrifice Flies
32
Pitching
129
Team Games Played
129
41
Quality Starts
51
64
Wins
62
65
Losses
67
36
Saves
34
65
Holds
68
1072
Hits
1117
529
Earned runs
538
155
Home Runs
138
385
Walks
427
1086
Strikeouts
1031
8.6
Strikeouts Per 9 Innings
8.1
144.5
Pitches Per Start
145.7
1.29
Walks Plus Hits Per Inning Pitched
1.35
4.21
Earned Run Average
4.22
65
Losses
67
1130.1
Innings pitched
1146.2
.496
Win Percentage
.481
52
Save Opportunities
52
.247
Opponent Batting Average
.254
.314
Opponent's On-base pct.
.322
.409
Opponent's Slugging pct.
.410
.722
Opponent's OPB Pct + SLG Pct
.732
4348
At Bats
4397
200
Doubles
224
20
Triples
23
52
Batters Hit
37
79
Stolen Bases
69
129
Games Played
129
0
Complete Games
1
12
Shutouts
2
41
Wild Pitches
40
543
Runs Batted In
586
1
Balks
2
1130.1
Innings pitched
1146.2
8.6
Strikeouts Per 9 Innings
8.1
23
Caught Stealing
30
129
Games Started
129
0.0
Wins Above Replacement
0.0
1
Is Qualified
1
561
Runs
613
529
Earned Runs
538
1777
Total Bases
1801
Fielding
129
Team Games Played
129
1130
Full Innings
1147
4432
Total Chances
4629
3391
Putouts
3440
988
Assists
1107
53
Errors
82
184
Double Plays
185
0.988
Fielding Percentage
0.982
34.9
Range Factor
35.7
0.0
Zone Rating
0.0
129
Games Played
129
0
Games Started
0
0.0
Defensive Wins Above Replacement
0.0
1
Qualified
1