

Rays vs Athletics Live Score (12 Aug, 2026)
Game Information
Stage
Standard
Season
2026
First Pitch
Tue, Aug 11, 9:40 pm
Venue
Sutter Health Park
Location
Sacramento, California
Attendance
8,154
Home Runs
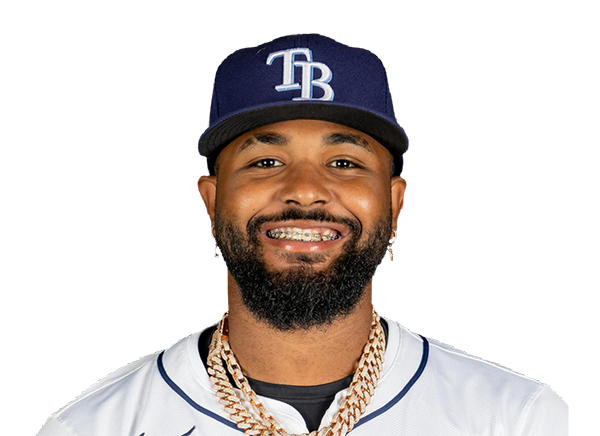
Junior Caminero
34 HR
.277 AVG
74 RBI
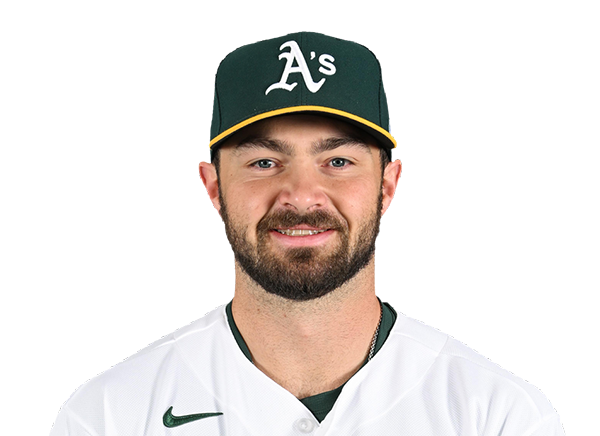
Shea Langeliers
23 HR
.263 AVG
51 RBI
Batting Average
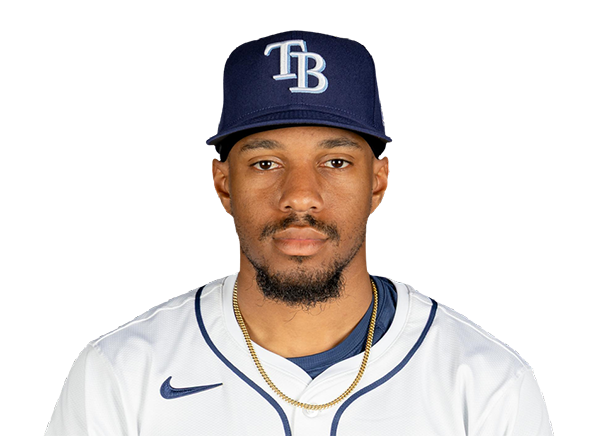
Chandler Simpson
.305 AVG
.333 OBP
.363 SLG
Shea Langeliers
.263 AVG
.332 OBP
.497 SLG
Runs Batted In
Junior Caminero
74 RBI
34 HR
.277 AVG
Nick Kurtz
69 RBI
21 HR
.256 AVG

Earned Run Average
Nick Martinez
2.65 ERA
11 W
73 K

J.T. Ginn
3.41 ERA
8 W
107 K

Wins
Nick Martinez
11 W
2.65 ERA
73 K
J.T. Ginn
8 W
3.41 ERA
107 K
Strikeouts
Drew Rasmussen
130 K
11 W
2.75 ERA

J.T. Ginn
107 K
8 W
3.41 ERA
Injury Report







Team Stats
 TB
ATH


Array
Runs
Array
11
Hits
8
0
Errors
1
—
Home Runs
—
—
Walks
—
—
Strikeouts
—
Standings
American League
| Team | W | L | PCT | GB | DIFF | STRK |
|---|---|---|---|---|---|---|
| 1Rays | 76 | 53 | .589 | - | +42 | L3 |
2 White Sox | 67 | 61 | .523 | 8.5 | +47 | W1 |
3 Astros | 65 | 64 | .504 | 11 | -42 | W1 |
4 Yankees | 73 | 56 | .566 | 3 | +95 | L1 |
5 Red Sox | 69 | 59 | .539 | 6.5 | +97 | W1 |
6 Rangers | 64 | 66 | .492 | 12.5 | -48 | L1 |
7 Blue Jays | 64 | 67 | .489 | 13 | -50 | W1 |
8 Twins | 63 | 66 | .488 | 13 | -45 | L1 |
9 Guardians | 63 | 66 | .488 | 13 | -15 | W2 |
10 Orioles | 63 | 67 | .485 | 13.5 | -33 | W2 |
11 Mariners | 62 | 68 | .477 | 14.5 | -44 | W2 |
12 Tigers | 61 | 68 | .473 | 15 | +77 | L4 |
13 Royals | 57 | 74 | .435 | 20 | -95 | W7 |
14 Angels | 52 | 78 | .400 | 24.5 | -68 | W1 |
| 15Athletics | 49 | 80 | .380 | 27 | -189 | L5 |
National League
| Team | W | L | PCT | GB | DIFF | STRK |
|---|---|---|---|---|---|---|
1 Brewers | 81 | 49 | .623 | - | +163 | W3 |
2 Dodgers | 78 | 51 | .605 | 2.5 | +146 | W4 |
3 Braves | 75 | 55 | .577 | 6 | +108 | L2 |
4 Cubs | 74 | 56 | .569 | 7 | +98 | L3 |
5 Phillies | 72 | 58 | .554 | 9 | +25 | W8 |
6 Padres | 69 | 60 | .535 | 11.5 | +7 | W1 |
7 Diamondbacks | 68 | 61 | .527 | 12.5 | +13 | W2 |
8 Marlins | 66 | 64 | .508 | 15 | +17 | W2 |
9 Cardinals | 66 | 65 | .504 | 15.5 | 0 | L2 |
10 Pirates | 63 | 67 | .485 | 18 | +30 | L1 |
11 Reds | 61 | 68 | .473 | 19.5 | -98 | L2 |
12 Nationals | 61 | 70 | .466 | 20.5 | +14 | L3 |
13 Mets | 58 | 71 | .450 | 22.5 | -44 | L1 |
14 Giants | 52 | 76 | .406 | 28 | -78 | L2 |
15 Rockies | 50 | 78 | .391 | 30 | -130 | L4 |
TB
VS
ATH
Pitchers
Nick Martinez
Catchers
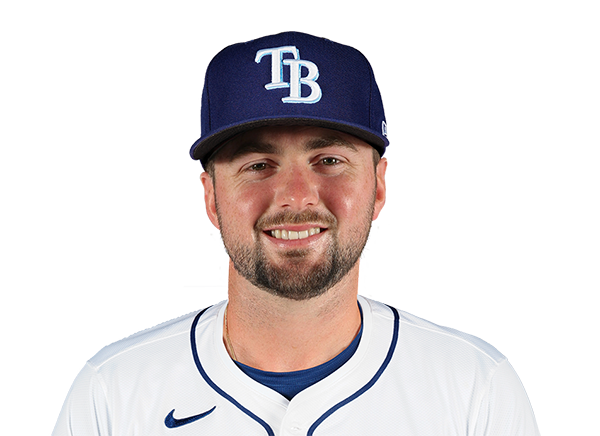
Liam Hicks
Infielders
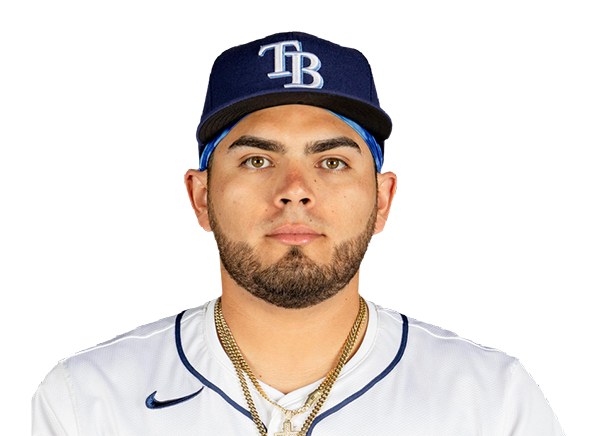
Jonathan Aranda
Junior Caminero
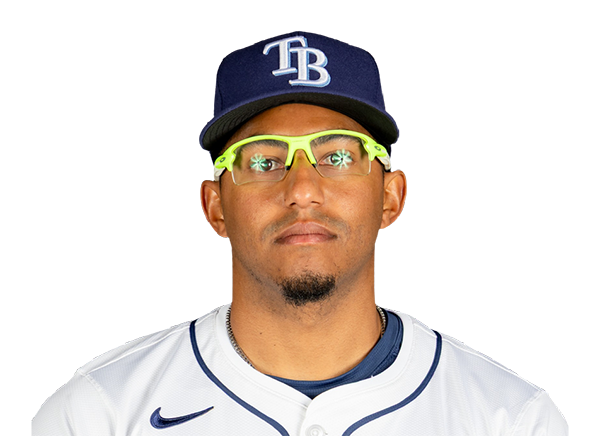
Richie Palacios

Taylor Walls
Outfielders
Chandler Simpson
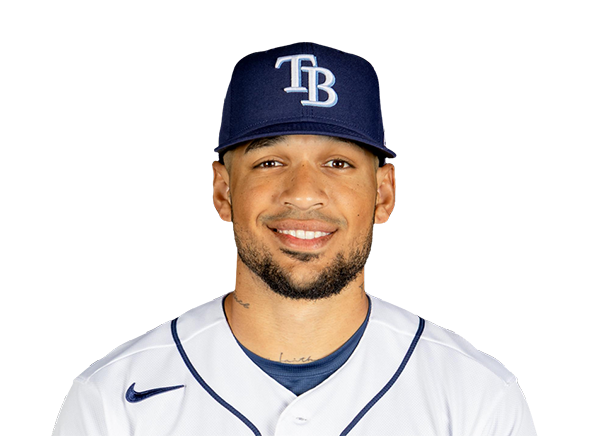
Victor Mesa Jr.

Cedric Mullins
Designated Hitters
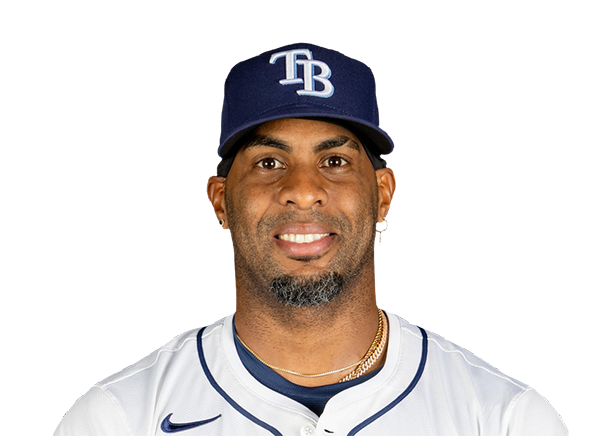
Yandy Diaz
Pitchers

Mason Barnett
Catchers

Jonah Heim
Infielders

Jeff McNeil

Jacob Wilson

Donovan Walton

Tommy White
Outfielders

Zack Gelof
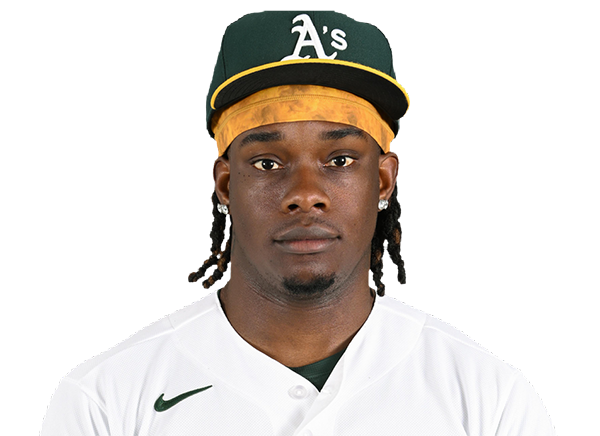
Lawrence Butler

Henry Bolte
Designated Hitters
Carlos Cortes
Rays
VS
Athletics
Batting
119
Team Games Played
120
3987
At Bats
4076
1034
Hits
992
516
Runs Batted In
498
127
Home Runs
141
119
Stolen Bases
65
.259
Batting Average
.243
541
Runs
520
169
Doubles
186
19
Triples
11
1622
Total Bases
1623
390
Walks
395
850
Strikeouts
1041
.330
On Base Percentage
.317
.407
Slugging Percentage
.398
.737
OBP Pct + SLG Pct
.715
119
Games Played
120
119
Games Started
120
45
Hit By Pitch
53
0.0
Wins Above Replacement
0.0
0.0
Offensive Wins Above Replacement
0.0
38
Caught Stealing
23
1
Is Qualified
1
545.0
Runs Created
514.6
4.7
Runs Created Per 27 Outs
4.3
.087
Walks Per Plate Appearance
.087
0.46
Walk To Strikeout Ratio
0.38
.147
Isolated Power
.155
.266
Secondary Average
.262
3.79
Pitches Per Plate Appearance
3.80
315
Extra Base Hits
338
4492
Plate Appearances
4564
31.4
At Bats Per Home Run
28.9
34
Sacrifice Hit
17
33
Sacrifice Flies
22
Pitching
119
Team Games Played
120
38
Quality Starts
25
73
Wins
47
46
Losses
73
48
Saves
29
93
Holds
62
909
Hits
1117
436
Earned runs
649
146
Home Runs
190
304
Walks
479
970
Strikeouts
1020
8.2
Strikeouts Per 9 Innings
8.6
138.6
Pitches Per Start
154.1
1.14
Walks Plus Hits Per Inning Pitched
1.50
3.70
Earned Run Average
5.49
46
Losses
73
1061.0
Innings pitched
1063.1
.613
Win Percentage
.392
62
Save Opportunities
53
.229
Opponent Batting Average
.269
.289
Opponent's On-base pct.
.349
.392
Opponent's Slugging pct.
.468
.680
Opponent's OPB Pct + SLG Pct
.817
3968
At Bats
4152
181
Doubles
218
13
Triples
19
44
Batters Hit
60
102
Stolen Bases
81
119
Games Played
120
1
Complete Games
1
11
Shutouts
6
31
Wild Pitches
33
460
Runs Batted In
675
2
Balks
7
1061.0
Innings pitched
1063.1
8.2
Strikeouts Per 9 Innings
8.6
27
Caught Stealing
28
119
Games Started
120
0.0
Wins Above Replacement
0.0
1
Is Qualified
1
483
Runs
696
436
Earned Runs
649
1554
Total Bases
1943
Fielding
119
Team Games Played
120
1061
Full Innings
1063
4187
Total Chances
4136
3183
Putouts
3190
933
Assists
891
71
Errors
55
169
Double Plays
186
0.983
Fielding Percentage
0.987
34.9
Range Factor
34.5
0.0
Zone Rating
0.0
119
Games Played
120
0
Games Started
0
0.0
Defensive Wins Above Replacement
0.0
1
Qualified
1