

Rays vs Blue Jays Live Score (20 Jul, 2026)
Game Information
Stage
Standard
Season
2026
First Pitch
Mon, Jul 20, 7:07 pm
Venue
Rogers Centre
Location
Toronto, Ontario
Attendance
40,837
Live Situation
1Balls
0Strikes
0Outs
—Pitcher
—At Bat
Pitch Sequence
1
BALL
Changeup
83 MPH
2
BALL IN PLAY
Four-seam FB
95 MPH
Injury Report





Team Stats
 TB
TOR


7
Runs
1
13
Hits
8
0
Errors
3
3
Home Runs
0
2
Walks
2
9
Strikeouts
2
Player Box Score
Tampa Bay Rays
| Player | H-AB | AB | R | H | RBI | HR | BB | K | #P | AVG | OBP | SLG |
|---|---|---|---|---|---|---|---|---|---|---|---|---|
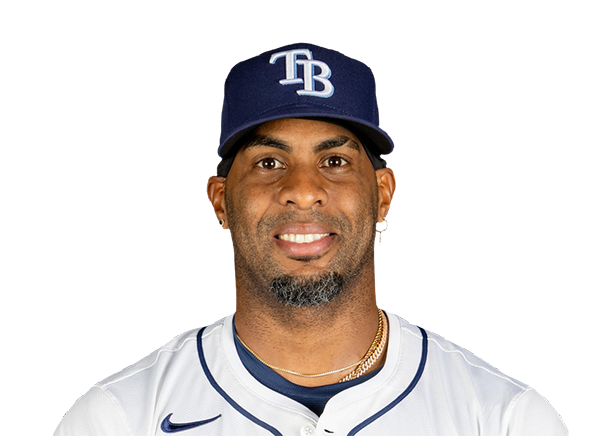 Yandy Diaz | 2-5 | 5 | 2 | 2 | 1 | 0 | 0 | 0 | 16 | .311 | .388 | .470 |
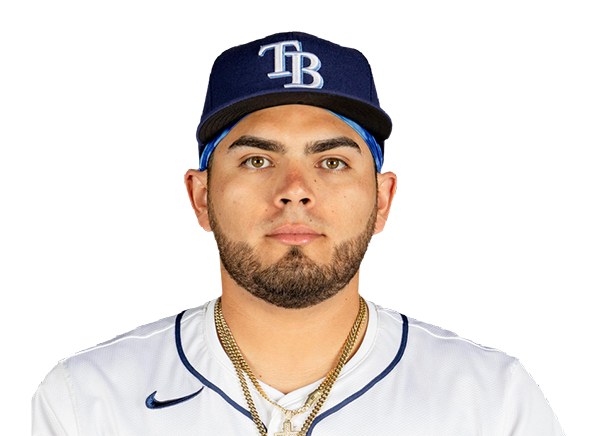 Jonathan Aranda | 1-5 | 5 | 0 | 1 | 1 | 0 | 0 | 1 | 21 | .289 | .386 | .454 |
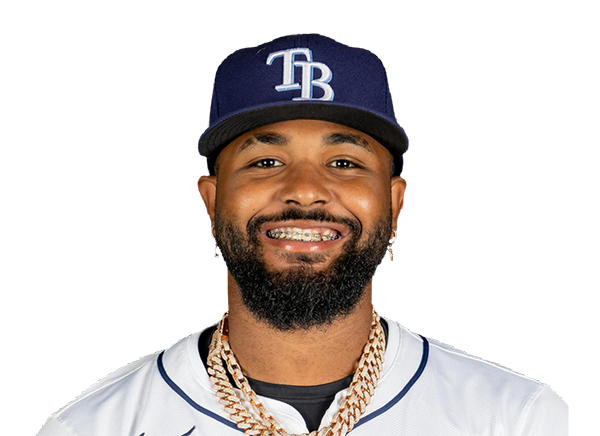 Junior Caminero | 3-4 | 4 | 0 | 3 | 2 | 0 | 1 | 0 | 14 | .285 | .374 | .559 |
 Cedric Mullins | 1-5 | 5 | 1 | 1 | 1 | 1 | 0 | 1 | 19 | .199 | .279 | .344 |
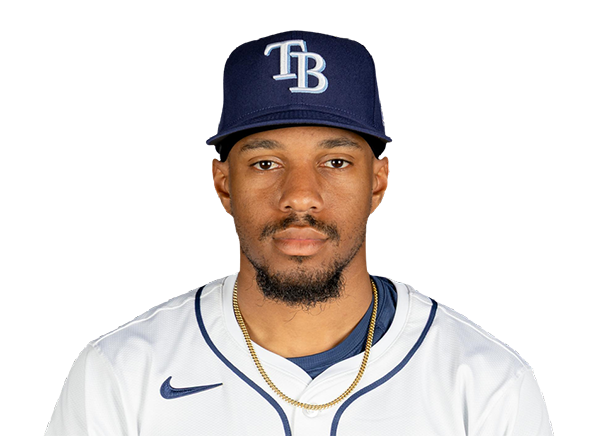 Chandler Simpson | 1-3 | 3 | 0 | 1 | 0 | 0 | 1 | 1 | 18 | .282 | .318 | .346 |
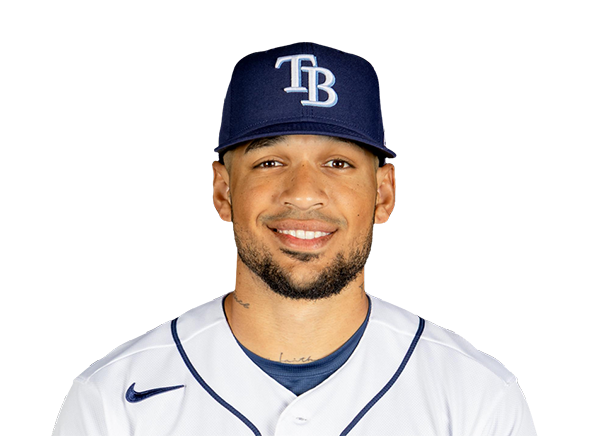 Victor Mesa Jr. | 1-4 | 4 | 1 | 1 | 1 | 1 | 0 | 2 | 18 | .218 | .304 | .475 |
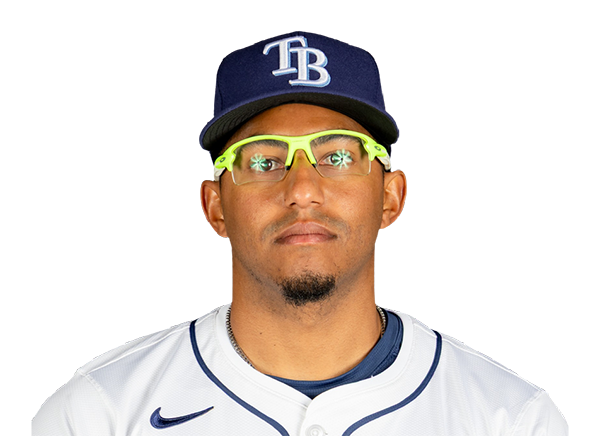 Richie Palacios | 0-4 | 4 | 0 | 0 | 0 | 0 | 0 | 3 | 19 | .236 | .333 | .337 |
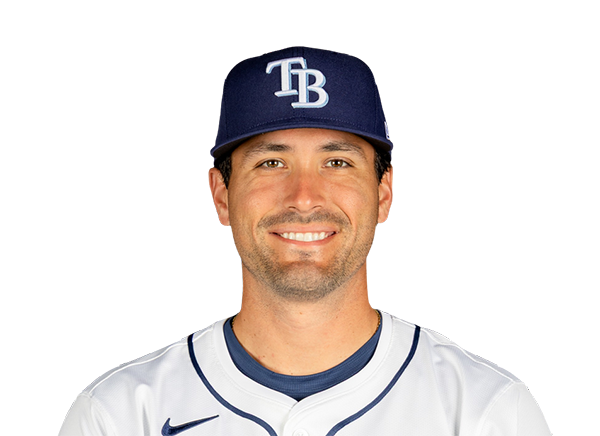 Nick Fortes | 2-4 | 4 | 2 | 2 | 1 | 1 | 0 | 0 | 12 | .258 | .302 | .350 |
 Taylor Walls | 2-3 | 3 | 1 | 2 | 0 | 0 | 0 | 1 | 8 | .224 | .318 | .295 |
Toronto Blue Jays
| Player | H-AB | AB | R | H | RBI | HR | BB | K | #P | AVG | OBP | SLG |
|---|---|---|---|---|---|---|---|---|---|---|---|---|
 Ernie Clement | 2-4 | 4 | 0 | 2 | 0 | 0 | 0 | 0 | 9 | .298 | .322 | .429 |
 Nathan Lukes | 2-4 | 4 | 0 | 2 | 0 | 0 | 0 | 0 | 21 | .290 | .342 | .400 |
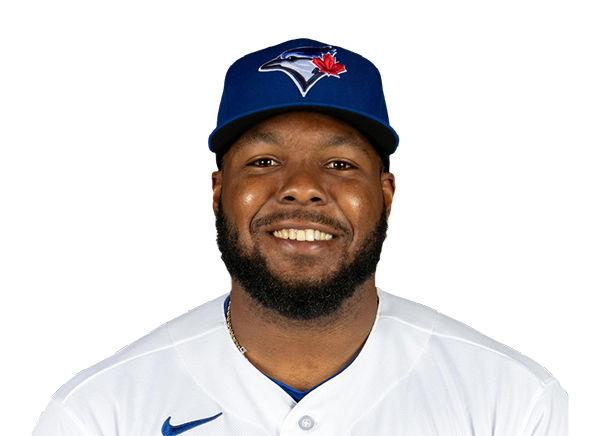 Vladimir Guerrero Jr. | 0-4 | 4 | 0 | 0 | 0 | 0 | 0 | 1 | 10 | .259 | .342 | .353 |
 George Springer | 2-3 | 3 | 1 | 2 | 0 | 0 | 1 | 0 | 15 | .224 | .308 | .384 |
 Kazuma Okamoto | 0-3 | 3 | 0 | 0 | 0 | 0 | 1 | 0 | 14 | .229 | .313 | .450 |
 Daulton Varsho | 1-4 | 4 | 0 | 1 | 0 | 0 | 0 | 0 | 12 | .239 | .304 | .382 |
 Alejandro Kirk | 1-4 | 4 | 0 | 1 | 1 | 0 | 0 | 0 | 15 | .204 | .288 | .306 |
 Andres Gimenez | 0-4 | 4 | 0 | 0 | 0 | 0 | 0 | 1 | 19 | .228 | .272 | .356 |
 Myles Straw | 0-3 | 3 | 0 | 0 | 0 | 0 | 0 | 0 | 7 | .221 | .276 | .318 |
Tampa Bay Rays
| Player | IP | H | R | ER | BB | K | HR | PC-ST | ERA | PC |
|---|---|---|---|---|---|---|---|---|---|---|
 Nick Martinez | 6.0 | 6 | 1 | 1 | 1 | 0 | 0 | 82-54 | 2.59 | 82 |
 Cam Booser | 1.0 | 0 | 0 | 0 | 0 | 1 | 0 | 11-9 | 1.35 | 11 |
 Casey Legumina | 1.0 | 1 | 0 | 0 | 0 | 1 | 0 | 13-10 | 3.92 | 13 |
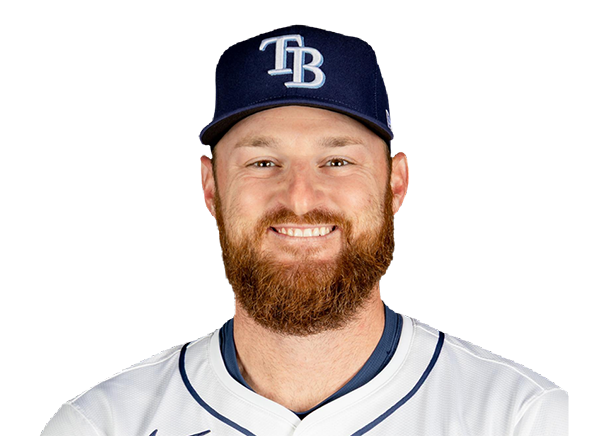 Bryan Baker | 1.0 | 1 | 0 | 0 | 1 | 0 | 0 | 16-10 | 1.69 | 16 |
Toronto Blue Jays
| Player | IP | H | R | ER | BB | K | HR | PC-ST | ERA | PC |
|---|---|---|---|---|---|---|---|---|---|---|
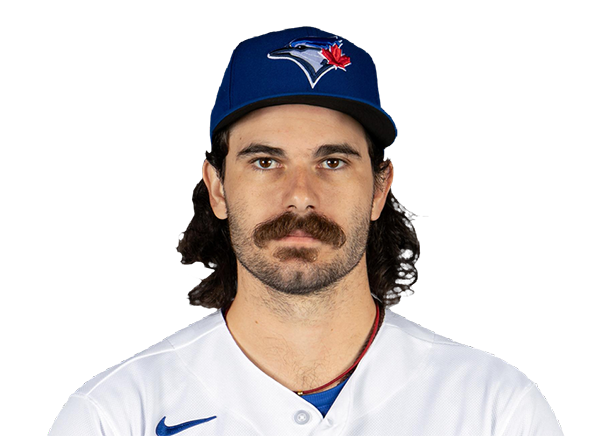 Dylan Cease | 6.0 | 7 | 5 | 3 | 1 | 7 | 2 | 101-66 | 2.67 | 101 |
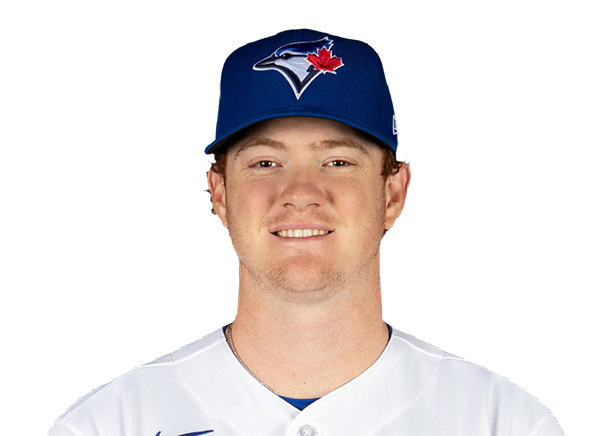 Braydon Fisher | 1.0 | 2 | 1 | 1 | 0 | 1 | 0 | 16-12 | 3.65 | 16 |
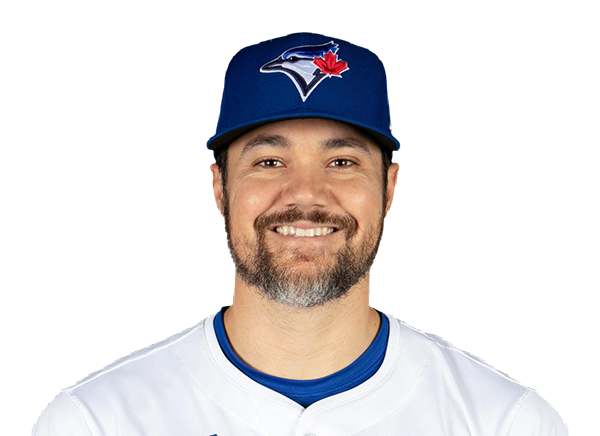 Brendon Little | 2.0 | 4 | 1 | 1 | 1 | 1 | 1 | 28-18 | 20.25 | 28 |
H2H / Season Series
TB1–5
TOR
TB7–6
TOR
TB5–10
TOR
TOR3–1
TB
TOR2–4
TB
TOR2–12
TB
TOR1–7
TB
TOR5–3
TB
TOR6–7
TB
TOR5–8
TB
Last 5 Games
| Date | Opponent | Result |
|---|---|---|
| Aug 22 |  @ BAL | L2–3 |
| Aug 21 | @ BAL | L3–5 |
| Aug 20 | vs TOR | L1–5 |
| Aug 19 | vs TOR | W7–6 |
| Aug 18 | vs TOR | L5–10 |
| Date | Opponent | Result |
|---|---|---|
| Aug 22 |  @ NYY | W4–3 |
| Aug 21 | @ NYY | L1–3 |
| Aug 20 | @ TB | W5–1 |
| Aug 19 | @ TB | L6–7 |
| Aug 18 | @ TB | W10–5 |
Standings
American League
| Team | W | L | PCT | GB | DIFF | STRK |
|---|---|---|---|---|---|---|
| 1Rays | 76 | 53 | .589 | - | +42 | L3 |
2 White Sox | 67 | 62 | .519 | 9 | +42 | L1 |
3 Astros | 65 | 65 | .500 | 11.5 | -43 | L1 |
| 4Yankees | 73 | 56 | .566 | 3 | +95 | L1 |
5 Red Sox | 70 | 59 | .543 | 6 | +98 | W2 |
6 Rangers | 64 | 66 | .492 | 12.5 | -48 | L1 |
7 Guardians | 64 | 66 | .492 | 12.5 | -14 | W3 |
| 8Blue Jays | 64 | 67 | .489 | 13 | -50 | W1 |
9 Twins | 63 | 67 | .485 | 13.5 | -47 | L2 |
| 10Orioles | 63 | 67 | .485 | 13.5 | -33 | W2 |
11 Mariners | 62 | 68 | .477 | 14.5 | -44 | W2 |
12 Tigers | 61 | 68 | .473 | 15 | +77 | L4 |
13 Royals | 57 | 74 | .435 | 20 | -95 | W7 |
14 Angels | 52 | 78 | .400 | 24.5 | -68 | W1 |
15 Athletics | 50 | 80 | .385 | 26.5 | -188 | W1 |
National League
| Team | W | L | PCT | GB | DIFF | STRK |
|---|---|---|---|---|---|---|
1 Brewers | 81 | 49 | .623 | - | +163 | W3 |
2 Dodgers | 79 | 51 | .608 | 2 | +147 | W5 |
3 Braves | 75 | 55 | .577 | 6 | +108 | L2 |
4 Cubs | 74 | 56 | .569 | 7 | +98 | L3 |
5 Phillies | 72 | 58 | .554 | 9 | +25 | W8 |
6 Padres | 70 | 60 | .538 | 11 | +9 | W2 |
7 Diamondbacks | 68 | 62 | .523 | 13 | +7 | L1 |
8 Marlins | 66 | 64 | .508 | 15 | +17 | W2 |
9 Cardinals | 66 | 65 | .504 | 15.5 | 0 | L2 |
10 Pirates | 63 | 68 | .481 | 18.5 | +29 | L2 |
11 Reds | 62 | 68 | .477 | 19 | -92 | W1 |
12 Nationals | 61 | 70 | .466 | 20.5 | +14 | L3 |
13 Mets | 59 | 71 | .454 | 22 | -39 | W1 |
14 Giants | 52 | 77 | .403 | 28.5 | -79 | L3 |
15 Rockies | 50 | 79 | .388 | 30.5 | -131 | L5 |
TB
VS
TOR
Pitchers
Nick Martinez
Cam Booser
Casey Legumina
Bryan Baker
Catchers
Nick Fortes
Infielders
Jonathan Aranda
Junior Caminero
Richie Palacios
Taylor Walls
Outfielders
Cedric Mullins
Chandler Simpson
Victor Mesa Jr.
Designated Hitters
Yandy Diaz
Pitchers
Dylan Cease
Braydon Fisher
Brendon Little
Catchers
Alejandro Kirk
Infielders
Ernie Clement
Vladimir Guerrero Jr.
Kazuma Okamoto
Andres Gimenez
Outfielders
Nathan Lukes
Daulton Varsho
Myles Straw
Designated Hitters
George Springer
Rays
VS
Blue Jays
Batting
129
Team Games Played
131
4337
At Bats
4423
1131
Hits
1087
556
Runs Batted In
495
135
Home Runs
124
128
Stolen Bases
65
.261
Batting Average
.246
584
Runs
518
183
Doubles
207
20
Triples
8
1759
Total Bases
1682
416
Walks
360
913
Strikeouts
956
.330
On Base Percentage
.307
.406
Slugging Percentage
.380
.735
OBP Pct + SLG Pct
.687
129
Games Played
131
0
Games Started
0
47
Hit By Pitch
46
0.0
Wins Above Replacement
0.0
0.0
Offensive Wins Above Replacement
0.0
42
Caught Stealing
14
1
Is Qualified
1
589.5
Runs Created
518.7
4.7
Runs Created Per 27 Outs
4.0
.085
Walks Per Plate Appearance
.074
0.46
Walk To Strikeout Ratio
0.38
.145
Isolated Power
.135
.261
Secondary Average
.227
3.78
Pitches Per Plate Appearance
3.80
338
Extra Base Hits
339
4874
Plate Appearances
4892
32.1
At Bats Per Home Run
35.7
36
Sacrifice Hit
21
35
Sacrifice Flies
39
Pitching
129
Team Games Played
131
39
Quality Starts
40
76
Wins
64
53
Losses
67
50
Saves
44
97
Holds
85
1014
Hits
1040
493
Earned runs
512
166
Home Runs
134
329
Walks
479
1056
Strikeouts
1139
8.3
Strikeouts Per 9 Innings
8.8
0.0
Pitches Per Start
0.0
1.17
Walks Plus Hits Per Inning Pitched
1.30
3.85
Earned Run Average
3.95
53
Losses
67
1151.0
Innings pitched
1166.1
.589
Win Percentage
.489
65
Save Opportunities
59
.234
Opponent Batting Average
.238
.293
Opponent's On-base pct.
.315
.401
Opponent's Slugging pct.
.374
.694
Opponent's OPB Pct + SLG Pct
.690
4331
At Bats
4367
199
Doubles
174
13
Triples
9
48
Batters Hit
33
109
Stolen Bases
126
129
Games Played
131
1
Complete Games
1
0
Shutouts
1
35
Wild Pitches
41
0
Runs Batted In
0
3
Balks
7
1151.0
Innings pitched
1166.1
8.3
Strikeouts Per 9 Innings
8.8
29
Caught Stealing
39
129
Games Started
131
0.0
Wins Above Replacement
0.0
1
Is Qualified
1
542
Runs
568
491
Earned Runs
509
1737
Total Bases
1634
Fielding
129
Team Games Played
131
1151
Full Innings
1166
4547
Total Chances
4696
3453
Putouts
3499
1017
Assists
1118
77
Errors
79
183
Double Plays
207
0.983
Fielding Percentage
0.983
35.0
Range Factor
35.6
0.0
Zone Rating
0.0
129
Games Played
131
0
Games Started
0
0.0
Defensive Wins Above Replacement
0.0
1
Qualified
1