

Red Sox vs Blue Jays Live Score (10 Aug, 2026)
Game Information
Stage
Standard
Season
2026
First Pitch
Mon, Aug 10, 7:07 pm
Venue
Rogers Centre
Location
Toronto, Ontario
Attendance
42,511
Home Runs
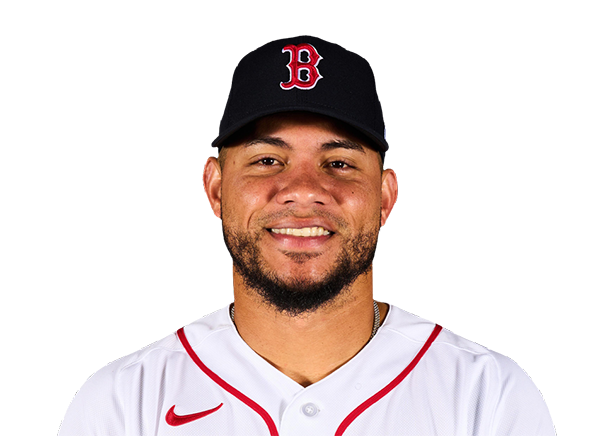
Willson Contreras
23 HR
.285 AVG
70 RBI
Kazuma Okamoto
24 HR
.225 AVG
70 RBI

Batting Average
Willson Contreras
.285 AVG
.394 OBP
.533 SLG
Ernie Clement
.284 AVG
.308 OBP
.411 SLG

Runs Batted In
Willson Contreras
70 RBI
23 HR
.285 AVG
Kazuma Okamoto
70 RBI
24 HR
.225 AVG
Earned Run Average
Sonny Gray
2.78 ERA
14 W
106 K

Dylan Cease
2.28 ERA
7 W
184 K
Wins
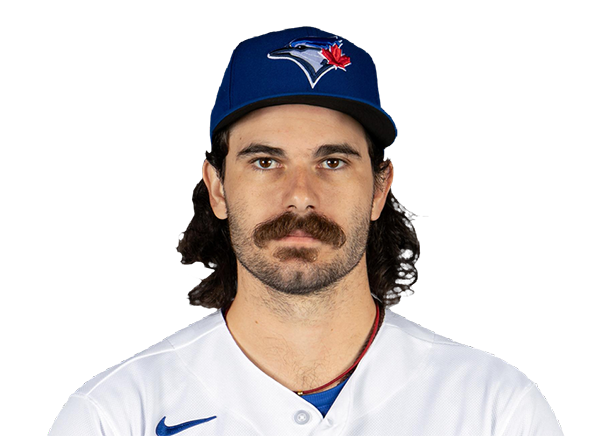
Sonny Gray
14 W
2.78 ERA
106 K
Dylan Cease
7 W
2.28 ERA
184 K
Strikeouts
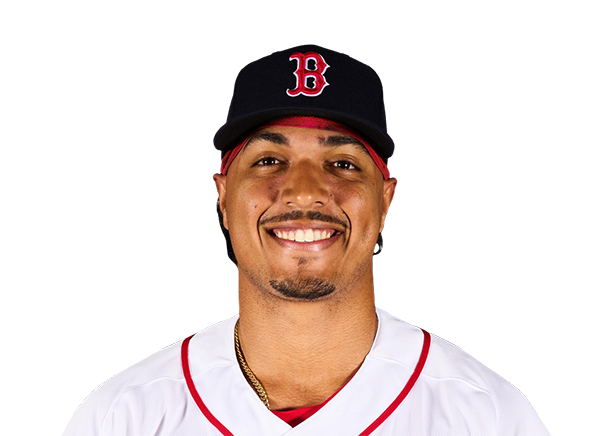
Payton Tolle
124 K
7 W
3.20 ERA
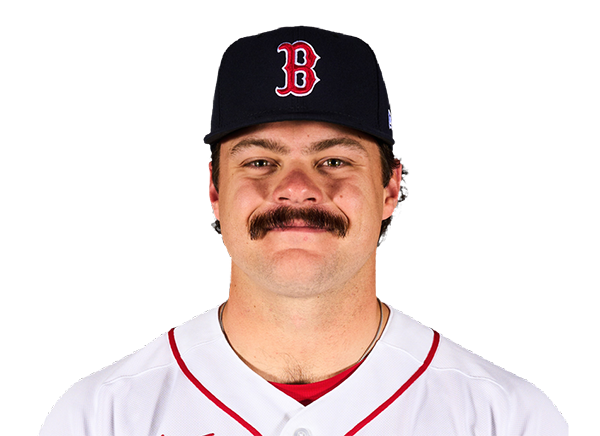
Dylan Cease
184 K
7 W
2.28 ERA
Injury Report





Team Stats
 BOS
TOR


Array
Runs
Array
6
Hits
7
1
Errors
0
—
Home Runs
—
—
Walks
—
—
Strikeouts
—
Standings
American League
| Team | W | L | PCT | GB | DIFF | STRK |
|---|---|---|---|---|---|---|
1 Rays | 76 | 53 | .589 | - | +42 | L3 |
2 White Sox | 67 | 62 | .519 | 9 | +42 | L1 |
3 Astros | 65 | 65 | .500 | 11.5 | -43 | L1 |
4 Yankees | 73 | 56 | .566 | 3 | +95 | L1 |
| 5Red Sox | 70 | 59 | .543 | 6 | +98 | W2 |
6 Rangers | 64 | 66 | .492 | 12.5 | -48 | L1 |
7 Guardians | 64 | 66 | .492 | 12.5 | -14 | W3 |
| 8Blue Jays | 64 | 67 | .489 | 13 | -50 | W1 |
9 Twins | 63 | 67 | .485 | 13.5 | -47 | L2 |
10 Orioles | 63 | 67 | .485 | 13.5 | -33 | W2 |
11 Mariners | 62 | 68 | .477 | 14.5 | -44 | W2 |
12 Tigers | 61 | 68 | .473 | 15 | +77 | L4 |
13 Royals | 57 | 74 | .435 | 20 | -95 | W7 |
14 Angels | 52 | 78 | .400 | 24.5 | -68 | W1 |
15 Athletics | 50 | 80 | .385 | 26.5 | -188 | W1 |
National League
| Team | W | L | PCT | GB | DIFF | STRK |
|---|---|---|---|---|---|---|
1 Brewers | 81 | 49 | .623 | - | +163 | W3 |
2 Dodgers | 79 | 51 | .608 | 2 | +147 | W5 |
3 Braves | 75 | 55 | .577 | 6 | +108 | L2 |
4 Cubs | 74 | 56 | .569 | 7 | +98 | L3 |
5 Phillies | 72 | 58 | .554 | 9 | +25 | W8 |
6 Padres | 70 | 60 | .538 | 11 | +9 | W2 |
7 Diamondbacks | 68 | 62 | .523 | 13 | +7 | L1 |
8 Marlins | 66 | 64 | .508 | 15 | +17 | W2 |
9 Cardinals | 66 | 65 | .504 | 15.5 | 0 | L2 |
10 Pirates | 63 | 68 | .481 | 18.5 | +29 | L2 |
11 Reds | 62 | 68 | .477 | 19 | -92 | W1 |
12 Nationals | 61 | 70 | .466 | 20.5 | +14 | L3 |
13 Mets | 59 | 71 | .454 | 22 | -39 | W1 |
14 Giants | 52 | 77 | .403 | 28.5 | -79 | L3 |
15 Rockies | 50 | 79 | .388 | 30.5 | -131 | L5 |
BOS
VS
TOR
Pitchers
Sonny Gray
Catchers
Connor Wong
Infielders

Nick Sogard
Willson Contreras
Caleb Durbin

Anthony Seigler
Outfielders

Ceddanne Rafaela

Wilyer Abreu
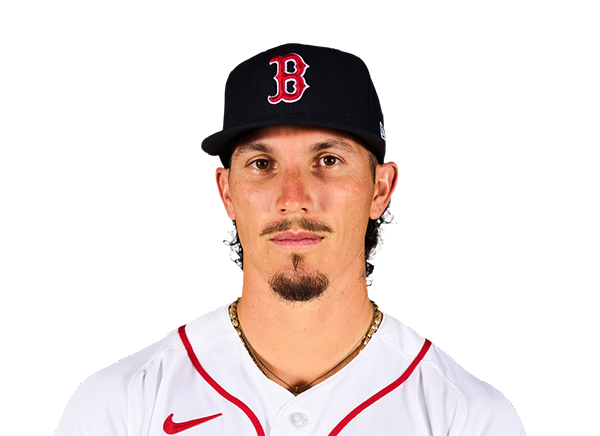
Jarren Duran
Designated Hitters
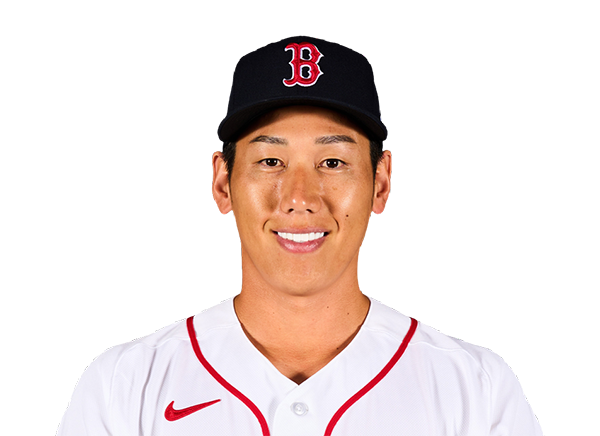
Masataka Yoshida
Pitchers

Jameson Taillon
Catchers
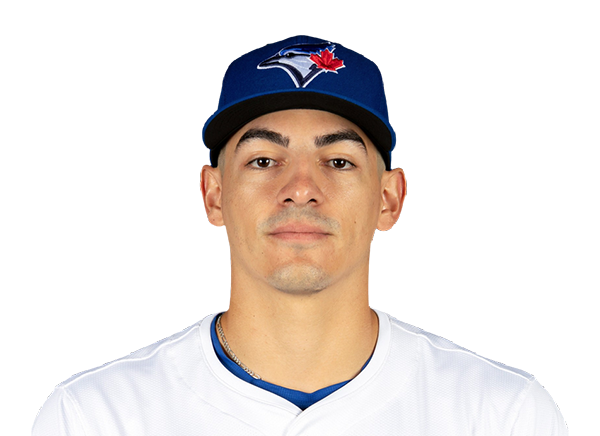
Brandon Valenzuela
Infielders
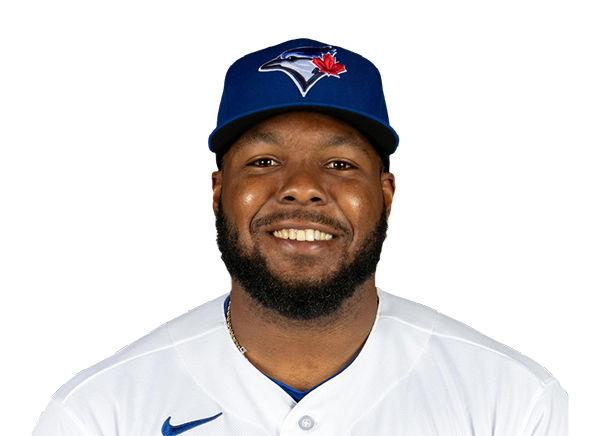
Vladimir Guerrero Jr.
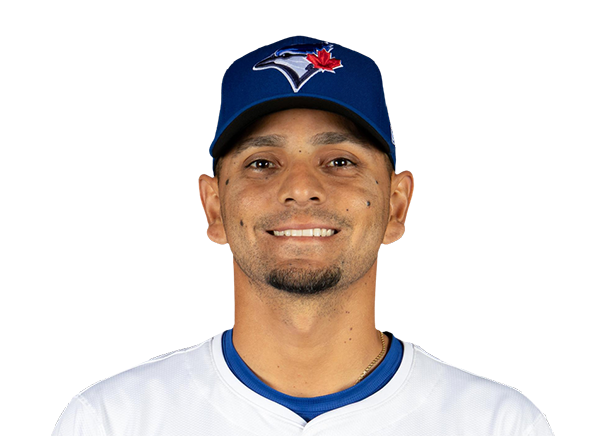
Andres Gimenez
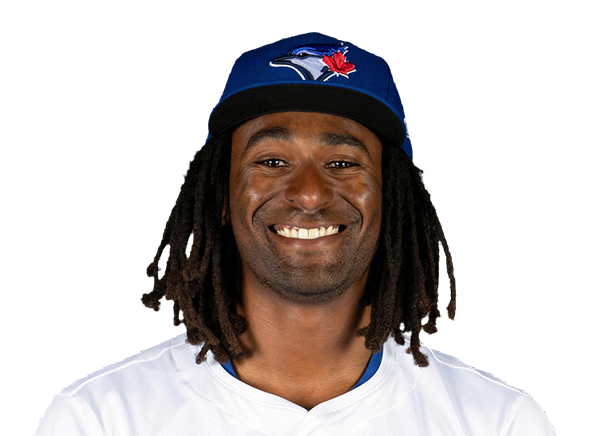
Charles McAdoo
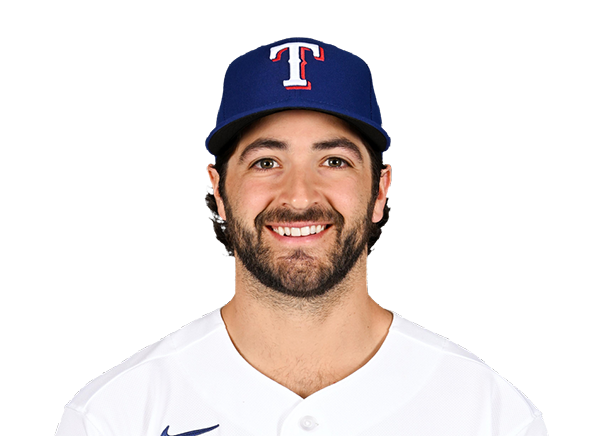
Josh Smith
Outfielders

Nathan Lukes
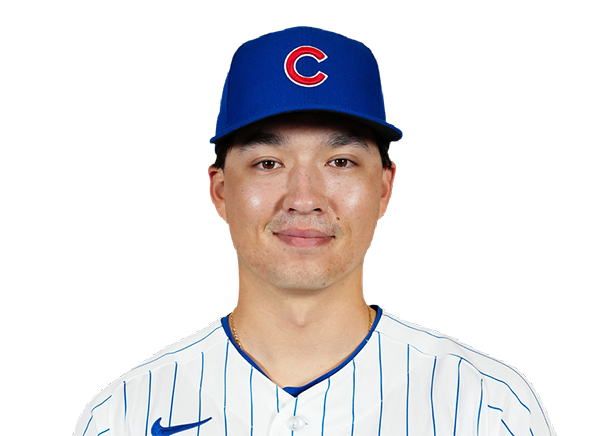
Brett Bateman
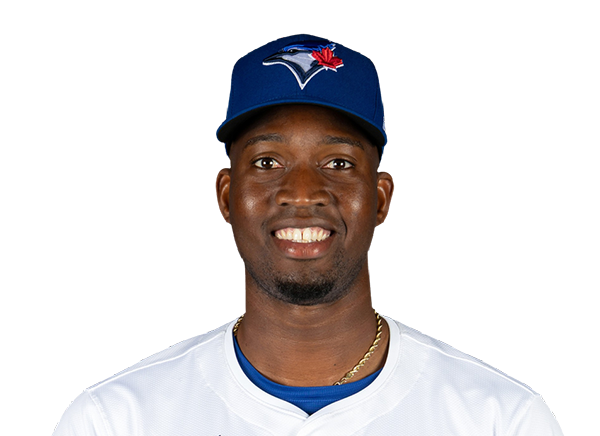
Jesus Sanchez
Designated Hitters
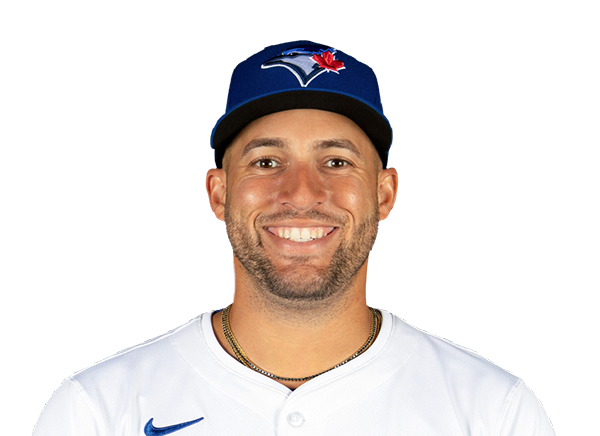
George Springer
Red Sox
VS
Blue Jays
Batting
118
Team Games Played
120
3947
At Bats
4044
978
Hits
976
500
Runs Batted In
450
118
Home Runs
115
91
Stolen Bases
58
.248
Batting Average
.241
524
Runs
471
213
Doubles
186
18
Triples
7
1581
Total Bases
1521
367
Walks
327
968
Strikeouts
878
.320
On Base Percentage
.303
.401
Slugging Percentage
.376
.720
OBP Pct + SLG Pct
.679
118
Games Played
120
118
Games Started
120
70
Hit By Pitch
44
0.0
Wins Above Replacement
0.0
0.0
Offensive Wins Above Replacement
0.0
33
Caught Stealing
14
1
Is Qualified
1
517.1
Runs Created
462.6
4.4
Runs Created Per 27 Outs
3.9
.082
Walks Per Plate Appearance
.073
0.38
Walk To Strikeout Ratio
0.37
.153
Isolated Power
.135
.260
Secondary Average
.227
3.82
Pitches Per Plate Appearance
3.81
349
Extra Base Hits
308
4452
Plate Appearances
4469
33.4
At Bats Per Home Run
35.2
27
Sacrifice Hit
16
39
Sacrifice Flies
35
Pitching
118
Team Games Played
120
49
Quality Starts
35
64
Wins
57
54
Losses
63
34
Saves
39
75
Holds
78
947
Hits
966
408
Earned runs
474
117
Home Runs
125
332
Walks
442
1018
Strikeouts
1054
8.7
Strikeouts Per 9 Innings
8.9
139.8
Pitches Per Start
149.7
1.22
Walks Plus Hits Per Inning Pitched
1.32
3.49
Earned Run Average
3.99
54
Losses
63
1051.1
Innings pitched
1068.1
.542
Win Percentage
.475
45
Save Opportunities
54
.239
Opponent Batting Average
.240
.303
Opponent's On-base pct.
.317
.377
Opponent's Slugging pct.
.379
.680
Opponent's OPB Pct + SLG Pct
.696
3968
At Bats
4021
183
Doubles
164
8
Triples
9
46
Batters Hit
29
81
Stolen Bases
114
118
Games Played
120
0
Complete Games
1
11
Shutouts
8
26
Wild Pitches
36
425
Runs Batted In
502
3
Balks
5
1051.1
Innings pitched
1068.1
8.7
Strikeouts Per 9 Innings
8.9
15
Caught Stealing
36
118
Games Started
120
0.0
Wins Above Replacement
0.0
1
Is Qualified
1
441
Runs
529
408
Earned Runs
474
1497
Total Bases
1523
Fielding
118
Team Games Played
120
1051
Full Innings
1068
4235
Total Chances
4307
3154
Putouts
3205
1024
Assists
1025
57
Errors
77
213
Double Plays
186
0.987
Fielding Percentage
0.982
35.8
Range Factor
35.6
0.0
Zone Rating
0.0
118
Games Played
120
0
Games Started
0
0.0
Defensive Wins Above Replacement
0.0
1
Qualified
1