

Red Sox vs Rangers Live Score (18 Sep, 2026)
Game Information
Stage
STD
Season
2026
First Pitch
Thu, Sep 17, 8:05 pm
Venue
Globe Life Field
Location
Arlington, Texas
Venue Type
Indoor
Broadcast
MLB.TV
Attendance
30,828
Live Situation
0Balls
1Strikes
0Outs
—Pitcher
—At Bat
Pitch Sequence
1
STRIKE LOOKING
Slider
84 MPH
2
BALL IN PLAY
Slider
85 MPH
Injury Report
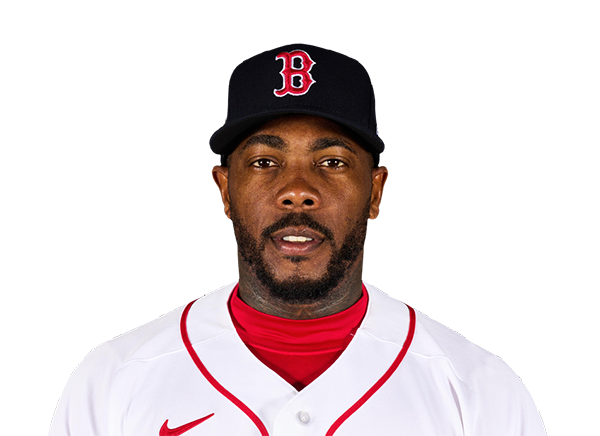



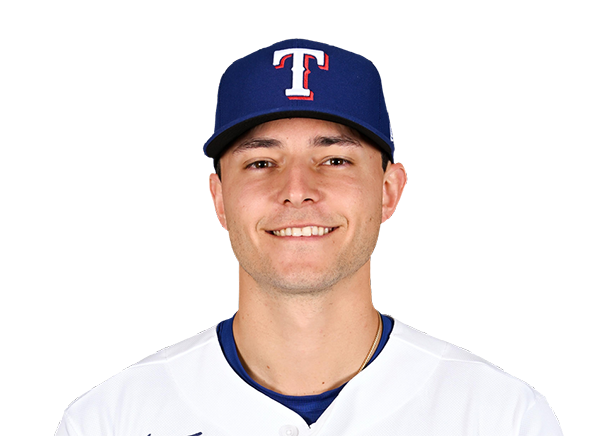
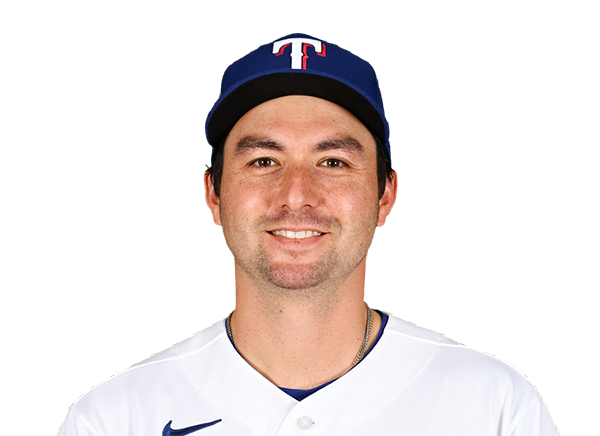
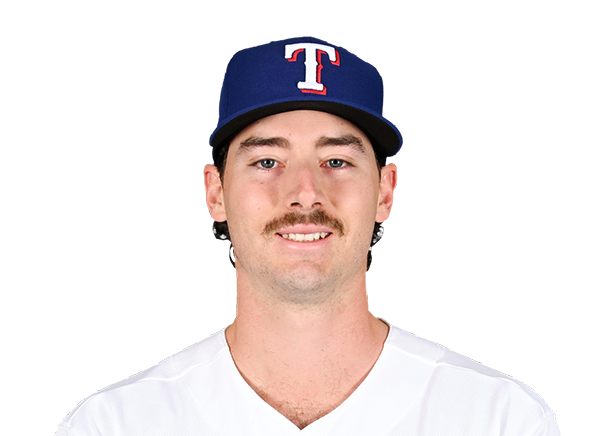
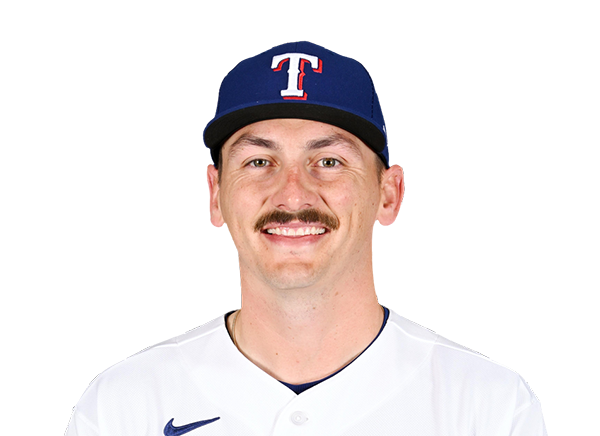
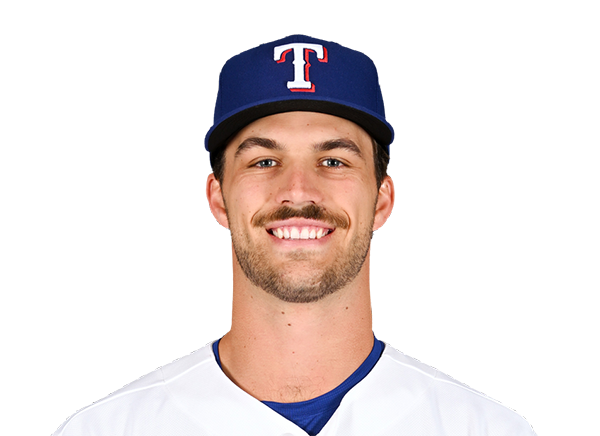
Team Stats
 BOS
TEX


4
Runs
3
5
Hits
4
0
Errors
1
1
Home Runs
1
5
Walks
4
6
Strikeouts
7
Player Box Score
Boston Red Sox
| Player | H-AB | AB | R | H | RBI | HR | BB | K | #P | AVG | OBP | SLG |
|---|---|---|---|---|---|---|---|---|---|---|---|---|
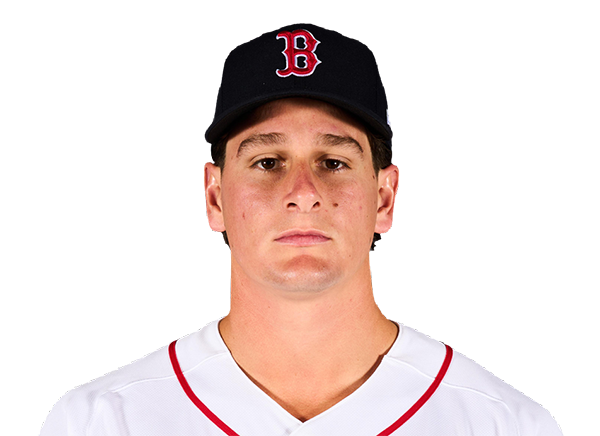 Roman Anthony | 0-4 | 4 | 0 | 0 | 1 | 0 | 1 | 0 | 21 | .231 | .333 | .357 |
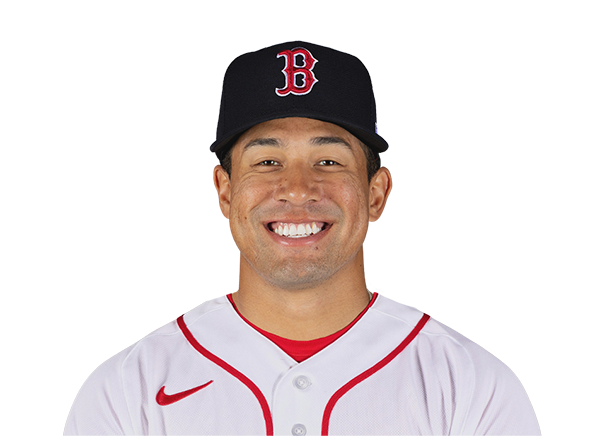 Jahmai Jones | 0-2 | 2 | 0 | 0 | 0 | 0 | 1 | 0 | 20 | .208 | .305 | .368 |
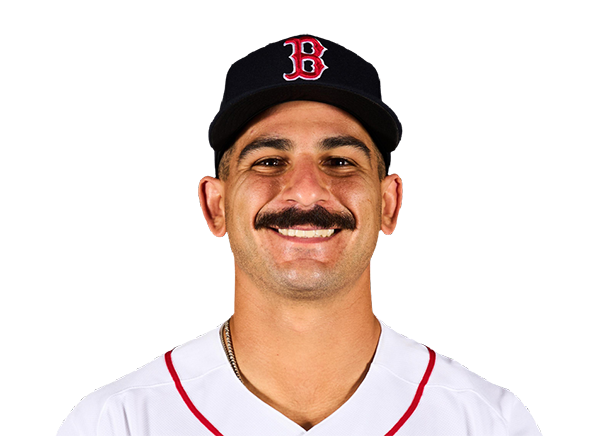 Mickey Gasper | 0-2 | 2 | 0 | 0 | 0 | 0 | 0 | 0 | 13 | .263 | .372 | .480 |
 Wilyer Abreu | 1-3 | 3 | 1 | 1 | 0 | 0 | 1 | 0 | 19 | .254 | .333 | .459 |
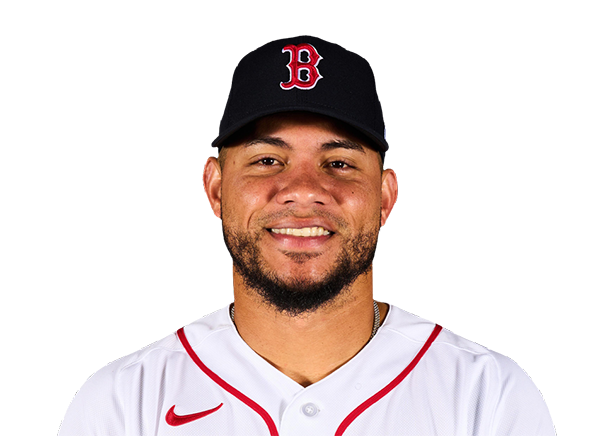 Willson Contreras | 1-3 | 3 | 0 | 1 | 0 | 0 | 0 | 1 | 13 | .276 | .387 | .518 |
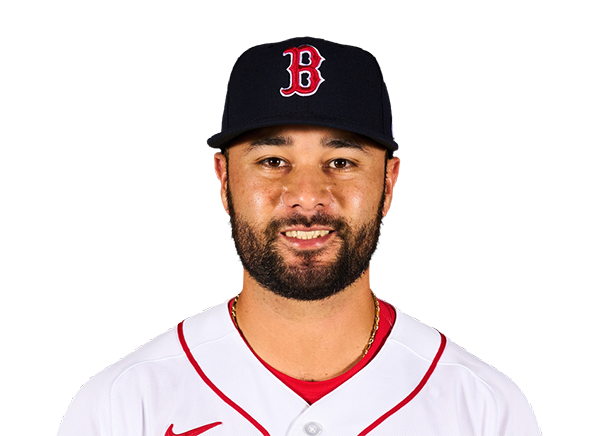 Isiah Kiner-Falefa | 0-0 | 0 | 1 | 0 | 0 | 0 | 0 | 0 | 0 | .262 | .338 | .340 |
 Adley Rutschman | 1-4 | 4 | 0 | 1 | 0 | 0 | 0 | 1 | 13 | .234 | .311 | .414 |
 Trevor Story | 2-4 | 4 | 1 | 2 | 3 | 1 | 0 | 2 | 23 | .246 | .275 | .360 |
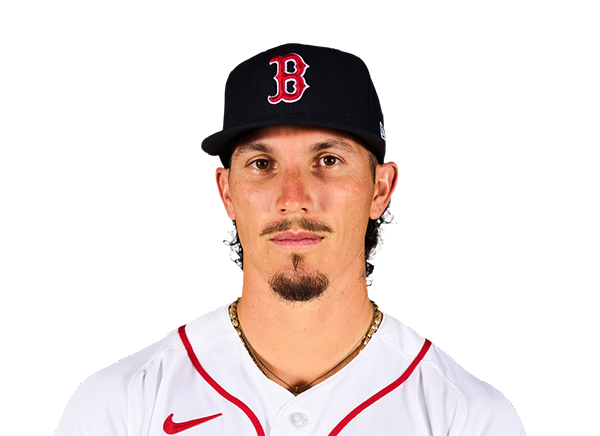 Jarren Duran | 0-2 | 2 | 0 | 0 | 0 | 0 | 0 | 1 | 8 | .203 | .259 | .359 |
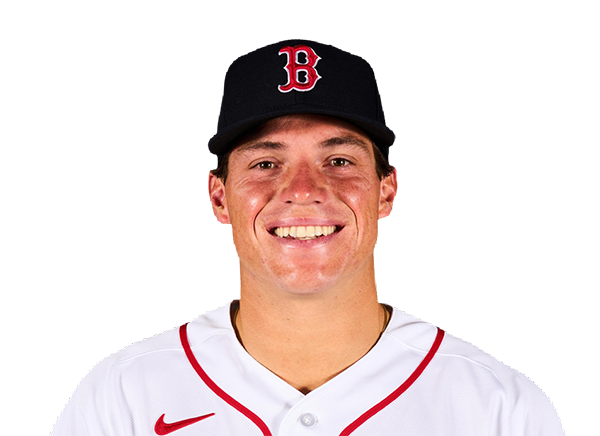 Nate Eaton | 0-1 | 1 | 1 | 0 | 0 | 0 | 1 | 1 | 8 | .125 | .271 | .250 |
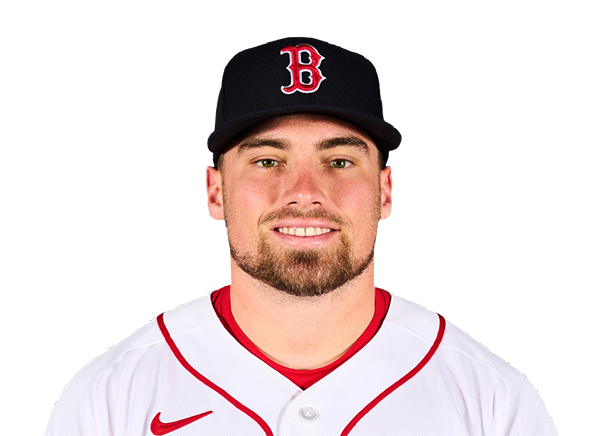 Caleb Durbin | 0-3 | 3 | 0 | 0 | 0 | 0 | 1 | 0 | 13 | .248 | .333 | .381 |
 Nick Sogard | 0-4 | 4 | 0 | 0 | 0 | 0 | 0 | 0 | 16 | .261 | .355 | .409 |
Texas Rangers
| Player | H-AB | AB | R | H | RBI | HR | BB | K | #P | AVG | OBP | SLG |
|---|---|---|---|---|---|---|---|---|---|---|---|---|
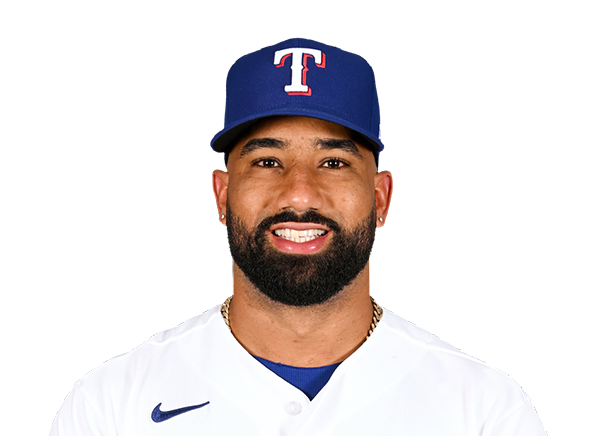 Ezequiel Duran | 0-4 | 4 | 0 | 0 | 0 | 0 | 0 | 1 | 13 | .268 | .329 | .436 |
 Corey Seager | 1-4 | 4 | 0 | 1 | 0 | 0 | 0 | 1 | 18 | .234 | .325 | .434 |
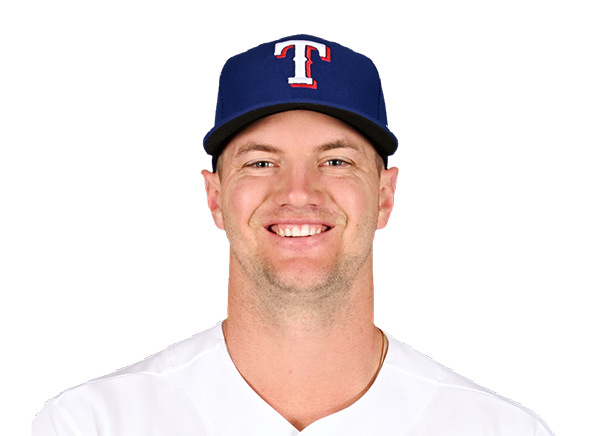 Josh Jung | 1-4 | 4 | 1 | 1 | 1 | 1 | 0 | 0 | 14 | .298 | .361 | .449 |
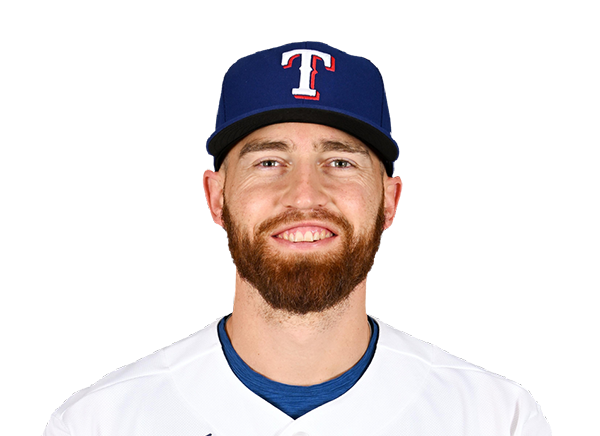 Brandon Nimmo | 0-4 | 4 | 0 | 0 | 0 | 0 | 0 | 3 | 20 | .261 | .325 | .410 |
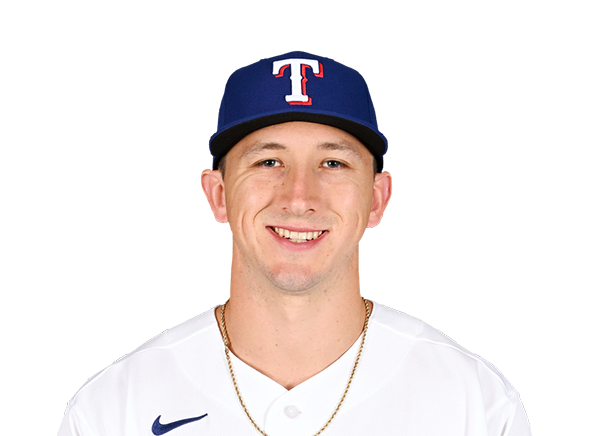 Wyatt Langford | 0-2 | 2 | 1 | 0 | 0 | 0 | 2 | 0 | 15 | .238 | .328 | .432 |
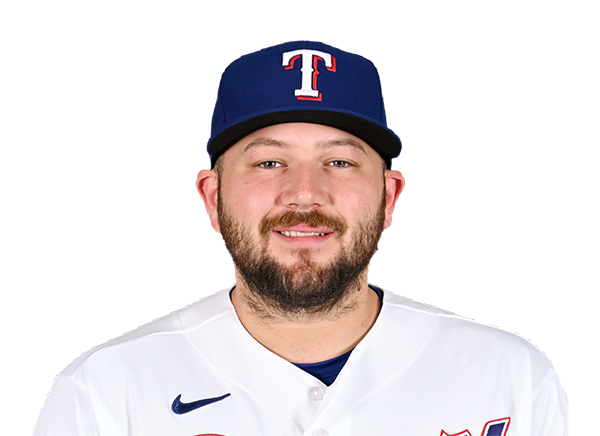 Jake Burger | 0-3 | 3 | 1 | 0 | 0 | 0 | 1 | 0 | 17 | .233 | .305 | .424 |
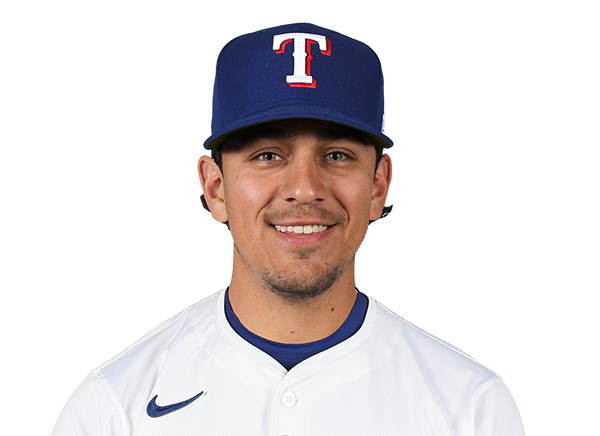 Nicky Lopez | 0-1 | 1 | 0 | 0 | 0 | 0 | 1 | 1 | 17 | .269 | .314 | .311 |
 Danny Jansen | 2-3 | 3 | 0 | 2 | 1 | 0 | 0 | 0 | 9 | .202 | .289 | .364 |
 Evan Carter | 0-2 | 2 | 0 | 0 | 1 | 0 | 0 | 1 | 10 | .192 | .290 | .317 |
Boston Red Sox
| Player | IP | H | R | ER | BB | K | HR | PC-ST | ERA | PC |
|---|---|---|---|---|---|---|---|---|---|---|
 Sonny Gray | 6.1 | 3 | 3 | 3 | 3 | 6 | 1 | 102-67 | 2.82 | 102 |
 Wyatt Olds | 1.0 | 0 | 0 | 0 | 0 | 1 | 0 | 12-9 | 1.23 | 12 |
 Alec Gamboa | 0.2 | 1 | 0 | 0 | 0 | 0 | 0 | 7-3 | 1.21 | 7 |
 Garrett Whitlock | 1.0 | 0 | 0 | 0 | 1 | 0 | 0 | 12-8 | 1.78 | 12 |
Texas Rangers
| Player | IP | H | R | ER | BB | K | HR | PC-ST | ERA | PC |
|---|---|---|---|---|---|---|---|---|---|---|
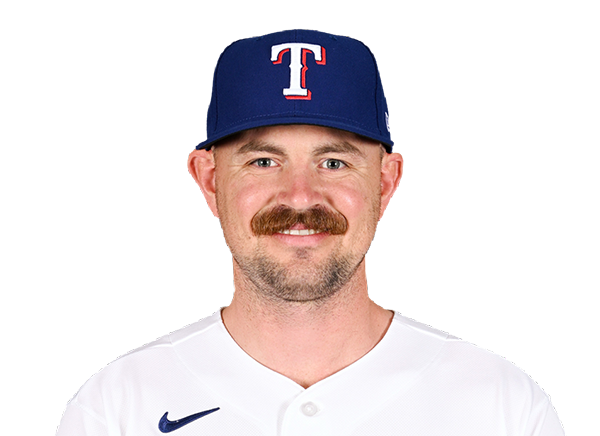 Tyler Alexander | 1.0 | 0 | 0 | 0 | 1 | 0 | 0 | 18-10 | 3.33 | 18 |
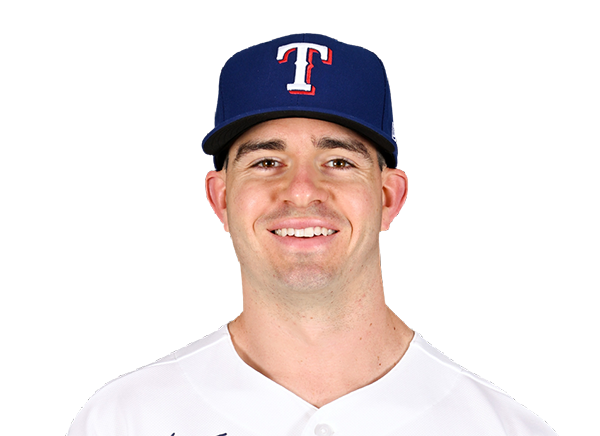 Cody Bradford | 4.1 | 3 | 0 | 0 | 1 | 3 | 0 | 73-52 | 4.19 | 73 |
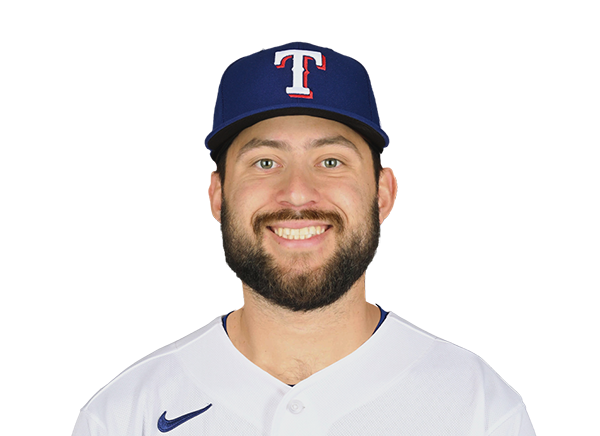 Chase Silseth | 0.2 | 1 | 0 | 0 | 0 | 2 | 0 | 13-8 | 3.34 | 13 |
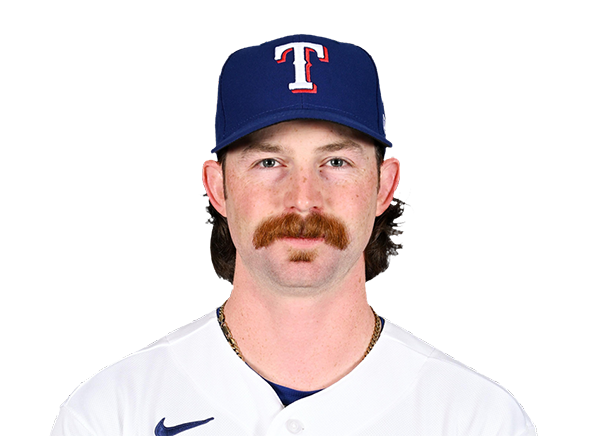 Robby Ahlstrom | 0.2 | 0 | 1 | 1 | 2 | 0 | 0 | 18-7 | 6.08 | 18 |
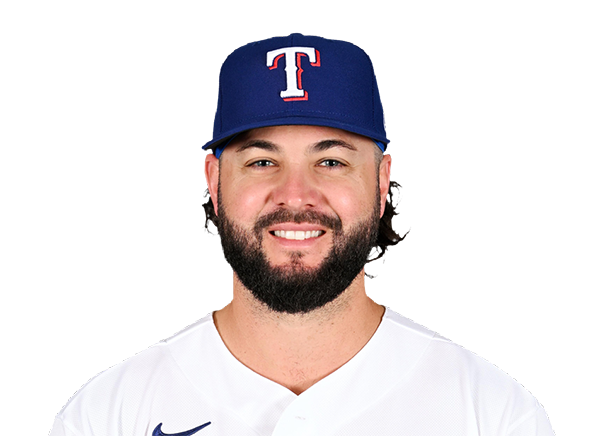 Jakob Junis | 0.1 | 0 | 2 | 2 | 1 | 0 | 0 | 14-7 | 3.66 | 14 |
 Jacob Latz | 1.0 | 1 | 1 | 1 | 0 | 1 | 1 | 15-12 | 2.11 | 15 |
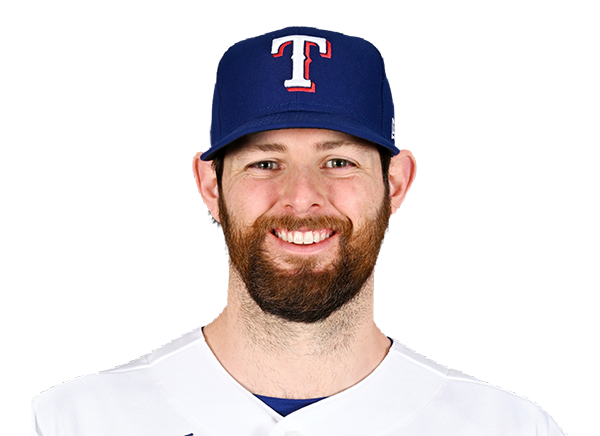 Jordan Montgomery | 1.0 | 0 | 0 | 0 | 0 | 0 | 0 | 16-9 | 5.00 | 16 |
H2H / Season Series
TEX3–4
BOS
TEX7–3
BOS
TEX4–2
BOS
BOS4–6
TEX
BOS6–3
TEX
BOS10–1
TEX
Last 5 Games
| Date | Opponent | Result |
|---|---|---|
| Sep 17 | @ TEX | W4–3 |
| Sep 16 | @ TEX | L3–7 |
| Sep 15 | @ TEX | L2–4 |
| Sep 13 |  vs KC | W4–1 |
| Sep 12 | vs KC | W5–1 |
| Date | Opponent | Result |
|---|---|---|
| Sep 17 | vs BOS | L3–4 |
| Sep 16 | vs BOS | W7–3 |
| Sep 15 | vs BOS | W4–2 |
| Sep 13 |  @ ARI | W7–6 |
| Sep 12 | @ ARI | W6–2 |
Standings
American League
| Team | W | L | PCT | GB | DIFF | STRK |
|---|---|---|---|---|---|---|
1 Rays | 93 | 59 | .612 | - | +80 | W6 |
2 White Sox | 78 | 75 | .510 | 15.5 | +36 | W1 |
3 Astros | 77 | 76 | .503 | 16.5 | -50 | W1 |
4 Yankees | 88 | 64 | .579 | 5 | +136 | L1 |
| 5Red Sox | 83 | 70 | .542 | 10.5 | +83 | W1 |
6 Guardians | 78 | 75 | .510 | 15.5 | -7 | W2 |
| 7Rangers | 76 | 77 | .497 | 17.5 | -39 | L1 |
8 Blue Jays | 76 | 77 | .497 | 17.5 | -37 | W1 |
9 Orioles | 75 | 78 | .490 | 18.5 | -26 | W3 |
10 Tigers | 72 | 81 | .471 | 21.5 | +74 | L2 |
11 Mariners | 71 | 82 | .464 | 22.5 | -56 | W1 |
12 Twins | 71 | 82 | .464 | 22.5 | -74 | L1 |
| 13Royals | 67 | 86 | .438 | 26.5 | -97 | L1 |
14 Athletics | 61 | 92 | .399 | 32.5 | -214 | L3 |
15 Angels | 59 | 94 | .386 | 34.5 | -77 | W1 |
National League
| Team | W | L | PCT | GB | DIFF | STRK |
|---|---|---|---|---|---|---|
1 Brewers | 95 | 58 | .621 | - | +197 | L1 |
2 Dodgers | 93 | 60 | .608 | 2 | +179 | W1 |
3 Braves | 89 | 64 | .582 | 6 | +111 | L1 |
4 Cubs | 85 | 68 | .556 | 10 | +143 | W1 |
5 Phillies | 85 | 68 | .556 | 10 | +34 | W2 |
6 Padres | 84 | 69 | .549 | 11 | +30 | W2 |
| 7Diamondbacks | 80 | 73 | .523 | 15 | 0 | L2 |
8 Marlins | 76 | 77 | .497 | 19 | +8 | W2 |
9 Pirates | 76 | 77 | .497 | 19 | +24 | W1 |
10 Cardinals | 75 | 78 | .490 | 20 | -14 | L2 |
11 Nationals | 71 | 82 | .464 | 24 | +3 | L1 |
12 Reds | 71 | 82 | .464 | 24 | -154 | L1 |
13 Mets | 69 | 84 | .451 | 26 | -46 | L5 |
14 Giants | 64 | 89 | .418 | 31 | -70 | W2 |
15 Rockies | 56 | 97 | .366 | 39 | -177 | L2 |
BOS
VS
TEX
Pitchers
Sonny Gray
Catchers
Adley Rutschman
Infielders
Willson Contreras
Trevor Story
Caleb Durbin
Nick Sogard
Outfielders
Roman Anthony
Wilyer Abreu
Jarren Duran
Designated Hitters
Jahmai Jones
Pitchers
Tyler Alexander
Catchers
Danny Jansen
Infielders
Ezequiel Duran
Corey Seager
Jake Burger
Nicky Lopez
Outfielders
Brandon Nimmo
Wyatt Langford
Evan Carter
Designated Hitters
Josh Jung
Red Sox
VS
Rangers
Batting
153
Team Games Played
153
5127
At Bats
5081
1263
Hits
1237
642
Runs Batted In
617
158
Home Runs
174
103
Stolen Bases
73
.246
Batting Average
.243
672
Runs
638
272
Doubles
223
24
Triples
22
2057
Total Bases
2026
491
Walks
497
1242
Strikeouts
1306
.321
On Base Percentage
.318
.401
Slugging Percentage
.399
.722
OBP Pct + SLG Pct
.716
153
Games Played
153
153
Games Started
153
93
Hit By Pitch
71
0.0
Wins Above Replacement
0.0
0.0
Offensive Wins Above Replacement
0.0
38
Caught Stealing
21
1
Is Qualified
1
677.0
Runs Created
651.3
4.5
Runs Created Per 27 Outs
4.4
.085
Walks Per Plate Appearance
.087
0.40
Walk To Strikeout Ratio
0.38
.155
Isolated Power
.155
.263
Secondary Average
.263
3.84
Pitches Per Plate Appearance
3.87
454
Extra Base Hits
419
5793
Plate Appearances
5719
32.4
At Bats Per Home Run
29.2
32
Sacrifice Hit
37
46
Sacrifice Flies
32
Pitching
153
Team Games Played
153
62
Quality Starts
49
83
Wins
76
70
Losses
77
43
Saves
42
90
Holds
79
1242
Hits
1280
545
Earned runs
640
148
Home Runs
183
442
Walks
466
1324
Strikeouts
1281
8.8
Strikeouts Per 9 Innings
8.6
140.7
Pitches Per Start
145.2
1.24
Walks Plus Hits Per Inning Pitched
1.30
3.61
Earned Run Average
4.30
70
Losses
77
1360.1
Innings pitched
1340.1
.542
Win Percentage
.497
57
Save Opportunities
61
.242
Opponent Batting Average
.248
.308
Opponent's On-base pct.
.316
.379
Opponent's Slugging pct.
.410
.687
Opponent's OPB Pct + SLG Pct
.727
5125
At Bats
5160
240
Doubles
243
9
Triples
23
61
Batters Hit
65
106
Stolen Bases
93
153
Games Played
153
0
Complete Games
0
16
Shutouts
13
31
Wild Pitches
43
564
Runs Batted In
657
3
Balks
2
1360.1
Innings pitched
1340.1
8.8
Strikeouts Per 9 Innings
8.6
21
Caught Stealing
24
153
Games Started
153
0.0
Wins Above Replacement
0.0
1
Is Qualified
1
589
Runs
677
545
Earned Runs
640
1944
Total Bases
2118
Fielding
153
Team Games Played
153
1360
Full Innings
1340
5489
Total Chances
5280
4081
Putouts
4021
1331
Assists
1193
77
Errors
66
272
Double Plays
223
0.986
Fielding Percentage
0.988
35.8
Range Factor
35.0
0.0
Zone Rating
0.0
153
Games Played
153
0
Games Started
0
0.0
Defensive Wins Above Replacement
0.0
1
Qualified
1