

Red Sox vs Rays Live Score (18 Sep, 2026)
Game Information
Stage
STD
Season
2026
First Pitch
Fri, Sep 18, 7:10 pm
Venue
Tropicana Field
Location
St. Petersburg, Florida
Venue Type
Indoor
Broadcast
ESPN Unlmtd
Attendance
23,342
Live Situation
3Balls
2Strikes
0Outs
—Pitcher
—At Bat
Pitch Sequence
1
BALL
Sinker
97 MPH
2
STRIKE FOUL
Sinker
97 MPH
3
STRIKE LOOKING
Sinker
97 MPH
4
BALL
Slider
86 MPH
5
BALL
Sinker
98 MPH
6
BALL IN PLAY
Sinker
97 MPH
Injury Report





Team Stats
 BOS
TB


4
Runs
2
9
Hits
5
0
Errors
1
2
Home Runs
0
2
Walks
9
11
Strikeouts
9
Player Box Score
Boston Red Sox
| Player | H-AB | AB | R | H | RBI | HR | BB | K | #P | AVG | OBP | SLG |
|---|---|---|---|---|---|---|---|---|---|---|---|---|
 Roman Anthony | 2-5 | 5 | 1 | 2 | 3 | 1 | 0 | 1 | 18 | .235 | .335 | .374 |
 Nick Sogard | 0-5 | 5 | 0 | 0 | 0 | 0 | 0 | 2 | 18 | .255 | .347 | .399 |
 Jahmai Jones | 1-3 | 3 | 1 | 1 | 1 | 1 | 0 | 1 | 10 | .211 | .305 | .388 |
 Mickey Gasper | 1-2 | 2 | 0 | 1 | 0 | 0 | 0 | 0 | 7 | .266 | .373 | .480 |
 Wilyer Abreu | 0-5 | 5 | 0 | 0 | 0 | 0 | 0 | 3 | 21 | .252 | .331 | .455 |
 Trevor Story | 1-3 | 3 | 1 | 1 | 0 | 0 | 1 | 0 | 16 | .247 | .279 | .359 |
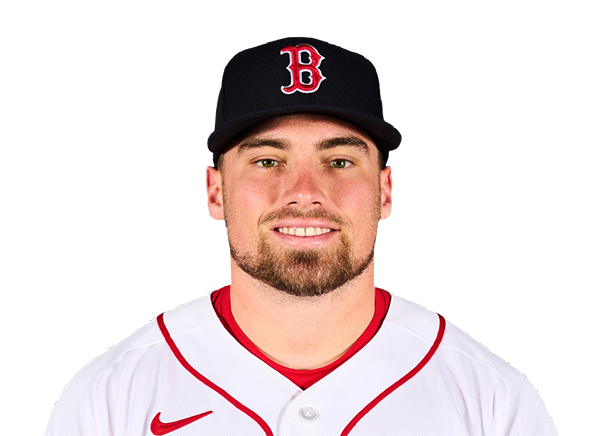 Caleb Durbin | 2-3 | 3 | 1 | 2 | 0 | 0 | 0 | 0 | 12 | .251 | .336 | .383 |
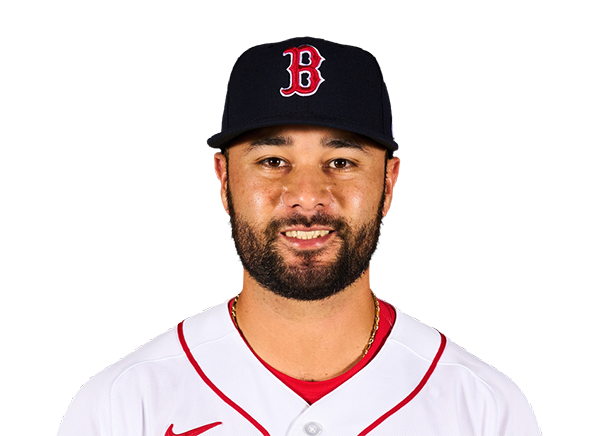 Isiah Kiner-Falefa | 0-3 | 3 | 0 | 0 | 0 | 0 | 0 | 2 | 12 | .257 | .331 | .333 |
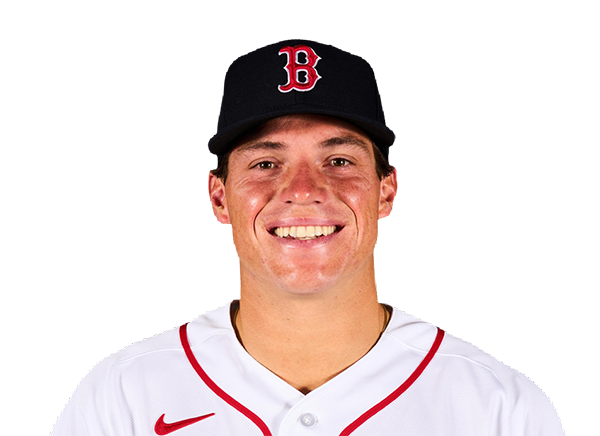 Nate Eaton | 1-3 | 3 | 0 | 1 | 0 | 0 | 1 | 0 | 17 | .140 | .288 | .256 |
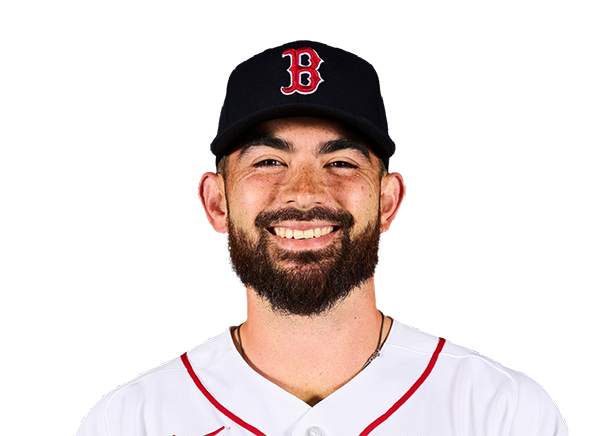 Connor Wong | 1-4 | 4 | 0 | 1 | 0 | 0 | 0 | 2 | 11 | .234 | .310 | .346 |
Tampa Bay Rays
| Player | H-AB | AB | R | H | RBI | HR | BB | K | #P | AVG | OBP | SLG |
|---|---|---|---|---|---|---|---|---|---|---|---|---|
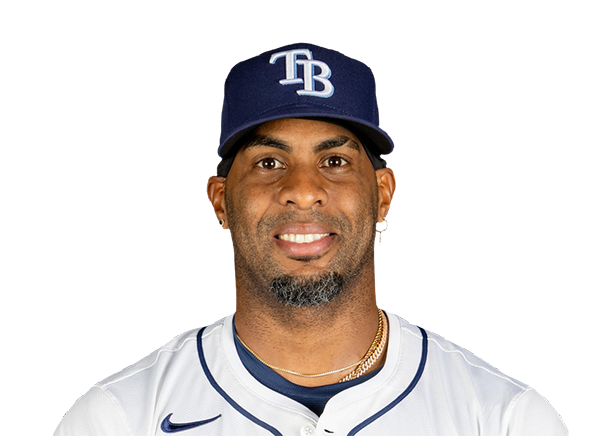 Yandy Diaz | 0-3 | 3 | 1 | 0 | 0 | 0 | 2 | 1 | 26 | .293 | .359 | .451 |
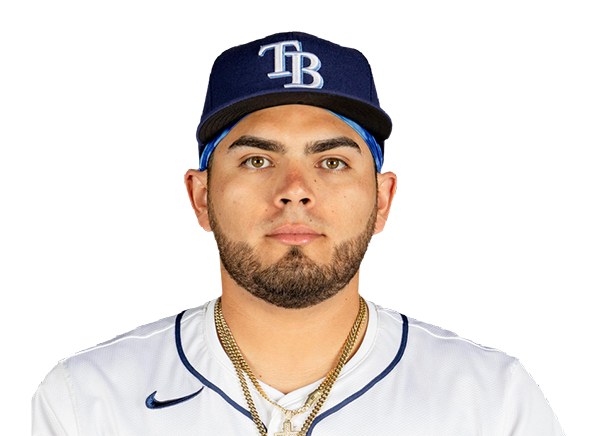 Jonathan Aranda | 1-5 | 5 | 0 | 1 | 1 | 0 | 0 | 0 | 23 | .277 | .360 | .436 |
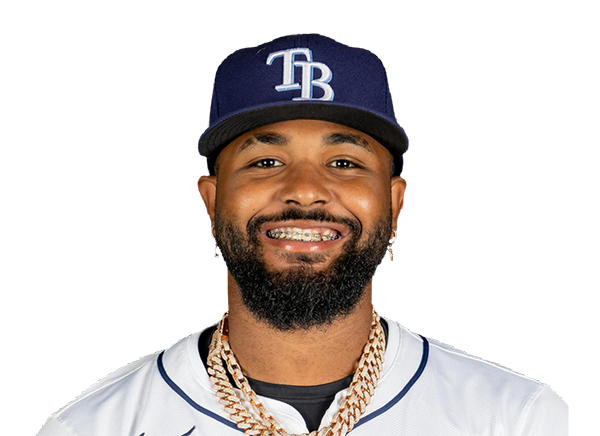 Junior Caminero | 1-3 | 3 | 0 | 1 | 1 | 0 | 2 | 1 | 23 | .277 | .365 | .533 |
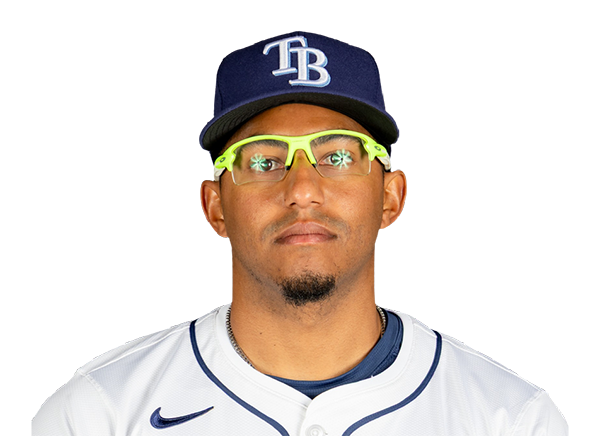 Richie Palacios | 0-0 | 0 | 0 | 0 | 0 | 0 | 0 | 0 | 0 | .234 | .331 | .378 |
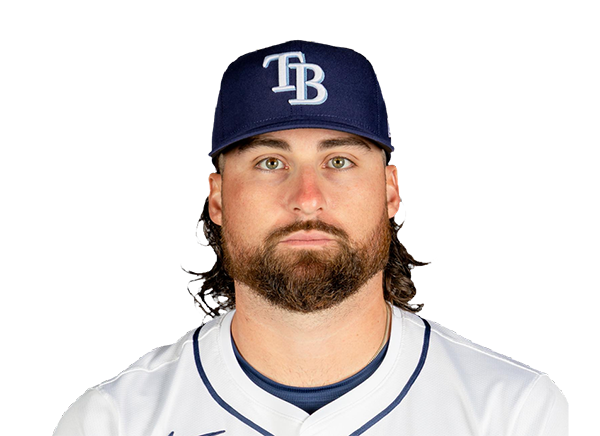 Ryan Vilade | 1-4 | 4 | 0 | 1 | 0 | 0 | 1 | 2 | 20 | .259 | .332 | .460 |
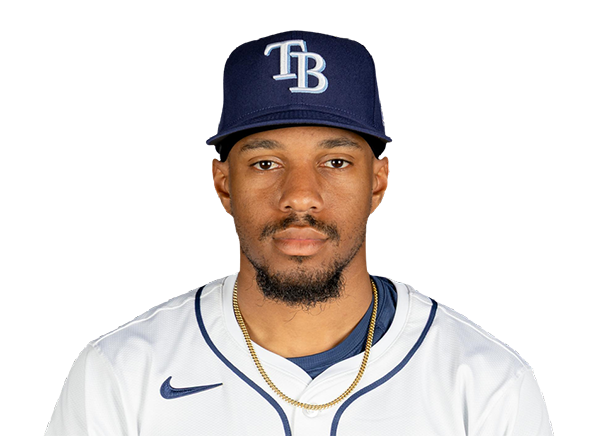 Chandler Simpson | 0-5 | 5 | 0 | 0 | 0 | 0 | 0 | 0 | 22 | .308 | .336 | .359 |
 Jonny DeLuca | 0-4 | 4 | 0 | 0 | 0 | 0 | 0 | 2 | 12 | .260 | .291 | .411 |
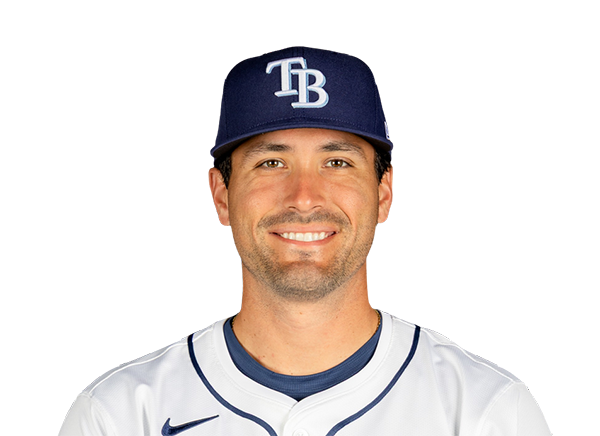 Nick Fortes | 1-1 | 1 | 0 | 1 | 0 | 0 | 1 | 0 | 8 | .267 | .315 | .381 |
 Liam Hicks | 0-1 | 1 | 0 | 0 | 0 | 0 | 1 | 0 | 9 | .285 | .369 | .439 |
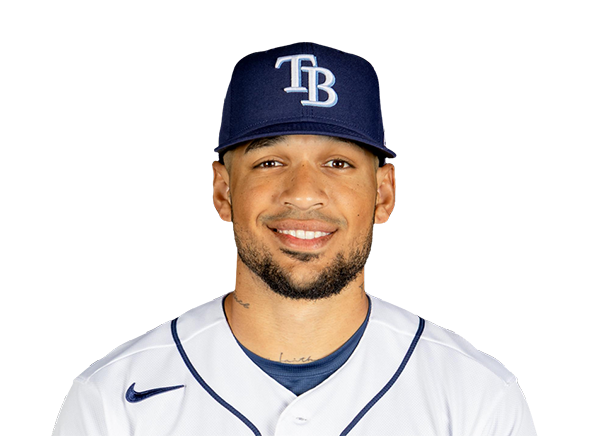 Victor Mesa Jr. | 1-3 | 3 | 1 | 1 | 0 | 0 | 1 | 1 | 15 | .254 | .323 | .498 |
 Taylor Walls | 0-1 | 1 | 0 | 0 | 0 | 0 | 1 | 0 | 8 | .218 | .307 | .292 |
 Jake Fraley | 0-1 | 1 | 0 | 0 | 0 | 0 | 0 | 1 | 6 | .226 | .301 | .381 |
 Jorge Mateo | 0-1 | 1 | 0 | 0 | 0 | 0 | 0 | 1 | 3 | .209 | .255 | .325 |
Boston Red Sox
| Player | IP | H | R | ER | BB | K | HR | PC-ST | ERA | PC |
|---|---|---|---|---|---|---|---|---|---|---|
 Ranger Suarez | 5.2 | 3 | 1 | 1 | 5 | 5 | 0 | 98-56 | 3.27 | 98 |
 Wyatt Olds | 0.1 | 0 | 0 | 0 | 2 | 1 | 0 | 18-7 | 1.20 | 18 |
 Greg Weissert | 2.0 | 1 | 0 | 0 | 0 | 1 | 0 | 27-19 | 3.34 | 27 |
 Erik Miller | 1.0 | 1 | 1 | 1 | 2 | 2 | 0 | 32-17 | 2.92 | 32 |
Tampa Bay Rays
| Player | IP | H | R | ER | BB | K | HR | PC-ST | ERA | PC |
|---|---|---|---|---|---|---|---|---|---|---|
 Ian Seymour | 5.0 | 7 | 4 | 4 | 2 | 5 | 2 | 87-59 | 4.38 | 87 |
 Ty Johnson | 1.0 | 0 | 0 | 0 | 0 | 1 | 0 | 13-8 | 4.50 | 13 |
 Casey Legumina | 2.0 | 2 | 0 | 0 | 0 | 4 | 0 | 29-21 | 3.89 | 29 |
 Alexander Cook | 1.0 | 0 | 0 | 0 | 0 | 1 | 0 | 13-10 | 4.76 | 13 |
H2H / Season Series
TB2–4
BOS
BOS6–1
TB
BOS7–6
TB
BOS5–3
TB
BOS10–0
TB
TB7–5
BOS
TB4–3
BOS
TB3–1
BOS
BOS1–4
TB
BOS2–0
TB
Last 5 Games
| Date | Opponent | Result |
|---|---|---|
| Sep 18 | @ TB | W4–2 |
| Sep 17 |  @ TEX | W4–3 |
| Sep 16 | @ TEX | L3–7 |
| Sep 15 | @ TEX | L2–4 |
| Sep 13 |  vs KC | W4–1 |
| Date | Opponent | Result |
|---|---|---|
| Sep 18 | vs BOS | L2–4 |
| Sep 17 |  vs ATH | W10–1 |
| Sep 16 | vs ATH | W4–3 |
| Sep 15 | vs ATH | W2–1 |
| Sep 13 |  vs HOU | W14–4 |
Standings
American League
| Team | W | L | PCT | GB | DIFF | STRK |
|---|---|---|---|---|---|---|
| 1Rays | 93 | 60 | .608 | - | +78 | L1 |
2 Guardians | 79 | 75 | .513 | 14.5 | -5 | W3 |
| 3Astros | 77 | 77 | .500 | 16.5 | -54 | L1 |
4 Yankees | 89 | 64 | .582 | 4 | +143 | W1 |
| 5Red Sox | 84 | 70 | .545 | 9.5 | +85 | W2 |
6 White Sox | 78 | 76 | .506 | 15.5 | +33 | L1 |
| 7Rangers | 77 | 77 | .500 | 16.5 | -33 | W1 |
8 Blue Jays | 76 | 78 | .494 | 17.5 | -43 | L1 |
9 Orioles | 75 | 79 | .487 | 18.5 | -27 | L1 |
10 Tigers | 73 | 81 | .474 | 20.5 | +77 | W1 |
11 Mariners | 72 | 82 | .468 | 21.5 | -55 | W2 |
12 Twins | 72 | 82 | .468 | 21.5 | -71 | W1 |
| 13Royals | 67 | 87 | .435 | 26.5 | -100 | L2 |
| 14Athletics | 61 | 93 | .396 | 32.5 | -216 | L4 |
15 Angels | 59 | 95 | .383 | 34.5 | -80 | L1 |
National League
| Team | W | L | PCT | GB | DIFF | STRK |
|---|---|---|---|---|---|---|
1 Brewers | 96 | 58 | .623 | - | +198 | W1 |
2 Dodgers | 94 | 60 | .610 | 2 | +185 | W2 |
3 Braves | 90 | 64 | .584 | 6 | +115 | W1 |
4 Phillies | 85 | 69 | .552 | 11 | +31 | L1 |
5 Cubs | 85 | 69 | .552 | 11 | +141 | L1 |
6 Padres | 85 | 69 | .552 | 11 | +36 | W3 |
7 Diamondbacks | 80 | 74 | .519 | 16 | -7 | L3 |
8 Pirates | 77 | 77 | .500 | 19 | +27 | W2 |
9 Marlins | 76 | 78 | .494 | 20 | +2 | L1 |
10 Cardinals | 75 | 79 | .487 | 21 | -22 | L3 |
11 Nationals | 72 | 82 | .468 | 24 | +11 | W1 |
12 Reds | 72 | 82 | .468 | 24 | -152 | W1 |
13 Mets | 70 | 84 | .455 | 26 | -43 | W1 |
14 Giants | 64 | 90 | .416 | 32 | -76 | L1 |
15 Rockies | 56 | 98 | .364 | 40 | -178 | L3 |
BOS
VS
TB
Pitchers
Ranger Suarez
Catchers
Connor Wong
Infielders
Nick Sogard
Trevor Story
Caleb Durbin
Isiah Kiner-Falefa
Outfielders
Roman Anthony
Wilyer Abreu
Nate Eaton
Designated Hitters
Jahmai Jones
Pitchers
Ian Seymour
Catchers
Nick Fortes
Infielders
Jonathan Aranda
Junior Caminero
Ryan Vilade
Taylor Walls
Outfielders
Chandler Simpson
Jonny DeLuca
Victor Mesa Jr.
Designated Hitters
Yandy Diaz
Red Sox
VS
Rays
Batting
154
Team Games Played
153
5163
At Bats
5136
1272
Hits
1333
646
Runs Batted In
665
160
Home Runs
162
103
Stolen Bases
157
.246
Batting Average
.260
676
Runs
700
272
Doubles
216
24
Triples
22
2072
Total Bases
2079
493
Walks
493
1253
Strikeouts
1066
.321
On Base Percentage
.329
.401
Slugging Percentage
.405
.722
OBP Pct + SLG Pct
.734
154
Games Played
153
154
Games Started
153
94
Hit By Pitch
57
0.0
Wins Above Replacement
0.0
0.0
Offensive Wins Above Replacement
0.0
38
Caught Stealing
52
1
Is Qualified
1
681.8
Runs Created
697.6
4.5
Runs Created Per 27 Outs
4.7
.085
Walks Per Plate Appearance
.085
0.39
Walk To Strikeout Ratio
0.46
.155
Isolated Power
.145
.263
Secondary Average
.262
3.84
Pitches Per Plate Appearance
3.76
456
Extra Base Hits
400
5833
Plate Appearances
5776
32.3
At Bats Per Home Run
31.7
33
Sacrifice Hit
45
46
Sacrifice Flies
42
Pitching
154
Team Games Played
153
62
Quality Starts
52
84
Wins
93
70
Losses
60
44
Saves
57
92
Holds
111
1247
Hits
1171
547
Earned runs
567
148
Home Runs
191
451
Walks
381
1333
Strikeouts
1243
8.8
Strikeouts Per 9 Innings
8.2
140.9
Pitches Per Start
139.0
1.24
Walks Plus Hits Per Inning Pitched
1.14
3.60
Earned Run Average
3.74
70
Losses
60
1369.1
Innings pitched
1366.0
.545
Win Percentage
.608
58
Save Opportunities
75
.242
Opponent Batting Average
.229
.308
Opponent's On-base pct.
.287
.379
Opponent's Slugging pct.
.390
.687
Opponent's OPB Pct + SLG Pct
.677
5157
At Bats
5117
243
Doubles
221
9
Triples
16
61
Batters Hit
52
107
Stolen Bases
122
154
Games Played
153
0
Complete Games
1
16
Shutouts
12
35
Wild Pitches
38
566
Runs Batted In
593
3
Balks
3
1369.1
Innings pitched
1366.0
8.8
Strikeouts Per 9 Innings
8.2
21
Caught Stealing
33
154
Games Started
153
0.0
Wins Above Replacement
0.0
1
Is Qualified
1
591
Runs
622
547
Earned Runs
567
1952
Total Bases
1997
Fielding
154
Team Games Played
153
1369
Full Innings
1366
5525
Total Chances
5395
4108
Putouts
4098
1340
Assists
1208
77
Errors
89
272
Double Plays
216
0.986
Fielding Percentage
0.984
35.8
Range Factor
35.0
0.0
Zone Rating
0.0
154
Games Played
153
0
Games Started
0
0.0
Defensive Wins Above Replacement
0.0
1
Qualified
1