

Red Sox vs Rays Live Score (20 Sep, 2026)
Game Information
Stage
STD
Season
2026
First Pitch
Sun, Sep 20, 1:40 pm
Venue
Tropicana Field
Location
St. Petersburg, Florida
Venue Type
Indoor
Broadcast
ESPN Unlmtd
Attendance
24,654
Live Situation
3Balls
2Strikes
0Outs
—Pitcher
—At Bat
Pitch Sequence
1
STRIKE SWINGING
Changeup
84 MPH
2
BALL
Changeup
82 MPH
3
STRIKE SWINGING
Four-seam FB
93 MPH
4
BALL
Changeup
86 MPH
5
BALL
Four-seam FB
93 MPH
6
BALL IN PLAY
Sinker
91 MPH
Injury Report





Team Stats
 BOS
TB


1
Runs
5
6
Hits
4
0
Errors
0
1
Home Runs
1
2
Walks
2
9
Strikeouts
7
Player Box Score
Boston Red Sox
| Player | H-AB | AB | R | H | RBI | HR | BB | K | #P | AVG | OBP | SLG |
|---|---|---|---|---|---|---|---|---|---|---|---|---|
 Roman Anthony | 2-4 | 4 | 0 | 2 | 0 | 0 | 0 | 1 | 9 | .241 | .336 | .385 |
 Mickey Gasper | 0-3 | 3 | 0 | 0 | 0 | 0 | 0 | 2 | 11 | .255 | .361 | .462 |
 Jahmai Jones | 0-1 | 1 | 0 | 0 | 0 | 0 | 0 | 1 | 4 | .209 | .304 | .385 |
 Adley Rutschman | 1-4 | 4 | 0 | 1 | 0 | 0 | 0 | 1 | 16 | .234 | .309 | .413 |
 Trevor Story | 1-4 | 4 | 1 | 1 | 1 | 1 | 0 | 1 | 16 | .247 | .278 | .368 |
 Nick Sogard | 0-4 | 4 | 0 | 0 | 0 | 0 | 0 | 2 | 16 | .250 | .340 | .389 |
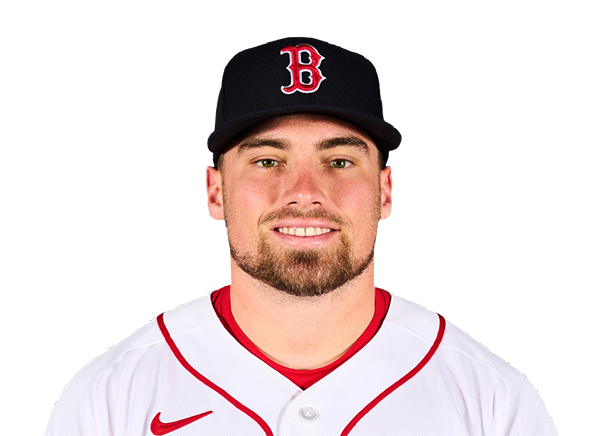 Caleb Durbin | 2-4 | 4 | 0 | 2 | 0 | 0 | 0 | 1 | 18 | .255 | .338 | .389 |
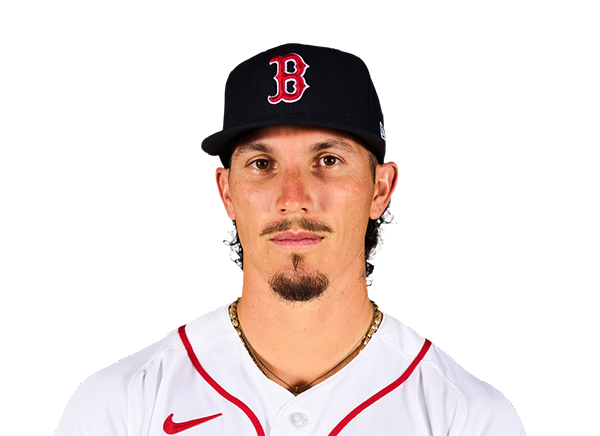 Jarren Duran | 0-3 | 3 | 0 | 0 | 0 | 0 | 1 | 0 | 17 | .204 | .261 | .362 |
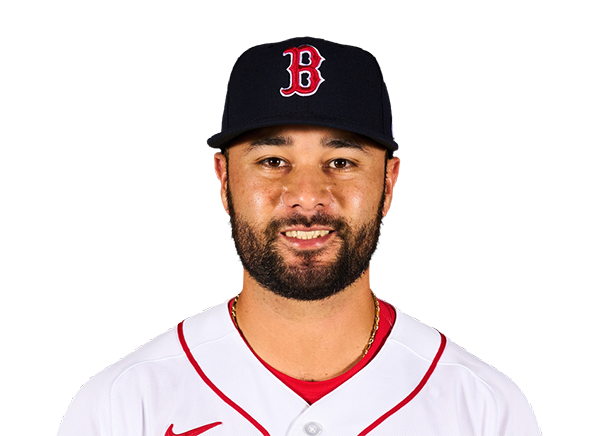 Isiah Kiner-Falefa | 0-3 | 3 | 0 | 0 | 0 | 0 | 0 | 0 | 9 | .247 | .319 | .320 |
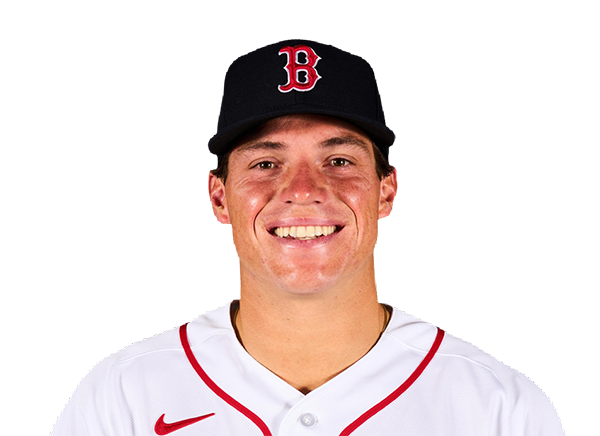 Nate Eaton | 0-2 | 2 | 0 | 0 | 0 | 0 | 1 | 0 | 16 | .133 | .291 | .244 |
Tampa Bay Rays
| Player | H-AB | AB | R | H | RBI | HR | BB | K | #P | AVG | OBP | SLG |
|---|---|---|---|---|---|---|---|---|---|---|---|---|
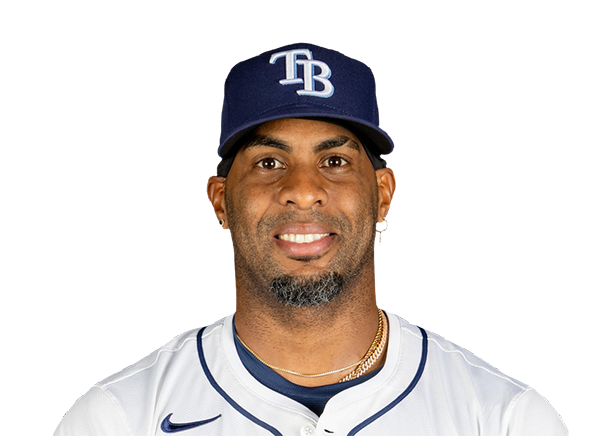 Yandy Diaz | 0-3 | 3 | 1 | 0 | 0 | 0 | 1 | 0 | 14 | .292 | .358 | .449 |
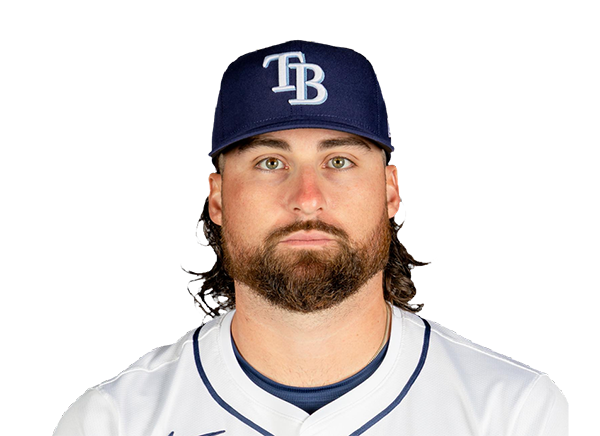 Ryan Vilade | 0-3 | 3 | 1 | 0 | 0 | 0 | 0 | 1 | 18 | .256 | .331 | .454 |
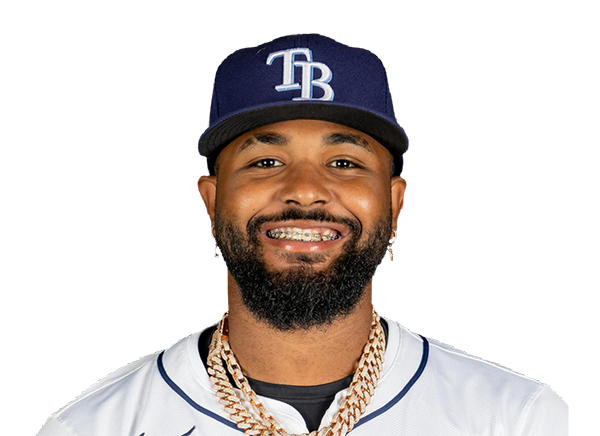 Junior Caminero | 1-4 | 4 | 1 | 1 | 0 | 0 | 0 | 1 | 11 | .277 | .363 | .529 |
 Jonny DeLuca | 1-4 | 4 | 1 | 1 | 2 | 0 | 0 | 2 | 18 | .259 | .290 | .410 |
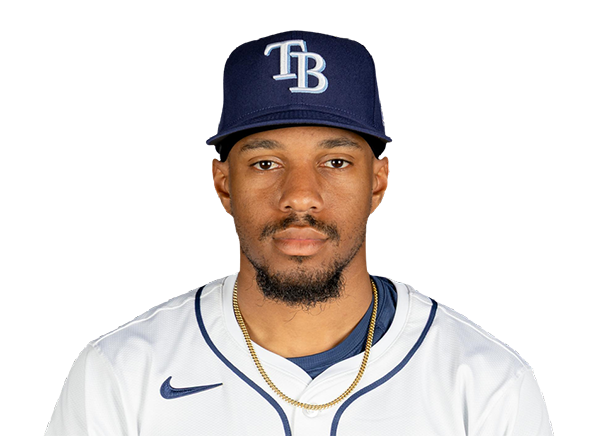 Chandler Simpson | 1-3 | 3 | 0 | 1 | 2 | 0 | 0 | 0 | 5 | .309 | .337 | .360 |
 Ben Williamson | 0-3 | 3 | 0 | 0 | 0 | 0 | 0 | 0 | 10 | .244 | .305 | .328 |
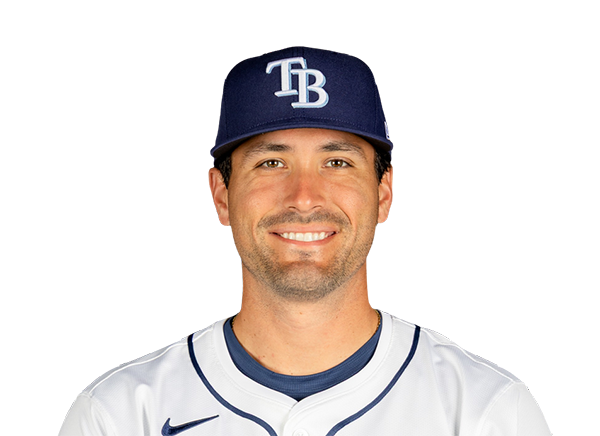 Nick Fortes | 0-3 | 3 | 0 | 0 | 0 | 0 | 0 | 2 | 8 | .264 | .311 | .377 |
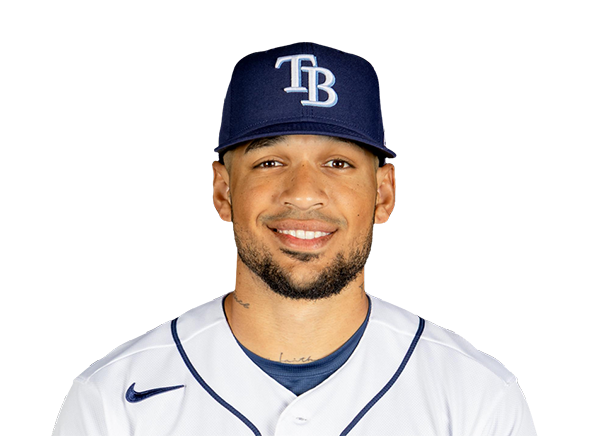 Victor Mesa Jr. | 1-2 | 2 | 1 | 1 | 1 | 1 | 1 | 0 | 16 | .251 | .322 | .502 |
 Taylor Walls | 0-3 | 3 | 0 | 0 | 0 | 0 | 0 | 1 | 6 | .216 | .304 | .289 |
Boston Red Sox
| Player | IP | H | R | ER | BB | K | HR | PC-ST | ERA | PC |
|---|---|---|---|---|---|---|---|---|---|---|
 Patrick Sandoval | 7.0 | 4 | 5 | 5 | 2 | 5 | 1 | 94-69 | 5.15 | 94 |
 Tyron Guerrero | 1.0 | 0 | 0 | 0 | 0 | 2 | 0 | 12-9 | 3.18 | 12 |
Tampa Bay Rays
| Player | IP | H | R | ER | BB | K | HR | PC-ST | ERA | PC |
|---|---|---|---|---|---|---|---|---|---|---|
 Griffin Jax | 5.0 | 3 | 0 | 0 | 2 | 5 | 0 | 74-47 | 3.62 | 74 |
 Cole Sulser | 1.0 | 0 | 0 | 0 | 0 | 0 | 0 | 11-7 | 4.39 | 11 |
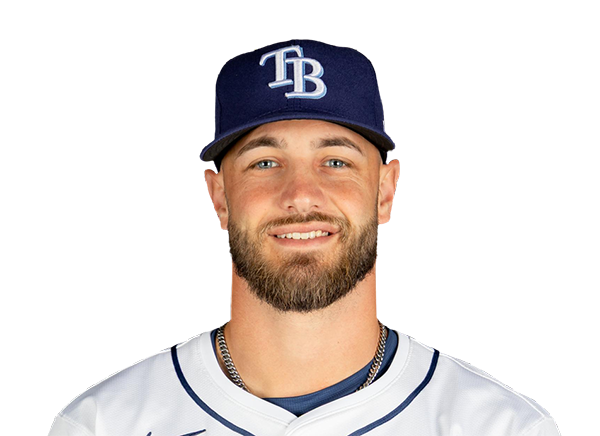 Brody Hopkins | 1.0 | 0 | 0 | 0 | 0 | 2 | 0 | 14-10 | 6.00 | 14 |
 Steven Matz | 1.0 | 1 | 0 | 0 | 0 | 1 | 0 | 14-9 | 5.49 | 14 |
 Ty Johnson | 0.2 | 2 | 1 | 1 | 0 | 1 | 1 | 13-9 | 5.79 | 13 |
 Kevin Kelly | 0.1 | 0 | 0 | 0 | 0 | 0 | 0 | 6-3 | 2.49 | 6 |
H2H / Season Series
TB5–1
BOS
TB2–1
BOS
TB2–4
BOS
BOS6–1
TB
BOS7–6
TB
BOS5–3
TB
BOS10–0
TB
TB7–5
BOS
TB4–3
BOS
TB3–1
BOS
Last 5 Games
| Date | Opponent | Result |
|---|---|---|
| Sep 20 | @ TB | L1–5 |
| Sep 19 | @ TB | L1–2 |
| Sep 18 | @ TB | W4–2 |
| Sep 17 |  @ TEX | W4–3 |
| Sep 16 | @ TEX | L3–7 |
| Date | Opponent | Result |
|---|---|---|
| Sep 20 | vs BOS | W5–1 |
| Sep 19 | vs BOS | W2–1 |
| Sep 18 | vs BOS | L2–4 |
| Sep 17 |  vs ATH | W10–1 |
| Sep 16 | vs ATH | W4–3 |
Standings
American League
| Team | W | L | PCT | GB | DIFF | STRK |
|---|---|---|---|---|---|---|
| 1Rays | 95 | 60 | .613 | - | +83 | W2 |
2 Guardians | 81 | 75 | .519 | 14.5 | +2 | W5 |
| 3Rangers | 78 | 78 | .500 | 17.5 | -34 | L1 |
4 Yankees | 89 | 66 | .574 | 6 | +137 | L2 |
| 5Red Sox | 84 | 72 | .538 | 11.5 | +80 | L2 |
6 White Sox | 80 | 76 | .513 | 15.5 | +42 | W2 |
7 Astros | 77 | 79 | .494 | 18.5 | -59 | L3 |
8 Blue Jays | 77 | 79 | .494 | 18.5 | -42 | W1 |
9 Orioles | 75 | 81 | .481 | 20.5 | -31 | L3 |
10 Mariners | 73 | 83 | .468 | 22.5 | -56 | W1 |
11 Twins | 73 | 83 | .468 | 22.5 | -64 | W1 |
12 Tigers | 73 | 83 | .468 | 22.5 | +68 | L2 |
13 Royals | 67 | 89 | .429 | 28.5 | -102 | L4 |
| 14Athletics | 61 | 95 | .391 | 34.5 | -223 | L6 |
15 Angels | 60 | 96 | .385 | 35.5 | -87 | L1 |
National League
| Team | W | L | PCT | GB | DIFF | STRK |
|---|---|---|---|---|---|---|
1 Brewers | 98 | 58 | .628 | - | +202 | W3 |
2 Dodgers | 96 | 60 | .615 | 2 | +193 | W4 |
3 Braves | 92 | 64 | .590 | 6 | +120 | W3 |
4 Cubs | 87 | 69 | .558 | 11 | +152 | W2 |
5 Padres | 87 | 69 | .558 | 11 | +41 | W5 |
6 Phillies | 86 | 70 | .551 | 12 | +29 | W1 |
7 Diamondbacks | 82 | 74 | .526 | 16 | -1 | W2 |
8 Pirates | 79 | 77 | .506 | 19 | +29 | W4 |
9 Marlins | 76 | 80 | .487 | 22 | -3 | L3 |
10 Cardinals | 76 | 80 | .487 | 22 | -23 | W1 |
11 Nationals | 73 | 83 | .468 | 25 | +12 | L1 |
12 Reds | 72 | 84 | .462 | 26 | -163 | L2 |
13 Mets | 71 | 85 | .455 | 27 | -41 | L1 |
14 Giants | 64 | 92 | .410 | 34 | -84 | L3 |
15 Rockies | 57 | 99 | .365 | 41 | -177 | L1 |
BOS
VS
TB
Pitchers
Patrick Sandoval
Catchers
Adley Rutschman
Infielders
Trevor Story
Nick Sogard
Caleb Durbin
Isiah Kiner-Falefa
Outfielders
Roman Anthony
Jarren Duran
Nate Eaton
Designated Hitters
Mickey Gasper
Pitchers
Griffin Jax
Catchers
Nick Fortes
Infielders
Ryan Vilade
Junior Caminero
Ben Williamson
Taylor Walls
Outfielders
Jonny DeLuca
Chandler Simpson
Victor Mesa Jr.
Designated Hitters
Yandy Diaz
Red Sox
VS
Rays
Batting
156
Team Games Played
155
5227
At Bats
5198
1286
Hits
1345
648
Runs Batted In
672
161
Home Runs
164
103
Stolen Bases
159
.246
Batting Average
.259
678
Runs
707
277
Doubles
217
25
Triples
22
2096
Total Bases
2098
497
Walks
495
1271
Strikeouts
1085
.320
On Base Percentage
.328
.401
Slugging Percentage
.404
.721
OBP Pct + SLG Pct
.731
156
Games Played
155
156
Games Started
155
94
Hit By Pitch
58
0.0
Wins Above Replacement
0.0
0.0
Offensive Wins Above Replacement
0.0
39
Caught Stealing
53
1
Is Qualified
1
687.6
Runs Created
701.7
4.5
Runs Created Per 27 Outs
4.6
.084
Walks Per Plate Appearance
.085
0.39
Walk To Strikeout Ratio
0.46
.155
Isolated Power
.145
.262
Secondary Average
.260
3.84
Pitches Per Plate Appearance
3.76
463
Extra Base Hits
403
5903
Plate Appearances
5841
32.5
At Bats Per Home Run
31.7
35
Sacrifice Hit
45
46
Sacrifice Flies
42
Pitching
156
Team Games Played
155
63
Quality Starts
52
84
Wins
95
72
Losses
60
44
Saves
57
92
Holds
111
1259
Hits
1185
553
Earned runs
569
150
Home Runs
192
453
Walks
385
1352
Strikeouts
1261
8.8
Strikeouts Per 9 Innings
8.2
140.5
Pitches Per Start
139.0
1.24
Walks Plus Hits Per Inning Pitched
1.13
3.59
Earned Run Average
3.70
72
Losses
60
1386.0
Innings pitched
1384.0
.538
Win Percentage
.613
58
Save Opportunities
75
.241
Opponent Batting Average
.229
.307
Opponent's On-base pct.
.286
.378
Opponent's Slugging pct.
.390
.685
Opponent's OPB Pct + SLG Pct
.676
5219
At Bats
5181
244
Doubles
226
9
Triples
17
62
Batters Hit
52
109
Stolen Bases
122
156
Games Played
155
0
Complete Games
1
16
Shutouts
12
35
Wild Pitches
38
573
Runs Batted In
595
3
Balks
3
1386.0
Innings pitched
1384.0
8.8
Strikeouts Per 9 Innings
8.2
22
Caught Stealing
34
156
Games Started
155
0.0
Wins Above Replacement
0.0
1
Is Qualified
1
598
Runs
624
553
Earned Runs
569
1971
Total Bases
2021
Fielding
156
Team Games Played
155
1386
Full Innings
1384
5598
Total Chances
5469
4158
Putouts
4152
1361
Assists
1228
79
Errors
89
277
Double Plays
217
0.986
Fielding Percentage
0.984
35.8
Range Factor
35.0
0.0
Zone Rating
0.0
156
Games Played
155
0
Games Started
0
0.0
Defensive Wins Above Replacement
0.0
1
Qualified
1