

Red Sox vs Twins Live Score (21 Feb, 2026)
Game Information
Stage
EXH
Season
2026
First Pitch
Sat, Feb 21, 1:05 pm
Venue
Lee Health Sports Complex
Location
Fort Myers, Florida
Venue Type
Outdoor
Broadcast
MLB.TV
Attendance
7,638
Live Situation
0Balls
2Strikes
0Outs
—Pitcher
—At Bat
Pitch Sequence
1
STRIKE LOOKING
Cutter
84 MPH
2
STRIKE FOUL
Changeup
79 MPH
3
STRIKE FOUL
Four-seam FB
89 MPH
4
BALL IN PLAY
Slider
76 MPH
Injury Report
Team Stats
 BOS
MIN


7
Runs
2
9
Hits
5
0
Errors
4
1
Home Runs
1
4
Walks
0
7
Strikeouts
8
Player Box Score
Boston Red Sox
| Player | H-AB | AB | R | H | RBI | HR | BB | K | #P | AVG | OBP | SLG |
|---|---|---|---|---|---|---|---|---|---|---|---|---|
 Roman Anthony | 0-3 | 3 | 0 | 0 | 0 | 0 | 0 | 2 | 0 | .000 | .000 | .000 |
 Allan Castro | 1-2 | 2 | 1 | 1 | 2 | 0 | 0 | 0 | 0 | .500 | .500 | .500 |
 Ceddanne Rafaela | 0-2 | 2 | 0 | 0 | 0 | 0 | 0 | 2 | 0 | .000 | .333 | .000 |
 Nathan Hickey | 0-1 | 1 | 1 | 0 | 0 | 0 | 1 | 0 | 0 | .000 | .500 | .000 |
 Wilyer Abreu | 0-3 | 3 | 0 | 0 | 0 | 0 | 0 | 1 | 0 | .000 | .000 | .000 |
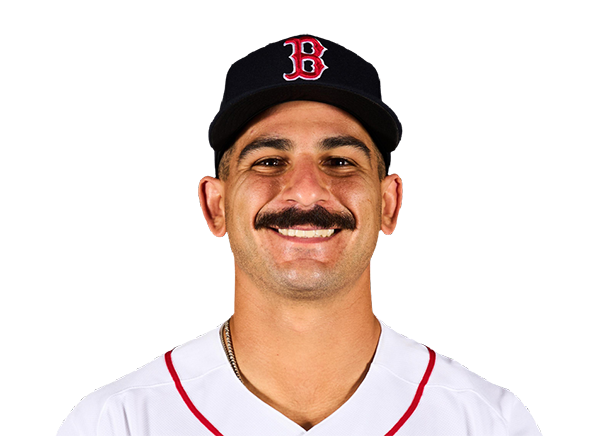 Mickey Gasper | 1-2 | 2 | 0 | 1 | 1 | 0 | 0 | 0 | 0 | .500 | .500 | .500 |
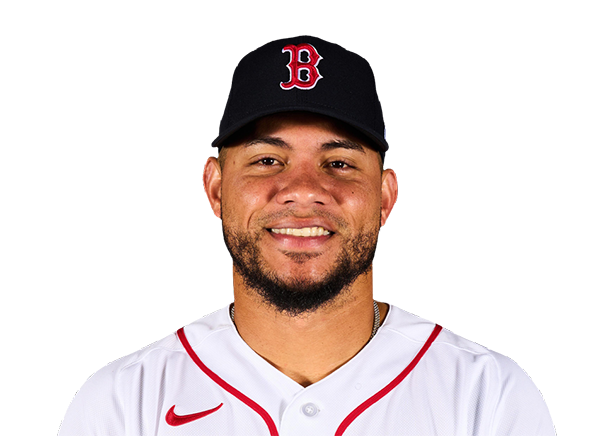 Willson Contreras | 1-2 | 2 | 0 | 1 | 0 | 0 | 0 | 0 | 0 | .500 | .500 | .500 |
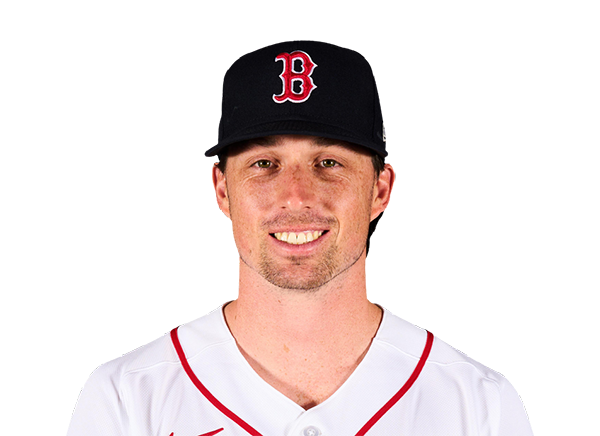 Nick Sogard | 1-3 | 3 | 0 | 1 | 0 | 0 | 0 | 0 | 0 | .333 | .333 | .333 |
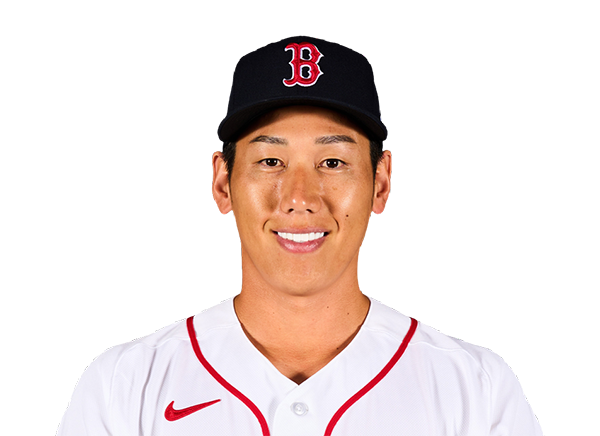 Masataka Yoshida | 0-2 | 2 | 0 | 0 | 0 | 0 | 1 | 0 | 0 | .000 | .333 | .000 |
 Max Ferguson | 0-2 | 2 | 0 | 0 | 0 | 0 | 0 | 0 | 0 | .000 | .000 | .000 |
 Connor Wong | 0-2 | 2 | 0 | 0 | 0 | 0 | 0 | 1 | 0 | .000 | .000 | .000 |
 Matt Thaiss | 0-1 | 1 | 1 | 0 | 0 | 0 | 1 | 0 | 0 | .000 | .500 | .000 |
 Andruw Monasterio | 1-1 | 1 | 1 | 1 | 1 | 1 | 1 | 0 | 0 | 1.000 | 1.000 | 4.000 |
 Kristian Campbell | 1-2 | 2 | 1 | 1 | 0 | 0 | 0 | 0 | 0 | .500 | .500 | 1.000 |
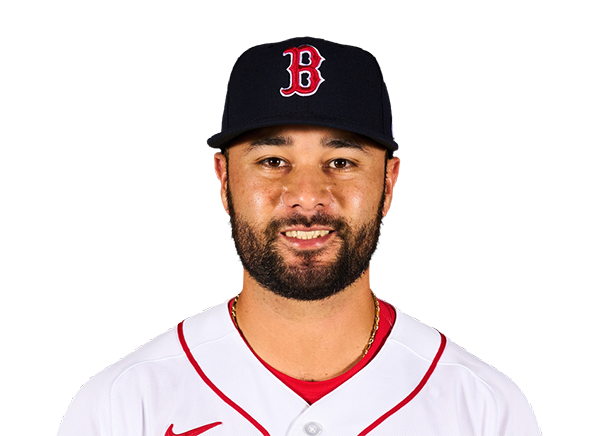 Isiah Kiner-Falefa | 1-2 | 2 | 0 | 1 | 0 | 0 | 0 | 0 | 0 | .500 | .500 | .500 |
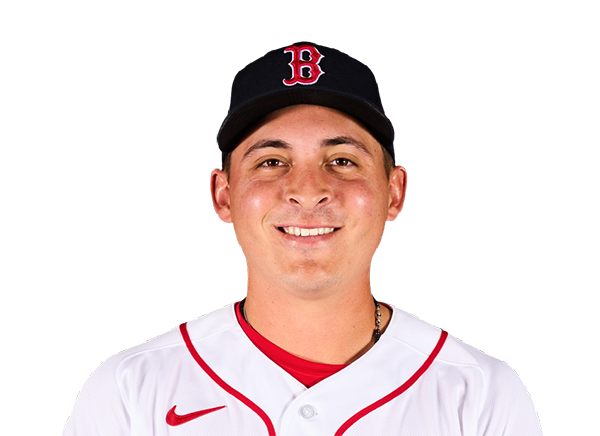 Mikey Romero | 2-2 | 2 | 1 | 2 | 2 | 0 | 0 | 0 | 0 | 1.000 | 1.000 | 1.000 |
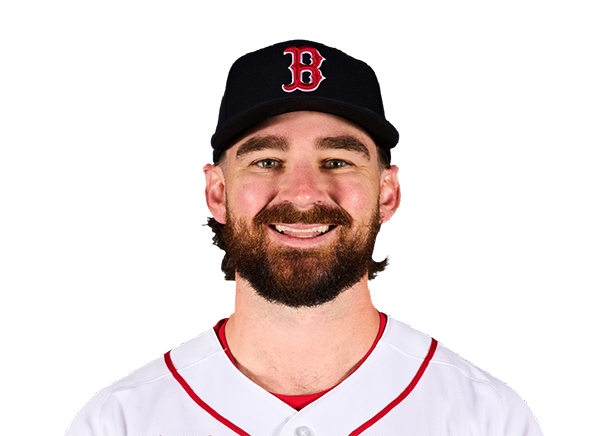 Brendan Rodgers | 0-2 | 2 | 0 | 0 | 0 | 0 | 0 | 0 | 0 | .000 | .000 | .000 |
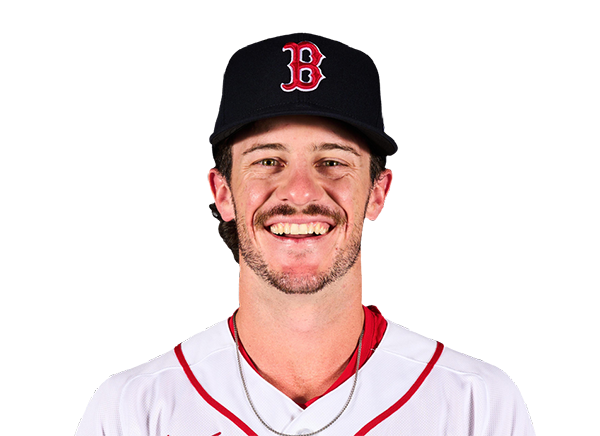 Braiden Ward | 0-2 | 2 | 1 | 0 | 0 | 0 | 0 | 1 | 0 | .000 | .000 | .000 |
Minnesota Twins
| Player | H-AB | AB | R | H | RBI | HR | BB | K | #P | AVG | OBP | SLG |
|---|---|---|---|---|---|---|---|---|---|---|---|---|
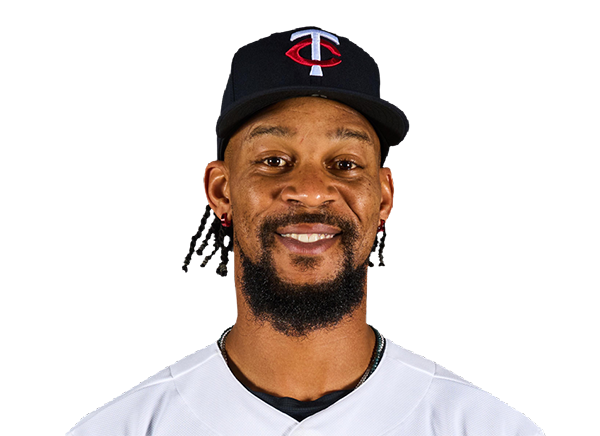 Byron Buxton | 0-2 | 2 | 0 | 0 | 0 | 0 | 0 | 0 | 0 | .000 | .000 | .000 |
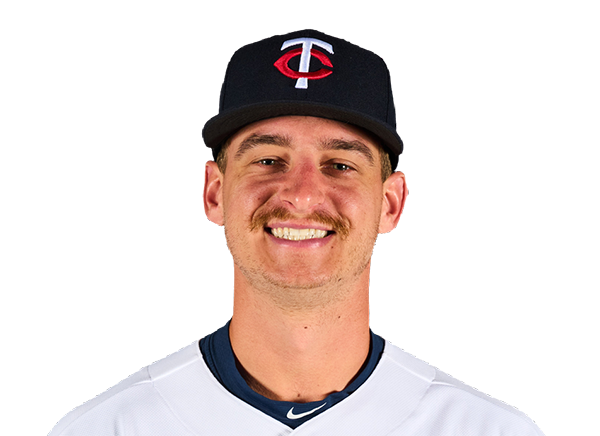 Kyler Fedko | 0-1 | 1 | 0 | 0 | 0 | 0 | 0 | 1 | 0 | .000 | .000 | .000 |
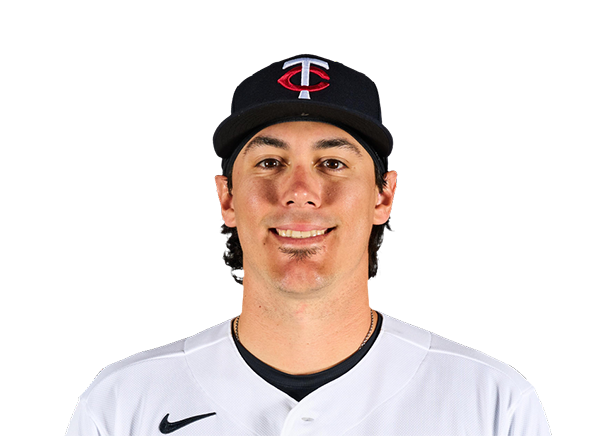 Tristan Gray | 1-2 | 2 | 0 | 1 | 0 | 0 | 0 | 0 | 0 | .500 | .500 | 1.000 |
 Luke Keaschall | 1-2 | 2 | 1 | 1 | 0 | 0 | 0 | 0 | 0 | .500 | .500 | 1.500 |
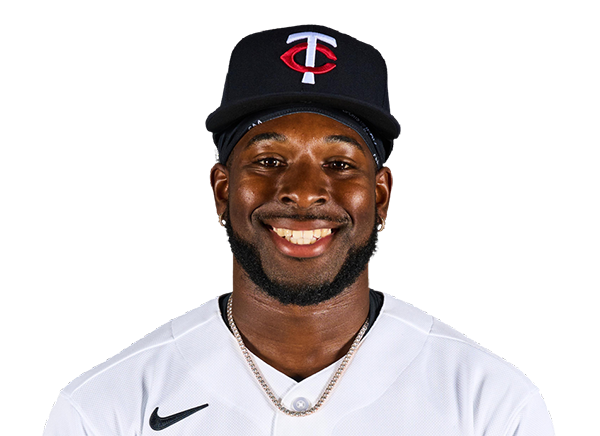 Kaelen Culpepper | 0-2 | 2 | 0 | 0 | 0 | 0 | 0 | 0 | 0 | .000 | .000 | .000 |
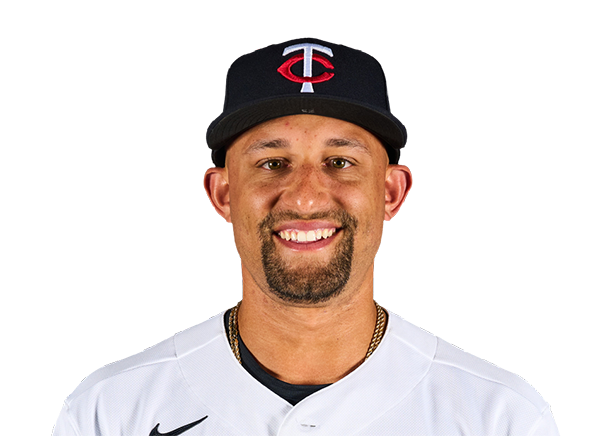 Royce Lewis | 2-2 | 2 | 1 | 2 | 2 | 1 | 0 | 0 | 0 | 1.000 | 1.000 | 2.500 |
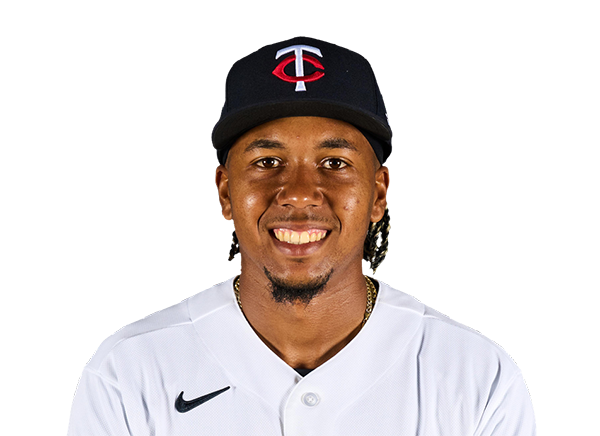 Hendry Mendez | 1-2 | 2 | 0 | 1 | 0 | 0 | 0 | 1 | 0 | .500 | .500 | 1.000 |
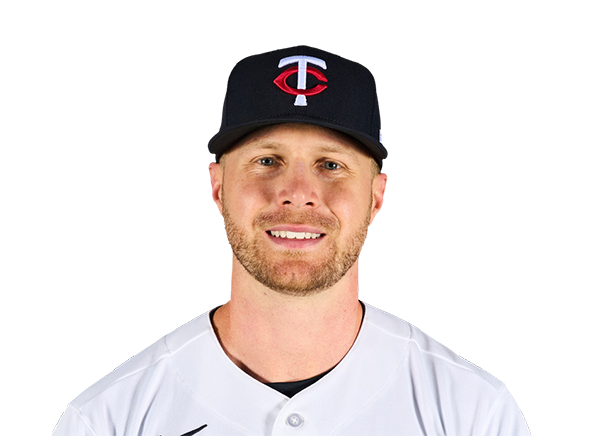 Ryan Jeffers | 0-2 | 2 | 0 | 0 | 0 | 0 | 0 | 0 | 0 | .000 | .000 | .000 |
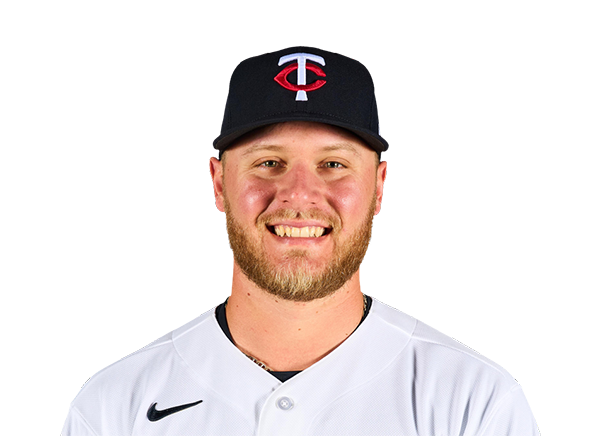 Andrew Cossetti | 0-2 | 2 | 0 | 0 | 0 | 0 | 0 | 1 | 0 | .000 | .000 | .000 |
 Matt Wallner | 0-2 | 2 | 0 | 0 | 0 | 0 | 0 | 2 | 0 | .000 | .000 | .000 |
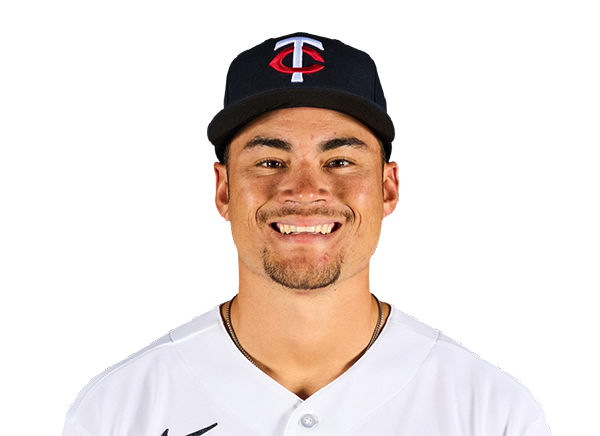 Kala'i Rosario | 0-2 | 2 | 0 | 0 | 0 | 0 | 0 | 1 | 0 | .000 | .000 | .000 |
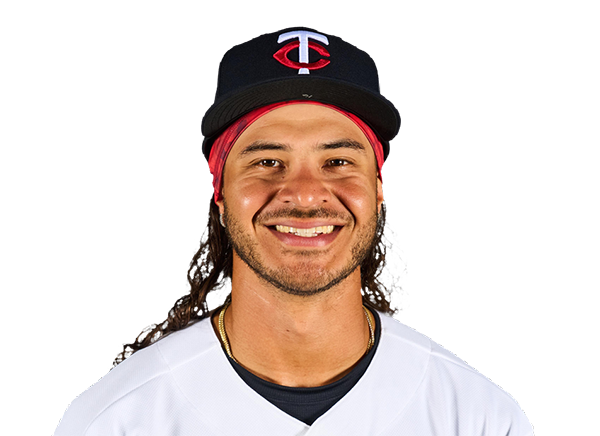 Austin Martin | 0-2 | 2 | 0 | 0 | 0 | 0 | 0 | 0 | 0 | .000 | .000 | .000 |
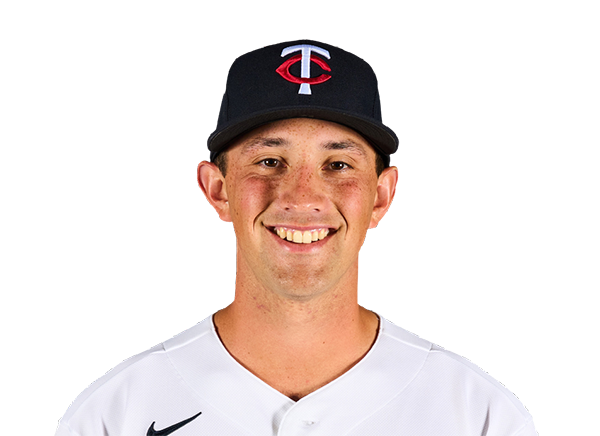 Brooks Lee | 0-2 | 2 | 0 | 0 | 0 | 0 | 0 | 0 | 0 | .000 | .000 | .000 |
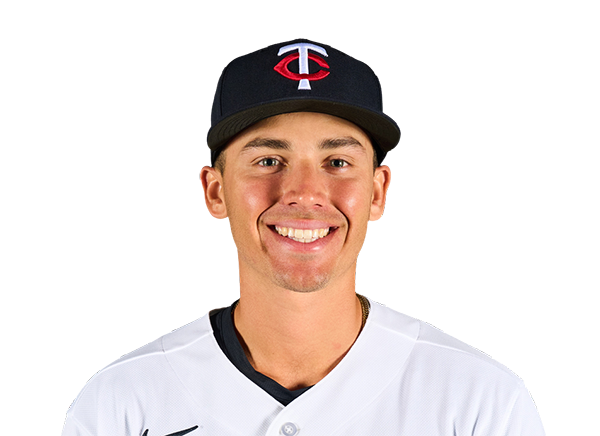 Tanner Schobel | 0-1 | 1 | 0 | 0 | 0 | 0 | 0 | 0 | 0 | .000 | .000 | .000 |
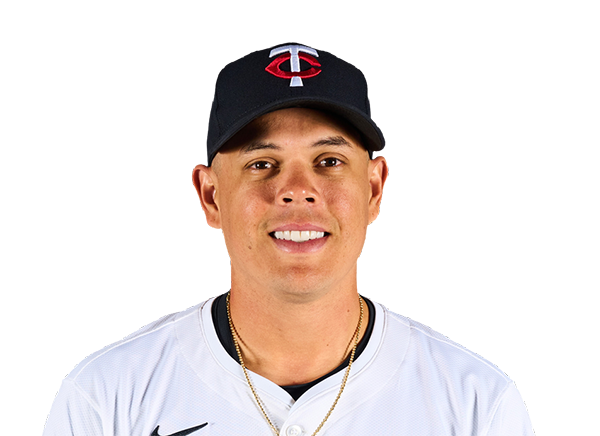 Gio Urshela | 0-3 | 3 | 0 | 0 | 0 | 0 | 0 | 1 | 0 | .000 | .000 | .000 |
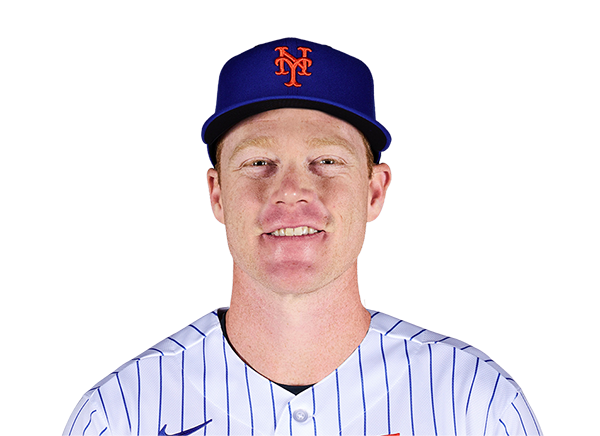 Eric Wagaman | 0-2 | 2 | 0 | 0 | 0 | 0 | 0 | 0 | 0 | .000 | .000 | .000 |
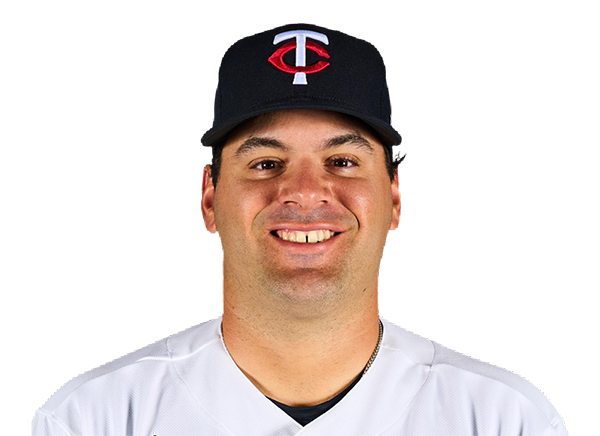 Aaron Sabato | 0-1 | 1 | 0 | 0 | 0 | 0 | 0 | 1 | 0 | .000 | .000 | .000 |
Boston Red Sox
| Player | IP | H | R | ER | BB | K | HR | PC-ST | ERA | PC |
|---|---|---|---|---|---|---|---|---|---|---|
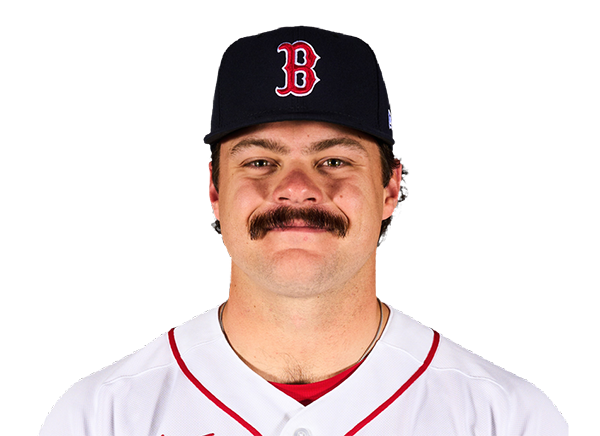 Payton Tolle | 2.0 | 1 | 1 | 1 | 0 | 1 | 1 | ----- | 4.50 | -- |
 Ryan Watson | 1.0 | 0 | 0 | 0 | 0 | 1 | 0 | ----- | 0.00 | -- |
 Seth Martinez | 1.0 | 2 | 1 | 1 | 0 | 1 | 0 | ----- | 9.00 | -- |
 Vinny Nittoli | 1.0 | 0 | 0 | 0 | 0 | 0 | 0 | ----- | 0.00 | -- |
 Jacob Webb | 1.0 | 0 | 0 | 0 | 0 | 1 | 0 | ----- | 0.00 | -- |
 Cooper Adams | 1.0 | 0 | 0 | 0 | 0 | 3 | 0 | ----- | 0.00 | -- |
|
Michael Sansone | 2.0 | 2 | 0 | 0 | 0 | 1 | 0 | ----- | 0.00 | -- |
Minnesota Twins
| Player | IP | H | R | ER | BB | K | HR | PC-ST | ERA | PC |
|---|---|---|---|---|---|---|---|---|---|---|
|
Bryce Stull | 2.0 | 0 | 0 | 0 | 2 | 1 | 0 | ----- | 0.00 | -- |
 Simeon Woods Richardson | 2.0 | 1 | 0 | 0 | 0 | 2 | 0 | ----- | 0.00 | -- |
 Justin Topa | 1.0 | 2 | 1 | 1 | 0 | 2 | 1 | ----- | 9.00 | -- |
 Dan Altavilla | 1.0 | 0 | 0 | 0 | 0 | 1 | 0 | ----- | 0.00 | -- |
 Grant Hartwig | 1.0 | 2 | 3 | 2 | 1 | 0 | 0 | ----- | 18.00 | -- |
 Trent Baker | 1.0 | 1 | 0 | 0 | 0 | 0 | 0 | ----- | 0.00 | -- |
|
Ivran Romero | 1.0 | 3 | 3 | 2 | 1 | 1 | 0 | ----- | 18.00 | -- |
H2H / Season Series
MIN15–6
BOS
BOS6–9
MIN
BOS4–2
MIN
BOS7–2
MIN
MIN8–5
BOS
BOS13–8
MIN
MIN3–5
BOS
MIN2–7
BOS
Last 5 Games
| Date | Opponent | Result |
|---|---|---|
| Sep 2 |  vs SEA | L3–8 |
| Sep 1 | vs SEA | L6–9 |
| Aug 31 | vs SEA | W9–8 |
| Aug 30 |  @ NYY | L1–16 |
| Aug 29 | @ NYY | L2–9 |
| Date | Opponent | Result |
|---|---|---|
| Sep 2 |  vs DET | L6–11 |
| Sep 1 | vs DET | W15–2 |
| Aug 31 | vs DET | W11–1 |
| Aug 30 |  vs CHW | W5–1 |
| Aug 29 | vs CHW | L2–3 |
Standings
American League
| Team | W | L | PCT | GB | DIFF | STRK |
|---|---|---|---|---|---|---|
1 Rays | 83 | 56 | .597 | - | +51 | L1 |
| 2White Sox | 73 | 66 | .525 | 10 | +43 | L1 |
3 Astros | 71 | 69 | .507 | 12.5 | -42 | W1 |
| 4Yankees | 80 | 60 | .571 | 3.5 | +115 | W2 |
| 5Red Sox | 75 | 65 | .536 | 8.5 | +77 | L2 |
6 Guardians | 70 | 69 | .504 | 13 | -8 | L1 |
7 Rangers | 69 | 71 | .493 | 14.5 | -48 | L1 |
8 Blue Jays | 69 | 71 | .493 | 14.5 | -44 | W1 |
9 Orioles | 69 | 71 | .493 | 14.5 | -20 | L2 |
| 10Twins | 67 | 73 | .479 | 16.5 | -38 | L1 |
| 11Mariners | 66 | 74 | .471 | 17.5 | -65 | W2 |
| 12Tigers | 64 | 75 | .460 | 19 | +47 | W1 |
13 Royals | 62 | 78 | .443 | 21.5 | -89 | L3 |
14 Athletics | 54 | 86 | .386 | 29.5 | -194 | W1 |
15 Angels | 53 | 87 | .379 | 30.5 | -80 | L2 |
National League
| Team | W | L | PCT | GB | DIFF | STRK |
|---|---|---|---|---|---|---|
1 Brewers | 87 | 53 | .621 | - | +172 | W2 |
2 Braves | 83 | 57 | .593 | 4 | +118 | W1 |
3 Dodgers | 82 | 57 | .590 | 4.5 | +146 | L2 |
4 Phillies | 79 | 61 | .564 | 8 | +36 | L1 |
5 Cubs | 78 | 62 | .557 | 9 | +132 | L2 |
6 Diamondbacks | 74 | 67 | .525 | 13.5 | -1 | W1 |
7 Padres | 73 | 67 | .521 | 14 | +10 | L2 |
8 Marlins | 71 | 69 | .507 | 16 | +18 | W2 |
9 Cardinals | 70 | 70 | .500 | 17 | -8 | W2 |
10 Pirates | 68 | 72 | .486 | 19 | +26 | L1 |
11 Reds | 67 | 73 | .479 | 20 | -108 | W2 |
12 Nationals | 67 | 75 | .472 | 21 | +14 | L1 |
13 Mets | 63 | 77 | .450 | 24 | -50 | W1 |
14 Giants | 58 | 82 | .414 | 29 | -70 | W1 |
15 Rockies | 54 | 86 | .386 | 33 | -140 | W2 |
BOS
VS
MIN
Pitchers
Payton Tolle
Ryan Watson
Seth Martinez
Vinny Nittoli
Jacob Webb
Cooper Adams
Michael Sansone
Catchers
Connor Wong
Matt Thaiss
Infielders
Nathan Hickey
Willson Contreras
Nick Sogard
Max Ferguson
Andruw Monasterio
Isiah Kiner-Falefa
Mikey Romero
Brendan Rodgers
Outfielders
Roman Anthony
Allan Castro
Ceddanne Rafaela
Masataka Yoshida
Kristian Campbell
Braiden Ward
Designated Hitters
Wilyer Abreu
Mickey Gasper
Pitchers
Bryce Stull
Simeon Woods Richardson
Justin Topa
Dan Altavilla
Grant Hartwig
Trent Baker
Ivran Romero
Catchers
Ryan Jeffers
Andrew Cossetti
Infielders
Tristan Gray
Luke Keaschall
Kaelen Culpepper
Royce Lewis
Brooks Lee
Tanner Schobel
Eric Wagaman
Aaron Sabato
Outfielders
Byron Buxton
Kyler Fedko
Hendry Mendez
Matt Wallner
Kala'i Rosario
Austin Martin
Designated Hitters
Gio Urshela
Red Sox
VS
Twins
Batting
140
Team Games Played
140
4703
At Bats
4727
1177
Hits
1165
598
Runs Batted In
628
143
Home Runs
165
97
Stolen Bases
80
.250
Batting Average
.246
627
Runs
658
258
Doubles
231
24
Triples
20
1912
Total Bases
1931
448
Walks
454
1126
Strikeouts
1114
.323
On Base Percentage
.320
.407
Slugging Percentage
.409
.730
OBP Pct + SLG Pct
.729
140
Games Played
140
140
Games Started
140
82
Hit By Pitch
78
0.0
Wins Above Replacement
0.0
0.0
Offensive Wins Above Replacement
0.0
37
Caught Stealing
33
1
Is Qualified
1
631.5
Runs Created
628.5
4.6
Runs Created Per 27 Outs
4.5
.084
Walks Per Plate Appearance
.086
0.40
Walk To Strikeout Ratio
0.41
.156
Isolated Power
.162
.264
Secondary Average
.268
3.82
Pitches Per Plate Appearance
3.86
425
Extra Base Hits
416
5313
Plate Appearances
5309
32.9
At Bats Per Home Run
28.6
31
Sacrifice Hit
8
46
Sacrifice Flies
41
Pitching
140
Team Games Played
140
54
Quality Starts
46
75
Wins
67
65
Losses
73
37
Saves
38
82
Holds
89
1142
Hits
1196
507
Earned runs
636
138
Home Runs
158
407
Walks
506
1192
Strikeouts
1164
8.6
Strikeouts Per 9 Innings
8.5
141.0
Pitches Per Start
149.7
1.24
Walks Plus Hits Per Inning Pitched
1.38
3.66
Earned Run Average
4.63
65
Losses
73
1245.1
Innings pitched
1236.2
.536
Win Percentage
.479
50
Save Opportunities
54
.243
Opponent Batting Average
.252
.308
Opponent's On-base pct.
.329
.380
Opponent's Slugging pct.
.412
.688
Opponent's OPB Pct + SLG Pct
.741
4708
At Bats
4750
215
Doubles
250
9
Triples
18
56
Batters Hit
60
101
Stolen Bases
113
140
Games Played
140
0
Complete Games
1
14
Shutouts
3
29
Wild Pitches
40
527
Runs Batted In
664
3
Balks
6
1245.1
Innings pitched
1236.2
8.6
Strikeouts Per 9 Innings
8.5
18
Caught Stealing
20
140
Games Started
140
0.0
Wins Above Replacement
0.0
1
Is Qualified
1
550
Runs
696
507
Earned Runs
636
1789
Total Bases
1956
Fielding
140
Team Games Played
140
1245
Full Innings
1237
5029
Total Chances
4853
3736
Putouts
3710
1217
Assists
1078
76
Errors
65
258
Double Plays
231
0.985
Fielding Percentage
0.987
35.8
Range Factor
34.8
0.0
Zone Rating
0.0
140
Games Played
140
0
Games Started
0
0.0
Defensive Wins Above Replacement
0.0
1
Qualified
1