

Rockies vs Blue Jays Live Score (31 Mar, 2026)
Game Information
Stage
Standard
Season
2026
First Pitch
Tue, Mar 31, 7:07 pm
Venue
Rogers Centre
Location
Toronto, Ontario
Attendance
38,871
Live Situation
1Balls
2Strikes
0Outs
—Pitcher
—At Bat
Pitch Sequence
1
STRIKE FOUL
Sinker
98 MPH
2
STRIKE SWINGING
Four-seam FB
96 MPH
3
BALL
Splitter
91 MPH
4
STRIKE FOUL
Four-seam FB
98 MPH
5
STRIKE FOUL
Splitter
90 MPH
6
BALL IN PLAY
Slider
90 MPH
Injury Report


Team Stats
 COL
TOR


1
Runs
5
7
Hits
14
0
Errors
0
1
Home Runs
0
1
Walks
4
6
Strikeouts
10
Player Box Score
Colorado Rockies
| Player | H-AB | AB | R | H | RBI | HR | BB | K | #P | AVG | OBP | SLG |
|---|---|---|---|---|---|---|---|---|---|---|---|---|
 Jake McCarthy | 1-4 | 4 | 0 | 1 | 0 | 0 | 0 | 0 | 16 | .111 | .158 | .167 |
 Hunter Goodman | 1-4 | 4 | 1 | 1 | 1 | 1 | 0 | 1 | 19 | .350 | .381 | .550 |
 Willi Castro | 0-4 | 4 | 0 | 0 | 0 | 0 | 0 | 1 | 12 | .158 | .200 | .263 |
 Ezequiel Tovar | 1-4 | 4 | 0 | 1 | 0 | 0 | 0 | 1 | 8 | .318 | .318 | .545 |
 TJ Rumfield | 3-4 | 4 | 0 | 3 | 0 | 0 | 0 | 1 | 16 | .444 | .500 | .667 |
 Troy Johnston | 0-2 | 2 | 0 | 0 | 0 | 0 | 0 | 0 | 8 | .273 | .273 | .545 |
 Jordan Beck | 0-2 | 2 | 0 | 0 | 0 | 0 | 0 | 0 | 9 | .154 | .267 | .231 |
 Brenton Doyle | 1-2 | 2 | 0 | 1 | 0 | 0 | 1 | 1 | 12 | .188 | .278 | .250 |
 Kyle Karros | 0-3 | 3 | 0 | 0 | 0 | 0 | 0 | 1 | 25 | .235 | .278 | .294 |
 Ryan Ritter | 0-2 | 2 | 0 | 0 | 0 | 0 | 0 | 0 | 8 | .167 | .167 | .167 |
 Edouard Julien | 0-1 | 1 | 0 | 0 | 0 | 0 | 0 | 0 | 3 | .125 | .125 | .250 |
Toronto Blue Jays
| Player | H-AB | AB | R | H | RBI | HR | BB | K | #P | AVG | OBP | SLG |
|---|---|---|---|---|---|---|---|---|---|---|---|---|
 George Springer | 1-3 | 3 | 0 | 1 | 0 | 0 | 2 | 2 | 28 | .182 | .250 | .500 |
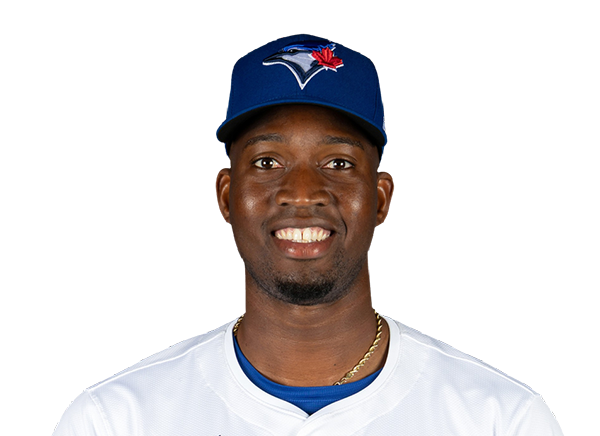 Jesus Sanchez | 2-4 | 4 | 0 | 2 | 1 | 0 | 0 | 1 | 13 | .462 | .563 | .692 |
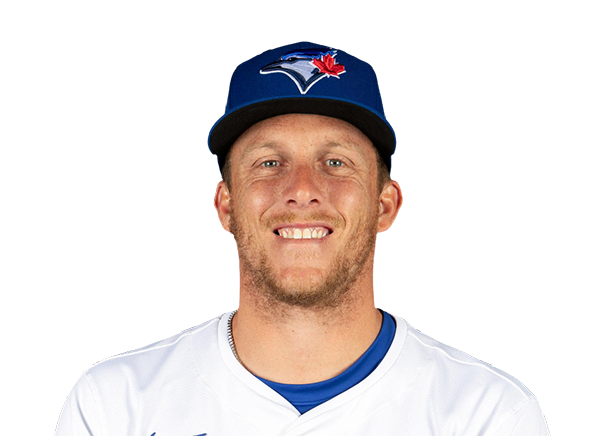 Myles Straw | 1-1 | 1 | 1 | 1 | 0 | 0 | 0 | 0 | 1 | .667 | .667 | .667 |
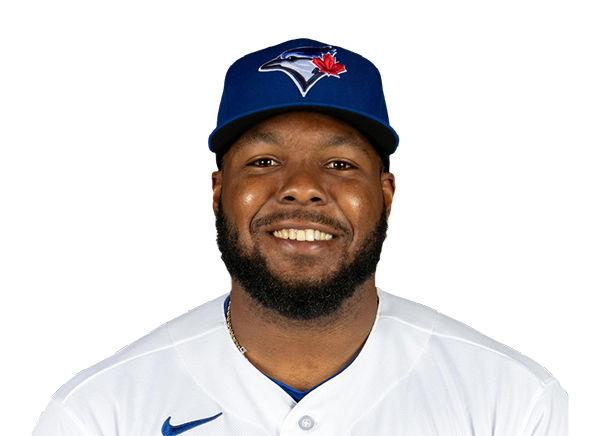 Vladimir Guerrero Jr. | 2-3 | 3 | 1 | 2 | 1 | 0 | 2 | 0 | 17 | .375 | .545 | .375 |
 Kazuma Okamoto | 1-5 | 5 | 0 | 1 | 1 | 0 | 0 | 3 | 27 | .300 | .391 | .600 |
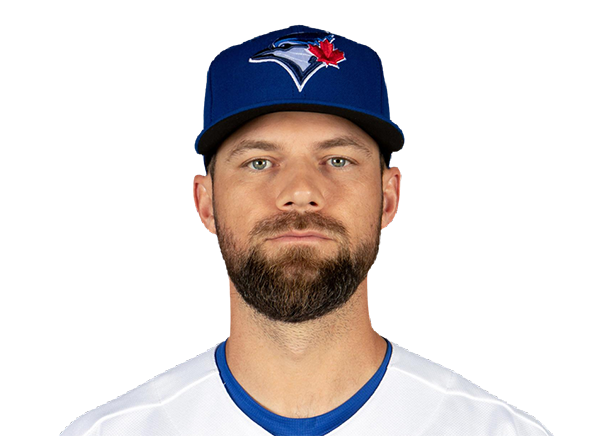 Nathan Lukes | 2-4 | 4 | 1 | 2 | 1 | 0 | 0 | 2 | 14 | .250 | .333 | .250 |
 Ernie Clement | 1-4 | 4 | 0 | 1 | 1 | 0 | 0 | 0 | 9 | .286 | .286 | .429 |
 Daulton Varsho | 1-4 | 4 | 1 | 1 | 0 | 0 | 0 | 0 | 16 | .167 | .250 | .167 |
 Tyler Heineman | 2-4 | 4 | 1 | 2 | 0 | 0 | 0 | 1 | 23 | .500 | .571 | .500 |
 Andres Gimenez | 1-4 | 4 | 0 | 1 | 0 | 0 | 0 | 1 | 13 | .444 | .500 | .722 |
Colorado Rockies
| Player | IP | H | R | ER | BB | K | HR | PC-ST | ERA | PC |
|---|---|---|---|---|---|---|---|---|---|---|
 Ryan Feltner | 3.0 | 1 | 0 | 0 | 1 | 4 | 0 | 47-30 | 0.00 | 47 |
 Juan Mejia | 1.1 | 4 | 2 | 2 | 1 | 0 | 0 | 38-26 | 5.40 | 38 |
 Jaden Hill | 0.2 | 1 | 0 | 0 | 1 | 2 | 0 | 16-9 | 3.38 | 16 |
 Brennan Bernardino | 1.0 | 1 | 0 | 0 | 0 | 1 | 0 | 15-13 | 0.00 | 15 |
 Zach Agnos | 2.0 | 7 | 3 | 3 | 1 | 3 | 0 | 45-33 | 8.10 | 45 |
Toronto Blue Jays
| Player | IP | H | R | ER | BB | K | HR | PC-ST | ERA | PC |
|---|---|---|---|---|---|---|---|---|---|---|
 Max Scherzer | 6.0 | 4 | 1 | 1 | 1 | 4 | 1 | 83-56 | 1.50 | 83 |
 Mason Fluharty | 0.2 | 1 | 0 | 0 | 0 | 1 | 0 | 15-11 | 18.00 | 15 |
 Braydon Fisher | 1.1 | 1 | 0 | 0 | 0 | 0 | 0 | 23-14 | 0.00 | 23 |
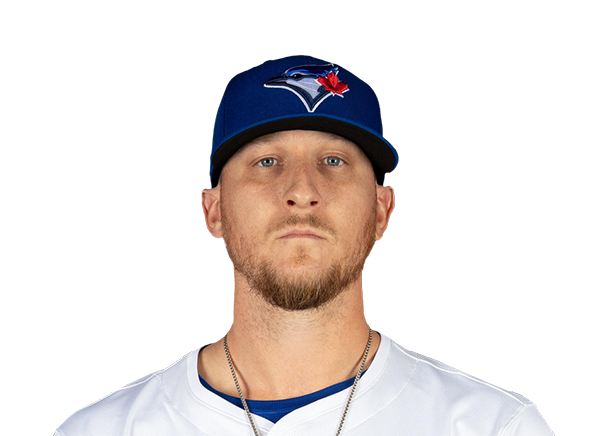 Jeff Hoffman | 1.0 | 1 | 0 | 0 | 0 | 1 | 0 | 15-12 | 3.00 | 15 |
H2H / Season Series
TOR1–2
COL
TOR5–1
COL
TOR5–14
COL
Last 5 Games
| Date | Opponent | Result |
|---|---|---|
| Aug 22 |  vs CLE | L3–4 |
| Aug 21 | vs CLE | L1–9 |
| Aug 19 |  vs LAD | L4–6 |
| Aug 18 | vs LAD | L6–7 |
| Aug 17 | vs LAD | L5–11 |
| Date | Opponent | Result |
|---|---|---|
| Aug 22 |  @ NYY | W4–3 |
| Aug 21 | @ NYY | L1–3 |
| Aug 20 |  @ TB | W5–1 |
| Aug 19 | @ TB | L6–7 |
| Aug 18 | @ TB | W10–5 |
Standings
American League
| Team | W | L | PCT | GB | DIFF | STRK |
|---|---|---|---|---|---|---|
| 1Rays | 76 | 53 | .589 | - | +42 | L3 |
2 White Sox | 67 | 62 | .519 | 9 | +42 | L1 |
3 Astros | 65 | 65 | .500 | 11.5 | -43 | L1 |
| 4Yankees | 73 | 56 | .566 | 3 | +95 | L1 |
5 Red Sox | 70 | 59 | .543 | 6 | +98 | W2 |
6 Rangers | 64 | 66 | .492 | 12.5 | -48 | L1 |
| 7Guardians | 64 | 66 | .492 | 12.5 | -14 | W3 |
| 8Blue Jays | 64 | 67 | .489 | 13 | -50 | W1 |
9 Twins | 63 | 67 | .485 | 13.5 | -47 | L2 |
10 Orioles | 63 | 67 | .485 | 13.5 | -33 | W2 |
11 Mariners | 62 | 68 | .477 | 14.5 | -44 | W2 |
12 Tigers | 61 | 68 | .473 | 15 | +77 | L4 |
13 Royals | 57 | 74 | .435 | 20 | -95 | W7 |
14 Angels | 52 | 78 | .400 | 24.5 | -68 | W1 |
15 Athletics | 50 | 80 | .385 | 26.5 | -188 | W1 |
National League
| Team | W | L | PCT | GB | DIFF | STRK |
|---|---|---|---|---|---|---|
1 Brewers | 81 | 49 | .623 | - | +163 | W3 |
| 2Dodgers | 79 | 51 | .608 | 2 | +147 | W5 |
3 Braves | 75 | 55 | .577 | 6 | +108 | L2 |
4 Cubs | 74 | 56 | .569 | 7 | +98 | L3 |
5 Phillies | 72 | 58 | .554 | 9 | +25 | W8 |
6 Padres | 70 | 60 | .538 | 11 | +9 | W2 |
7 Diamondbacks | 68 | 62 | .523 | 13 | +7 | L1 |
8 Marlins | 66 | 64 | .508 | 15 | +17 | W2 |
9 Cardinals | 66 | 65 | .504 | 15.5 | 0 | L2 |
10 Pirates | 63 | 68 | .481 | 18.5 | +29 | L2 |
11 Reds | 62 | 68 | .477 | 19 | -92 | W1 |
12 Nationals | 61 | 70 | .466 | 20.5 | +14 | L3 |
13 Mets | 59 | 71 | .454 | 22 | -39 | W1 |
14 Giants | 52 | 77 | .403 | 28.5 | -79 | L3 |
| 15Rockies | 50 | 79 | .388 | 30.5 | -131 | L5 |
COL
VS
TOR
Pitchers
Ryan Feltner
Juan Mejia
Jaden Hill
Brennan Bernardino
Zach Agnos
Catchers
Hunter Goodman
Infielders
Willi Castro
Ezequiel Tovar
Kyle Karros
Ryan Ritter
Edouard Julien
Outfielders
Jake McCarthy
Troy Johnston
Jordan Beck
Brenton Doyle
Designated Hitters
TJ Rumfield
Pitchers
Max Scherzer
Mason Fluharty
Braydon Fisher
Jeff Hoffman
Catchers
Tyler Heineman
Infielders
Vladimir Guerrero Jr.
Kazuma Okamoto
Ernie Clement
Andres Gimenez
Outfielders
Jesus Sanchez
Myles Straw
Nathan Lukes
Daulton Varsho
Designated Hitters
George Springer
Rockies
VS
Blue Jays
Batting
129
Team Games Played
131
4377
At Bats
4423
1106
Hits
1087
591
Runs Batted In
495
144
Home Runs
124
88
Stolen Bases
65
.253
Batting Average
.246
615
Runs
518
235
Doubles
207
26
Triples
8
1825
Total Bases
1682
406
Walks
360
1116
Strikeouts
956
.322
On Base Percentage
.307
.417
Slugging Percentage
.380
.739
OBP Pct + SLG Pct
.687
129
Games Played
131
0
Games Started
0
63
Hit By Pitch
46
0.0
Wins Above Replacement
0.0
0.0
Offensive Wins Above Replacement
0.0
34
Caught Stealing
14
1
Is Qualified
1
598.7
Runs Created
518.7
4.7
Runs Created Per 27 Outs
4.0
.083
Walks Per Plate Appearance
.074
0.36
Walk To Strikeout Ratio
0.38
.164
Isolated Power
.135
.269
Secondary Average
.227
3.74
Pitches Per Plate Appearance
3.80
405
Extra Base Hits
339
4907
Plate Appearances
4892
30.4
At Bats Per Home Run
35.7
15
Sacrifice Hit
21
45
Sacrifice Flies
39
Pitching
129
Team Games Played
131
21
Quality Starts
40
50
Wins
64
79
Losses
67
29
Saves
44
50
Holds
85
1303
Hits
1040
697
Earned runs
512
180
Home Runs
134
420
Walks
479
875
Strikeouts
1139
6.9
Strikeouts Per 9 Innings
8.8
0.0
Pitches Per Start
0.0
1.52
Walks Plus Hits Per Inning Pitched
1.30
5.53
Earned Run Average
3.95
79
Losses
67
1134.2
Innings pitched
1166.1
.388
Win Percentage
.489
49
Save Opportunities
59
.288
Opponent Batting Average
.238
.351
Opponent's On-base pct.
.315
.490
Opponent's Slugging pct.
.374
.841
Opponent's OPB Pct + SLG Pct
.690
4521
At Bats
4367
290
Doubles
174
42
Triples
9
51
Batters Hit
33
100
Stolen Bases
126
129
Games Played
131
1
Complete Games
1
0
Shutouts
1
34
Wild Pitches
41
0
Runs Batted In
0
5
Balks
7
1134.2
Innings pitched
1166.1
6.9
Strikeouts Per 9 Innings
8.8
20
Caught Stealing
39
129
Games Started
131
0.0
Wins Above Replacement
0.0
1
Is Qualified
1
746
Runs
568
693
Earned Runs
509
2217
Total Bases
1634
Fielding
129
Team Games Played
131
1135
Full Innings
1166
4580
Total Chances
4696
3404
Putouts
3499
1092
Assists
1118
84
Errors
79
235
Double Plays
207
0.982
Fielding Percentage
0.983
35.7
Range Factor
35.6
0.0
Zone Rating
0.0
129
Games Played
131
0
Games Started
0
0.0
Defensive Wins Above Replacement
0.0
1
Qualified
1