

Rockies vs White Sox Live Score (27 Sep, 2026)
Game Information
Stage
STD
Season
2026
First Pitch
Sun, Sep 27, 3:10 pm
Venue
Rate Field
Location
Chicago, Illinois
Venue Type
Outdoor
Broadcast
MLB.TV
Attendance
29,767
Live Situation
1Balls
3Strikes
0Outs
—Pitcher
—At Bat
Pitch Sequence
1
BALL
Four-seam FB
92 MPH
2
STRIKE SWINGING
Changeup
80 MPH
3
STRIKE FOUL
Changeup
79 MPH
4
STRIKE SWINGING
Four-seam FB
92 MPH
Injury Report




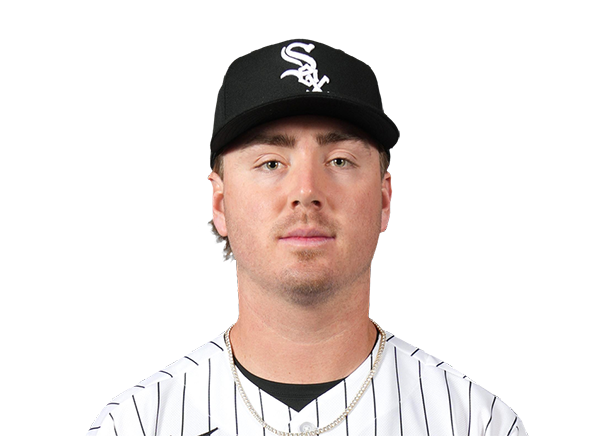
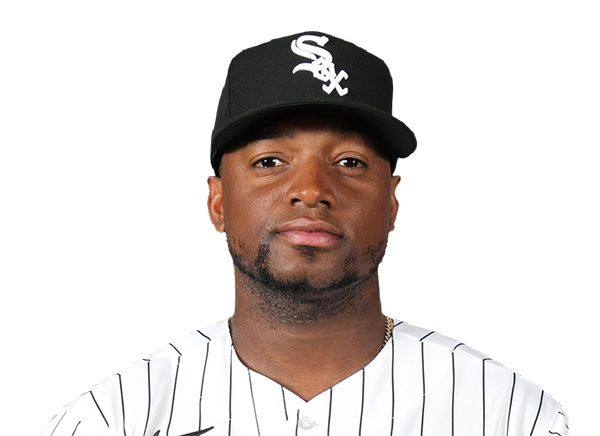
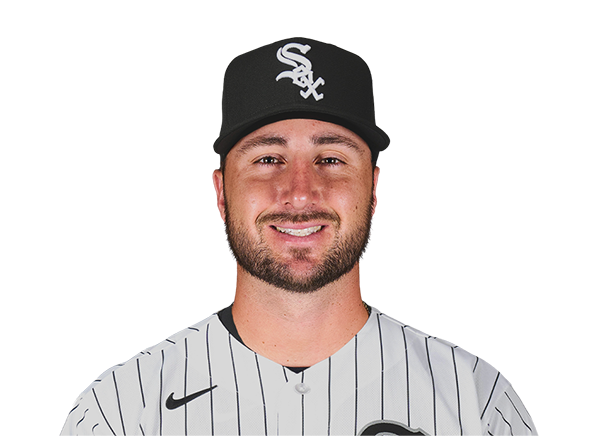


Team Stats
 COL
CHW


2
Runs
4
6
Hits
8
1
Errors
0
1
Home Runs
2
3
Walks
0
9
Strikeouts
6
Player Box Score
Colorado Rockies
| Player | H-AB | AB | R | H | RBI | HR | BB | K | #P | AVG | OBP | SLG |
|---|---|---|---|---|---|---|---|---|---|---|---|---|
 Jake McCarthy | 0-3 | 3 | 0 | 0 | 0 | 0 | 0 | 0 | 10 | .291 | .334 | .475 |
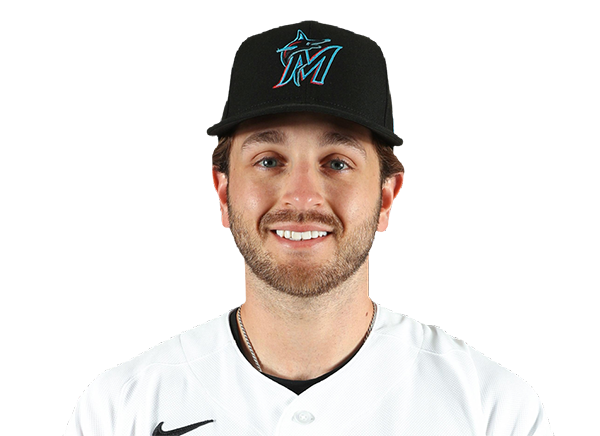 Connor Norby | 1-2 | 2 | 0 | 1 | 1 | 0 | 0 | 0 | 12 | .243 | .342 | .377 |
 Hunter Goodman | 0-3 | 3 | 0 | 0 | 0 | 0 | 1 | 1 | 15 | .245 | .310 | .529 |
 Braxton Fulford | 0-0 | 0 | 0 | 0 | 0 | 0 | 0 | 0 | 0 | .176 | .259 | .270 |
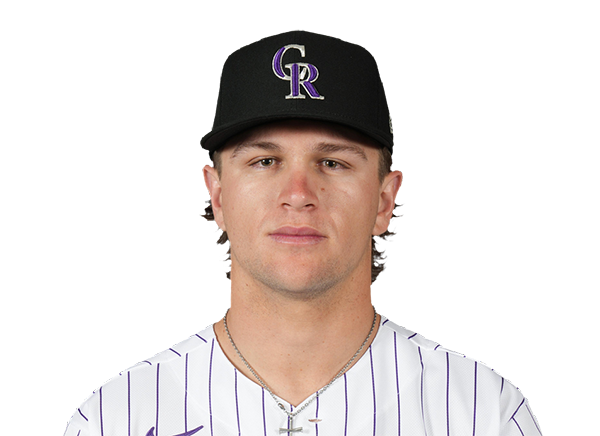 Cole Carrigg | 1-4 | 4 | 1 | 1 | 1 | 1 | 0 | 2 | 17 | .279 | .341 | .477 |
 Kyle Karros | 1-4 | 4 | 0 | 1 | 0 | 0 | 0 | 2 | 17 | .253 | .347 | .414 |
 Adael Amador | 1-3 | 3 | 0 | 1 | 0 | 0 | 1 | 0 | 22 | .277 | .362 | .482 |
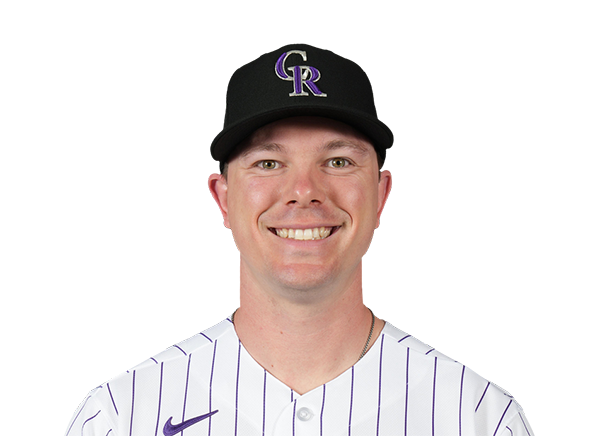 Troy Johnston | 0-4 | 4 | 0 | 0 | 0 | 0 | 0 | 2 | 12 | .277 | .348 | .393 |
 Jordan Beck | 1-3 | 3 | 1 | 1 | 0 | 0 | 1 | 2 | 21 | .200 | .261 | .291 |
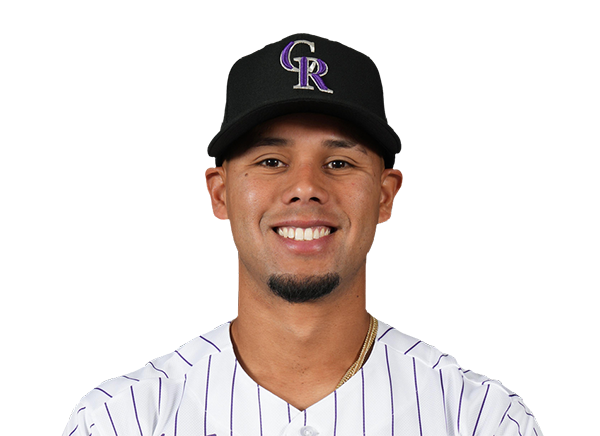 Ezequiel Tovar | 1-3 | 3 | 0 | 1 | 0 | 0 | 0 | 0 | 11 | .219 | .264 | .353 |
Chicago White Sox
| Player | H-AB | AB | R | H | RBI | HR | BB | K | #P | AVG | OBP | SLG |
|---|---|---|---|---|---|---|---|---|---|---|---|---|
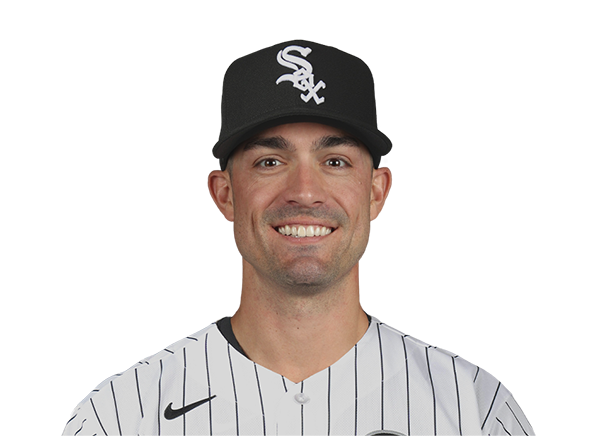 Randal Grichuk | 1-3 | 3 | 1 | 1 | 2 | 1 | 0 | 0 | 8 | .287 | .314 | .566 |
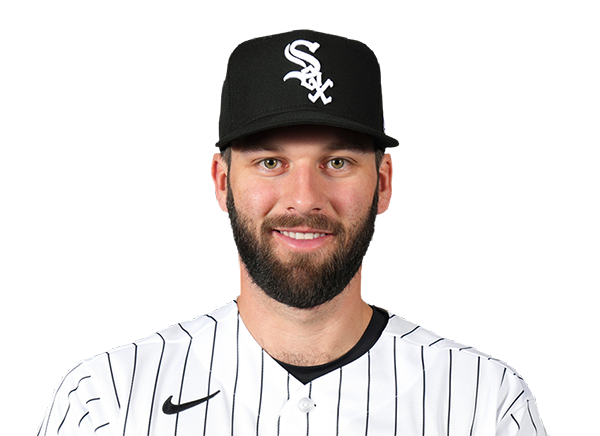 Tristan Peters | 0-1 | 1 | 0 | 0 | 0 | 0 | 0 | 0 | 7 | .265 | .337 | .437 |
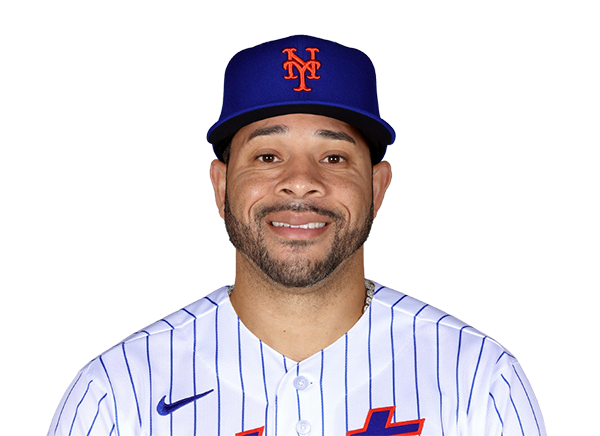 Tommy Pham | 0-4 | 4 | 0 | 0 | 0 | 0 | 0 | 0 | 16 | .100 | .229 | .200 |
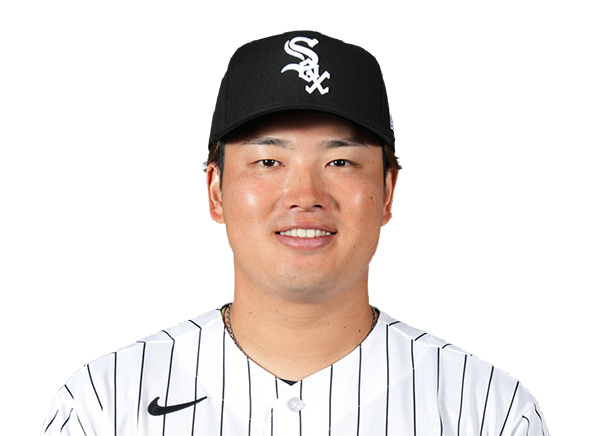 Munetaka Murakami | 1-4 | 4 | 1 | 1 | 0 | 0 | 0 | 1 | 18 | .207 | .347 | .478 |
 Brenton Doyle | 1-4 | 4 | 1 | 1 | 2 | 1 | 0 | 1 | 15 | .233 | .275 | .362 |
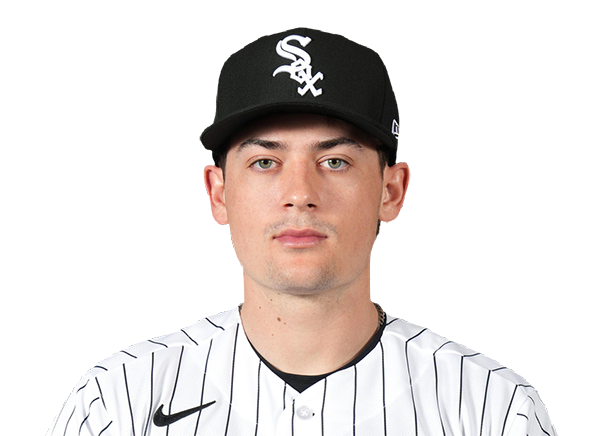 Sam Antonacci | 2-3 | 3 | 0 | 2 | 0 | 0 | 0 | 0 | 13 | .277 | .370 | .396 |
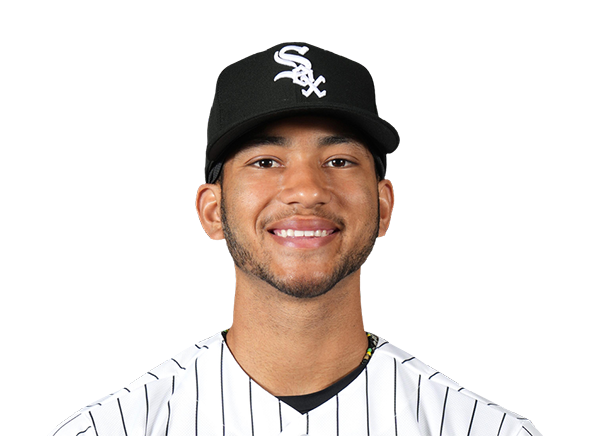 Braden Montgomery | 1-4 | 4 | 0 | 1 | 0 | 0 | 0 | 1 | 12 | .226 | .312 | .350 |
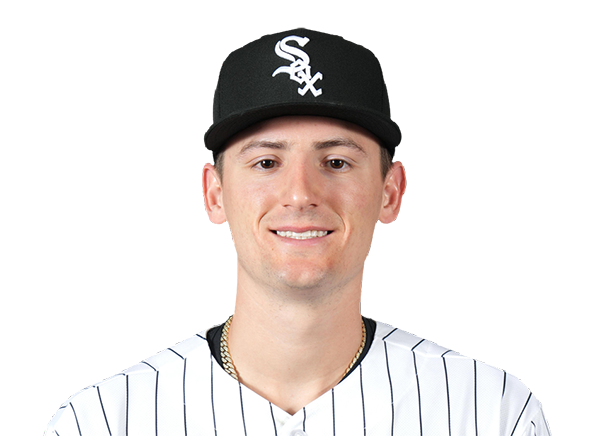 Colson Montgomery | 0-4 | 4 | 0 | 0 | 0 | 0 | 0 | 2 | 11 | .197 | .282 | .403 |
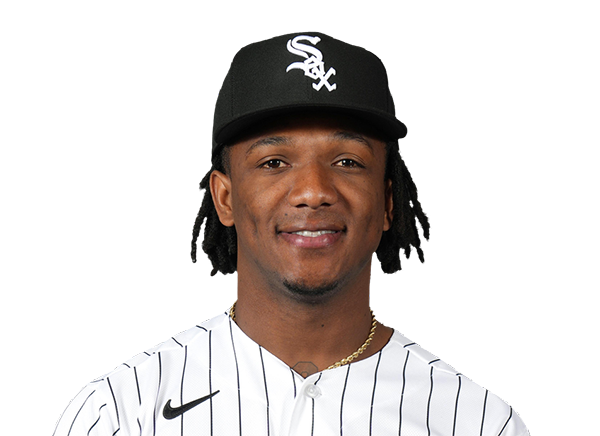 Luisangel Acuna | 1-3 | 3 | 1 | 1 | 0 | 0 | 0 | 1 | 11 | .229 | .261 | .276 |
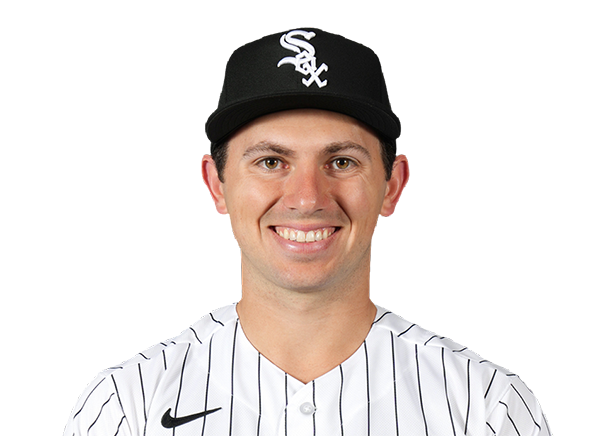 Drew Romo | 1-3 | 3 | 0 | 1 | 0 | 0 | 0 | 0 | 8 | .144 | .240 | .294 |
Colorado Rockies
| Player | IP | H | R | ER | BB | K | HR | PC-ST | ERA | PC |
|---|---|---|---|---|---|---|---|---|---|---|
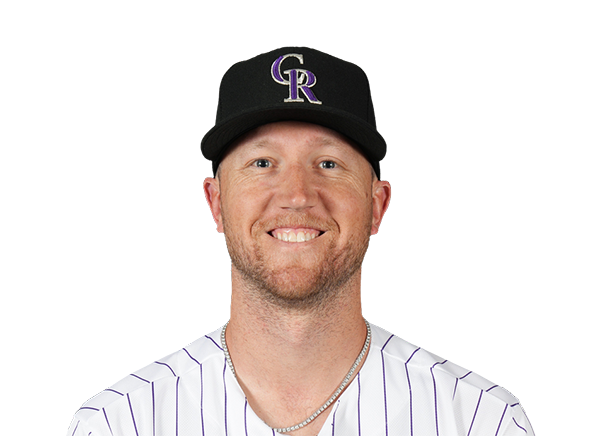 Kyle Freeland | 4.0 | 7 | 4 | 4 | 0 | 2 | 2 | 62-40 | 6.65 | 62 |
 Mark Manfredi | 2.0 | 0 | 0 | 0 | 0 | 1 | 0 | 28-18 | 3.06 | 28 |
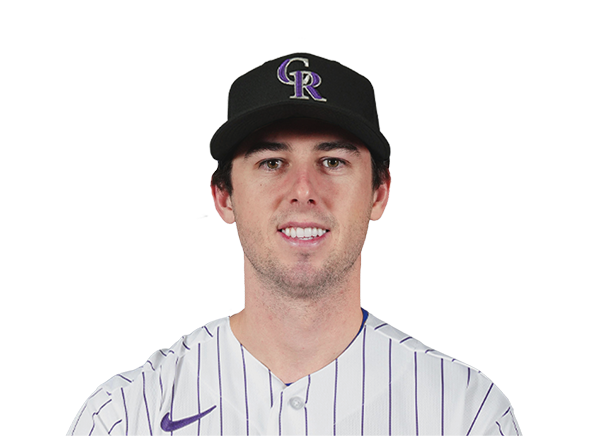 Nick Frasso | 1.0 | 0 | 0 | 0 | 0 | 1 | 0 | 14-10 | 5.82 | 14 |
 Jaden Hill | 1.0 | 1 | 0 | 0 | 0 | 2 | 0 | 15-10 | 5.22 | 15 |
Chicago White Sox
| Player | IP | H | R | ER | BB | K | HR | PC-ST | ERA | PC |
|---|---|---|---|---|---|---|---|---|---|---|
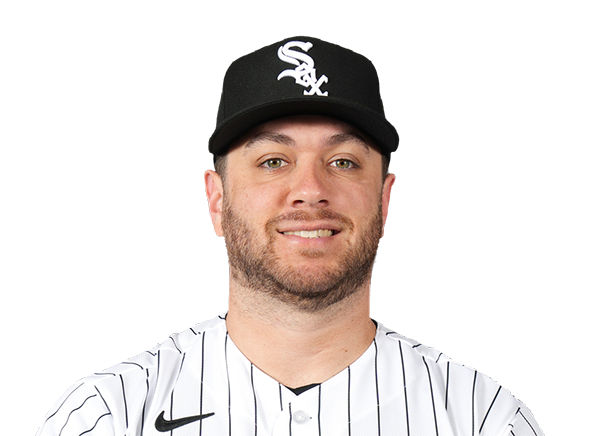 Anthony Kay | 5.0 | 5 | 1 | 1 | 2 | 4 | 0 | 74-50 | 4.44 | 74 |
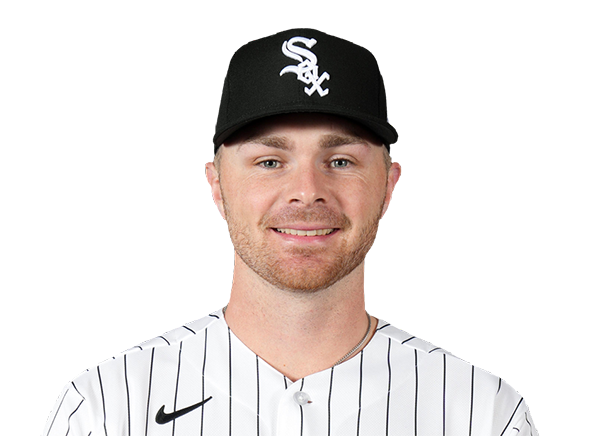 Sean Newcomb | 0.2 | 0 | 0 | 0 | 1 | 2 | 0 | 17-10 | 3.09 | 17 |
 Trevor Richards | 3.1 | 1 | 1 | 1 | 0 | 3 | 1 | 46-31 | 3.69 | 46 |
H2H / Season Series
CHW4–2
COL
CHW6–9
COL
CHW6–1
COL
CHW12–3
COL
COL5–4
CHW
Last 5 Games
| Date | Opponent | Result |
|---|---|---|
| Sep 27 | @ CHW | L2–4 |
| Sep 26 | @ CHW | W9–6 |
| Sep 25 | @ CHW | L1–6 |
| Sep 24 |  vs ARI | L8–12 |
| Sep 23 | vs ARI | L3–5 |
| Date | Opponent | Result |
|---|---|---|
| Sep 26 | vs COL | L6–9 |
| Sep 25 | vs COL | W6–1 |
| Sep 24 |  @ KC | W9–1 |
| Sep 23 | @ KC | L4–5 |
| Sep 22 | @ KC | W14–11 |
Standings
American League
| Team | W | L | PCT | GB | DIFF | STRK |
|---|---|---|---|---|---|---|
1 Rays | 98 | 64 | .605 | - | +86 | L1 |
2 Guardians | 85 | 77 | .525 | 13 | +11 | L1 |
3 Astros | 81 | 81 | .500 | 17 | -32 | W2 |
4 Yankees | 93 | 68 | .578 | 4.5 | +138 | W1 |
5 Red Sox | 87 | 75 | .537 | 11 | +78 | L1 |
| 6White Sox | 84 | 78 | .519 | 14 | +56 | W1 |
7 Rangers | 80 | 82 | .494 | 18 | -46 | L1 |
8 Orioles | 79 | 82 | .491 | 18.5 | -21 | L1 |
9 Blue Jays | 79 | 83 | .488 | 19 | -46 | W1 |
10 Twins | 77 | 85 | .475 | 21 | -58 | W1 |
11 Tigers | 76 | 86 | .469 | 22 | +71 | L1 |
12 Mariners | 76 | 86 | .469 | 22 | -58 | W2 |
| 13Royals | 69 | 93 | .426 | 29 | -120 | W1 |
14 Athletics | 64 | 98 | .395 | 34 | -238 | L2 |
15 Angels | 62 | 100 | .383 | 36 | -97 | L2 |
National League
| Team | W | L | PCT | GB | DIFF | STRK |
|---|---|---|---|---|---|---|
1 Brewers | 103 | 59 | .636 | - | +214 | W5 |
2 Dodgers | 100 | 62 | .617 | 3 | +201 | W3 |
3 Braves | 94 | 68 | .580 | 9 | +116 | L1 |
4 Padres | 91 | 71 | .562 | 12 | +41 | W2 |
5 Cubs | 89 | 73 | .549 | 14 | +147 | W1 |
6 Phillies | 88 | 74 | .543 | 15 | +15 | W1 |
| 7Diamondbacks | 86 | 76 | .531 | 17 | +9 | L2 |
8 Pirates | 82 | 80 | .506 | 21 | +28 | W1 |
9 Marlins | 80 | 82 | .494 | 23 | +3 | W1 |
10 Cardinals | 77 | 85 | .475 | 26 | -29 | L4 |
11 Nationals | 77 | 85 | .475 | 26 | +6 | W1 |
12 Reds | 75 | 87 | .463 | 28 | -160 | L1 |
13 Mets | 74 | 88 | .457 | 29 | -32 | L1 |
14 Giants | 65 | 97 | .401 | 38 | -91 | L5 |
| 15Rockies | 58 | 104 | .358 | 45 | -192 | L1 |
COL
VS
CHW
Pitchers
Kyle Freeland
Catchers
Hunter Goodman
Infielders
Kyle Karros
Adael Amador
Troy Johnston
Ezequiel Tovar
Outfielders
Jake McCarthy
Cole Carrigg
Jordan Beck
Designated Hitters
Connor Norby
Pitchers
Anthony Kay
Catchers
Drew Romo
Infielders
Munetaka Murakami
Sam Antonacci
Colson Montgomery
Luisangel Acuna
Outfielders
Randal Grichuk
Brenton Doyle
Braden Montgomery
Designated Hitters
Tommy Pham
Rockies
VS
White Sox
Batting
162
Team Games Played
162
5517
At Bats
5430
1399
Hits
1282
721
Runs Batted In
740
180
Home Runs
211
109
Stolen Bases
93
.254
Batting Average
.236
752
Runs
776
283
Doubles
252
39
Triples
18
2300
Total Bases
2203
500
Walks
589
1409
Strikeouts
1494
.322
On Base Percentage
.320
.417
Slugging Percentage
.406
.739
OBP Pct + SLG Pct
.726
162
Games Played
162
162
Games Started
162
81
Hit By Pitch
101
0.0
Wins Above Replacement
0.0
0.0
Offensive Wins Above Replacement
0.0
41
Caught Stealing
35
1
Is Qualified
1
753.2
Runs Created
732.7
4.7
Runs Created Per 27 Outs
4.6
.081
Walks Per Plate Appearance
.095
0.35
Walk To Strikeout Ratio
0.39
.163
Isolated Power
.170
.266
Secondary Average
.289
3.74
Pitches Per Plate Appearance
3.88
502
Extra Base Hits
481
6173
Plate Appearances
6187
30.7
At Bats Per Home Run
25.7
23
Sacrifice Hit
27
51
Sacrifice Flies
38
Pitching
162
Team Games Played
162
24
Quality Starts
34
58
Wins
84
104
Losses
78
33
Saves
41
61
Holds
64
1635
Hits
1317
883
Earned runs
660
227
Home Runs
180
531
Walks
571
1113
Strikeouts
1337
7.0
Strikeouts Per 9 Innings
8.4
149.2
Pitches Per Start
150.2
1.52
Walks Plus Hits Per Inning Pitched
1.31
5.59
Earned Run Average
4.12
104
Losses
78
1421.2
Innings pitched
1440.2
.358
Win Percentage
.519
58
Save Opportunities
71
.288
Opponent Batting Average
.243
.351
Opponent's On-base pct.
.323
.491
Opponent's Slugging pct.
.398
.842
Opponent's OPB Pct + SLG Pct
.721
5669
At Bats
5427
358
Doubles
260
55
Triples
22
61
Batters Hit
91
130
Stolen Bases
119
162
Games Played
162
1
Complete Games
0
1
Shutouts
9
48
Wild Pitches
70
907
Runs Batted In
693
5
Balks
9
1421.2
Innings pitched
1440.2
7.0
Strikeouts Per 9 Innings
8.4
30
Caught Stealing
41
162
Games Started
162
0.0
Wins Above Replacement
0.0
1
Is Qualified
1
944
Runs
720
883
Earned Runs
660
2784
Total Bases
2161
Fielding
162
Team Games Played
162
1422
Full Innings
1441
5717
Total Chances
5722
4265
Putouts
4322
1352
Assists
1318
100
Errors
82
283
Double Plays
252
0.983
Fielding Percentage
0.986
35.6
Range Factor
35.2
0.0
Zone Rating
0.0
162
Games Played
162
0
Games Started
0
0.0
Defensive Wins Above Replacement
0.0
1
Qualified
1