

Royals vs Red Sox Live Score (11 Sep, 2026)
Game Information
Stage
STD
Season
2026
First Pitch
Fri, Sep 11, 7:10 pm
Venue
Fenway Park
Location
Boston, Massachusetts
Venue Type
Outdoor
Broadcast
MLB.TV
Attendance
36,890
Live Situation
2Balls
3Strikes
0Outs
—Pitcher
—At Bat
Pitch Sequence
1
BALL
Cutter
93 MPH
2
STRIKE LOOKING
Cutter
93 MPH
3
BALL
Cutter
91 MPH
4
STRIKE SWINGING
Four-seam FB
98 MPH
5
STRIKE SWINGING
Slider
87 MPH
Injury Report



Team Stats
 KC
BOS


3
Runs
2
10
Hits
8
0
Errors
0
0
Home Runs
1
5
Walks
2
8
Strikeouts
10
Player Box Score
Kansas City Royals
| Player | H-AB | AB | R | H | RBI | HR | BB | K | #P | AVG | OBP | SLG |
|---|---|---|---|---|---|---|---|---|---|---|---|---|
 Carter Jensen | 2-5 | 5 | 2 | 2 | 1 | 0 | 0 | 1 | 22 | .231 | .319 | .447 |
 Bobby Witt Jr. | 0-3 | 3 | 0 | 0 | 0 | 0 | 2 | 1 | 9 | .280 | .360 | .451 |
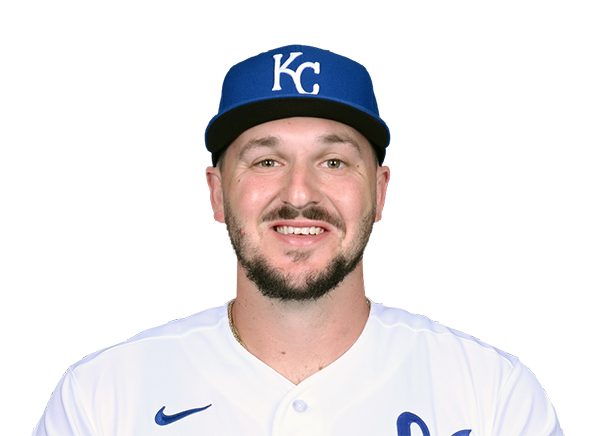 Vinnie Pasquantino | 1-5 | 5 | 0 | 1 | 1 | 0 | 0 | 2 | 14 | .239 | .328 | .383 |
 Salvador Perez | 2-4 | 4 | 0 | 2 | 1 | 0 | 0 | 0 | 15 | .230 | .274 | .384 |
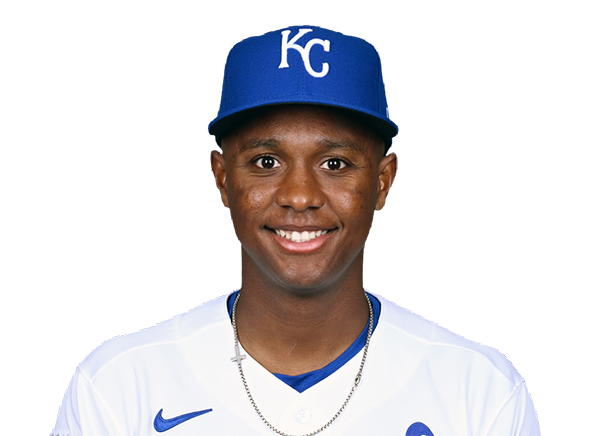 Tyler Tolbert | 0-1 | 1 | 0 | 0 | 0 | 0 | 0 | 1 | 3 | .299 | .366 | .419 |
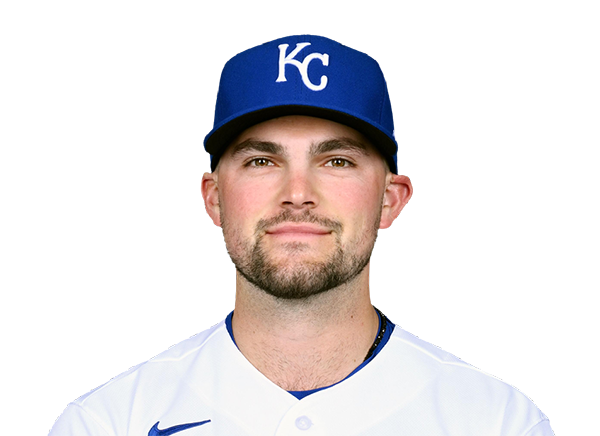 Michael Massey | 2-4 | 4 | 0 | 2 | 0 | 0 | 0 | 0 | 12 | .280 | .315 | .439 |
 John Rave | 0-2 | 2 | 0 | 0 | 0 | 0 | 2 | 0 | 19 | .229 | .314 | .448 |
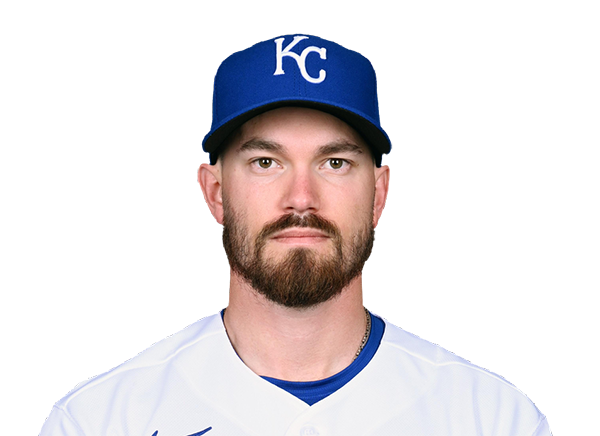 Nick Loftin | 1-4 | 4 | 0 | 1 | 0 | 0 | 0 | 1 | 17 | .235 | .321 | .382 |
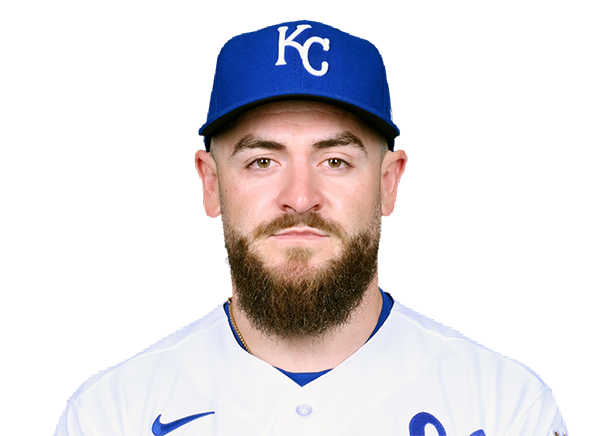 Kyle Isbel | 1-4 | 4 | 0 | 1 | 0 | 0 | 0 | 1 | 15 | .226 | .274 | .336 |
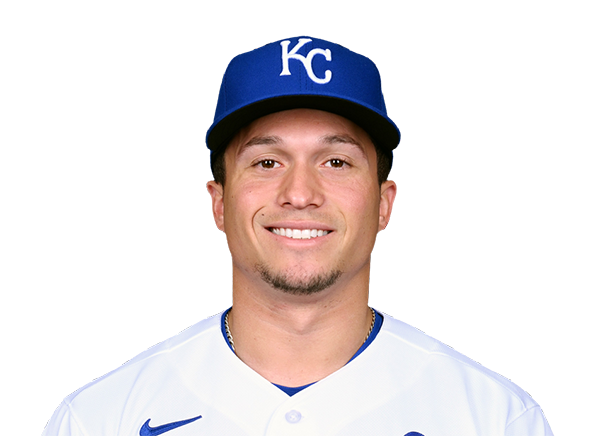 Isaac Collins | 1-2 | 2 | 1 | 1 | 0 | 0 | 1 | 1 | 17 | .223 | .325 | .339 |
Boston Red Sox
| Player | H-AB | AB | R | H | RBI | HR | BB | K | #P | AVG | OBP | SLG |
|---|---|---|---|---|---|---|---|---|---|---|---|---|
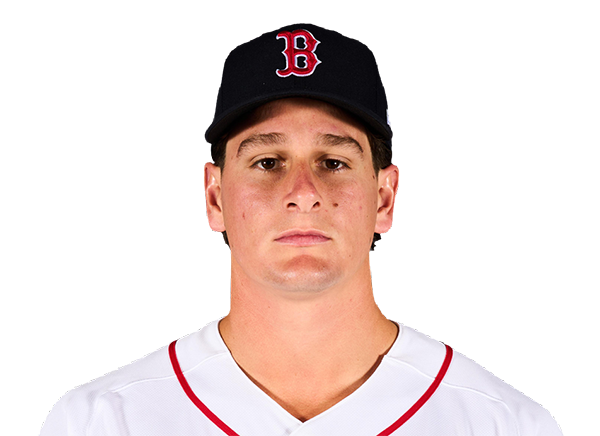 Roman Anthony | 1-5 | 5 | 0 | 1 | 0 | 0 | 0 | 2 | 25 | .235 | .340 | .377 |
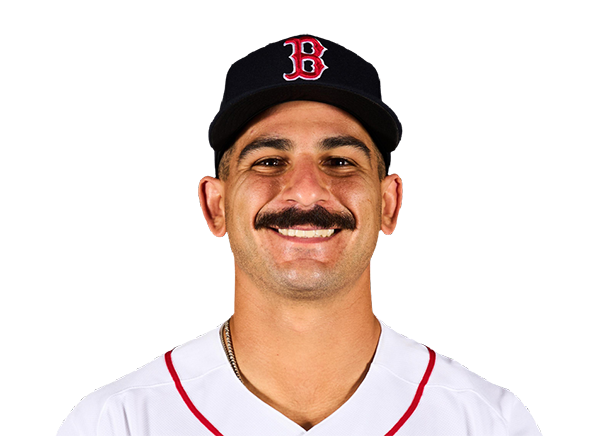 Mickey Gasper | 1-3 | 3 | 1 | 1 | 1 | 1 | 0 | 1 | 10 | .265 | .376 | .494 |
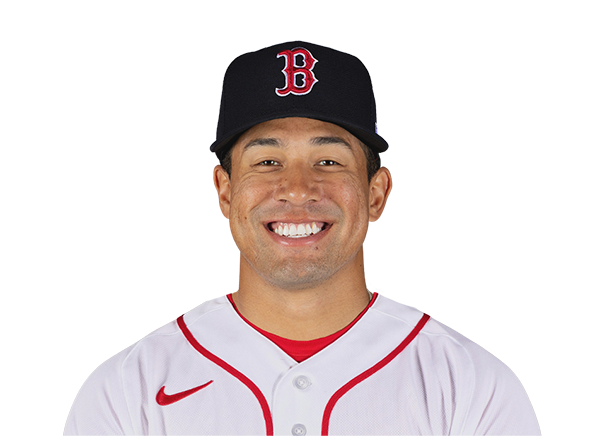 Jahmai Jones | 0-1 | 1 | 0 | 0 | 0 | 0 | 0 | 0 | 3 | .216 | .314 | .388 |
 Adley Rutschman | 0-2 | 2 | 1 | 0 | 0 | 0 | 2 | 1 | 21 | .236 | .317 | .421 |
 Wilyer Abreu | 2-4 | 4 | 0 | 2 | 1 | 0 | 0 | 0 | 20 | .257 | .338 | .467 |
 Trevor Story | 1-4 | 4 | 0 | 1 | 0 | 0 | 0 | 1 | 12 | .233 | .262 | .338 |
 Nick Sogard | 0-4 | 4 | 0 | 0 | 0 | 0 | 0 | 1 | 18 | .261 | .355 | .394 |
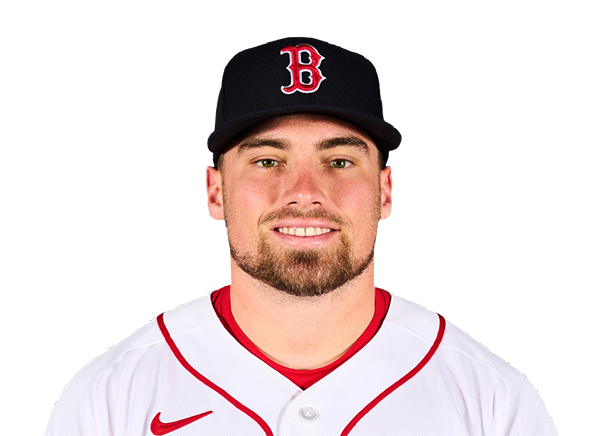 Caleb Durbin | 1-4 | 4 | 0 | 1 | 0 | 0 | 0 | 1 | 12 | .248 | .327 | .378 |
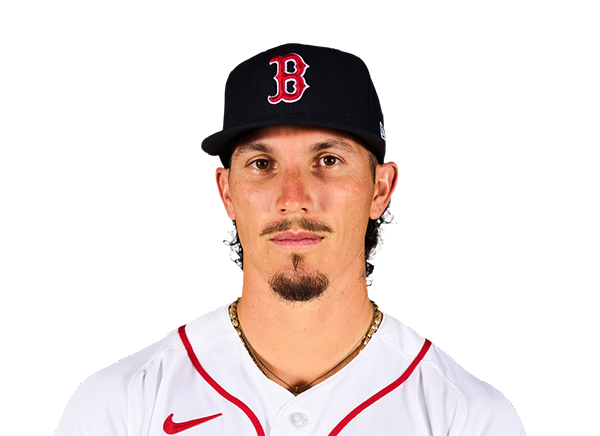 Jarren Duran | 1-4 | 4 | 0 | 1 | 0 | 0 | 0 | 2 | 15 | .207 | .263 | .366 |
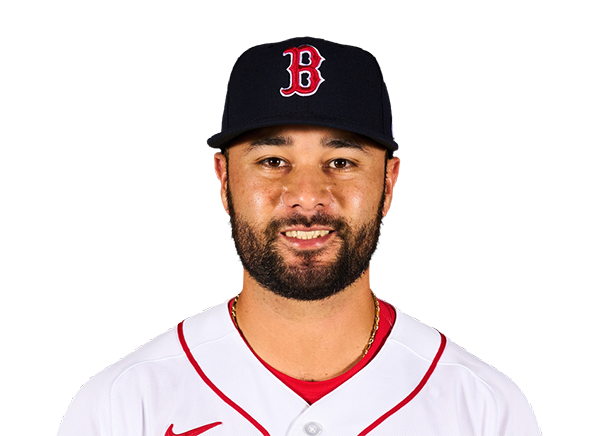 Isiah Kiner-Falefa | 1-4 | 4 | 0 | 1 | 0 | 0 | 0 | 1 | 10 | .268 | .340 | .348 |
Kansas City Royals
| Player | IP | H | R | ER | BB | K | HR | PC-ST | ERA | PC |
|---|---|---|---|---|---|---|---|---|---|---|
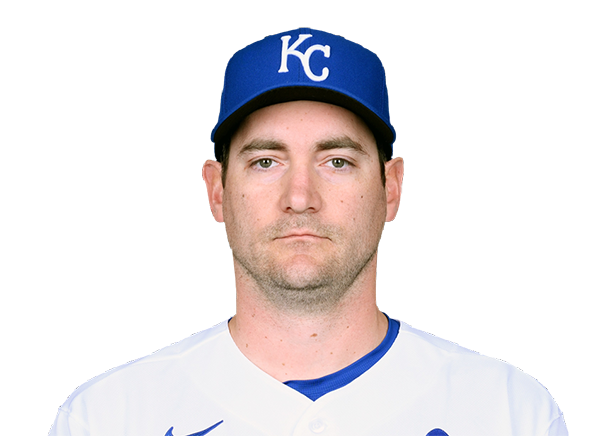 Seth Lugo | 5.0 | 7 | 2 | 2 | 2 | 7 | 1 | 95-62 | 4.99 | 95 |
 Nolan Hoffman | 1.0 | 0 | 0 | 0 | 0 | 1 | 0 | 11-8 | 4.50 | 11 |
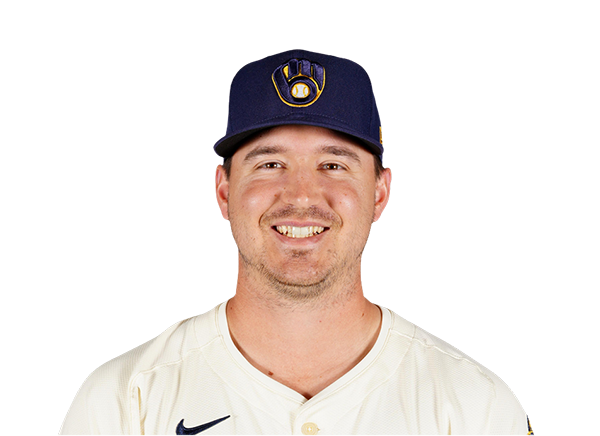 Connor Thomas | 1.0 | 0 | 0 | 0 | 0 | 0 | 0 | 13-10 | 9.72 | 13 |
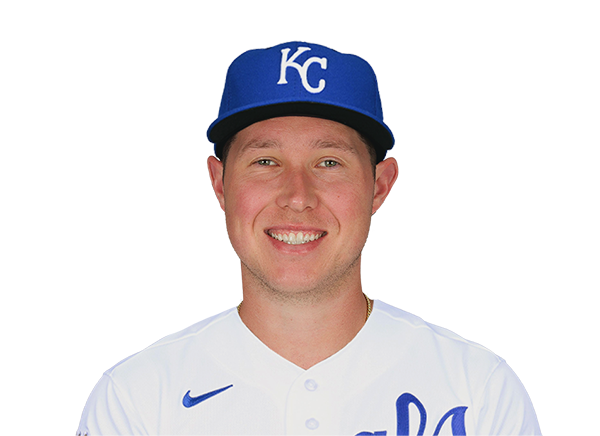 Nate Pearson | 1.0 | 1 | 0 | 0 | 0 | 1 | 0 | 17-11 | 1.98 | 17 |
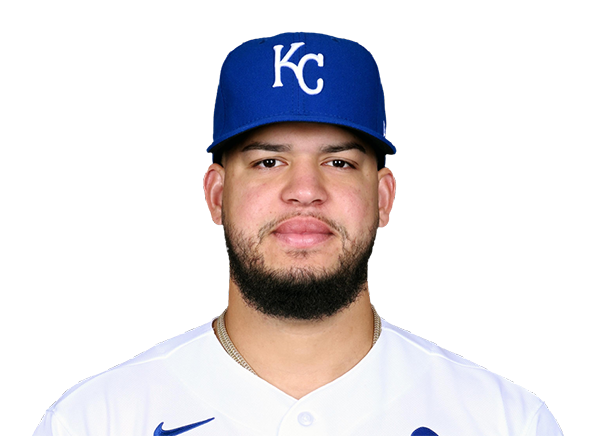 Steven Cruz | 1.0 | 0 | 0 | 0 | 0 | 1 | 0 | 10-6 | 4.04 | 10 |
Boston Red Sox
| Player | IP | H | R | ER | BB | K | HR | PC-ST | ERA | PC |
|---|---|---|---|---|---|---|---|---|---|---|
 Sonny Gray | 6.0 | 6 | 3 | 3 | 2 | 5 | 0 | 90-60 | 2.76 | 90 |
 Erik Miller | 1.0 | 1 | 0 | 0 | 1 | 1 | 0 | 12-10 | 2.11 | 12 |
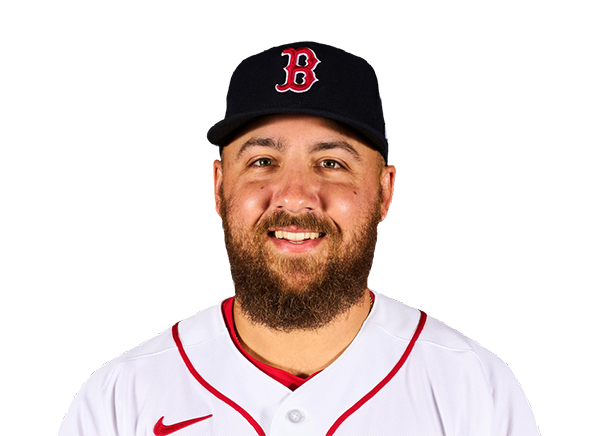 Greg Weissert | 0.2 | 3 | 0 | 0 | 0 | 0 | 0 | 18-13 | 3.60 | 18 |
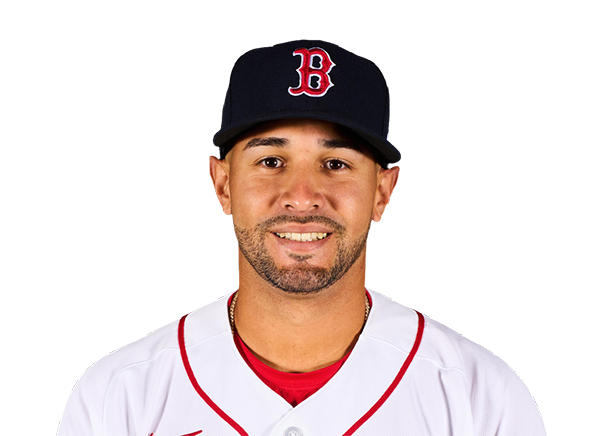 Jovani Moran | 1.1 | 0 | 0 | 0 | 2 | 2 | 0 | 23-14 | 3.34 | 23 |
H2H / Season Series
BOS2–3
KC
KC3–4
BOS
KC1–7
BOS
KC1–3
BOS
Last 5 Games
| Date | Opponent | Result |
|---|---|---|
| Sep 11 | @ BOS | W3–2 |
| Sep 9 |  vs ARI | W5–2 |
| Sep 8 | vs ARI | L3–5 |
| Sep 7 | vs ARI | L4–5 |
| Sep 6 |  vs TOR | W6–1 |
| Date | Opponent | Result |
|---|---|---|
| Sep 11 | vs KC | L2–3 |
| Sep 9 |  vs LAA | L4–6 |
| Sep 8 | vs LAA | L1–6 |
| Sep 7 | vs LAA | W5–2 |
| Sep 6 |  @ BAL | W3–1 |
Standings
American League
| Team | W | L | PCT | GB | DIFF | STRK |
|---|---|---|---|---|---|---|
1 Rays | 88 | 59 | .599 | - | +58 | W1 |
2 White Sox | 75 | 72 | .510 | 13 | +35 | L4 |
3 Astros | 75 | 73 | .507 | 13.5 | -42 | L1 |
4 Yankees | 85 | 62 | .578 | 3 | +133 | W4 |
| 5Red Sox | 80 | 68 | .541 | 8.5 | +81 | L3 |
6 Guardians | 75 | 73 | .507 | 13.5 | -13 | W1 |
| 7Blue Jays | 73 | 75 | .493 | 15.5 | -42 | L2 |
8 Rangers | 72 | 76 | .486 | 16.5 | -49 | L3 |
| 9Orioles | 72 | 76 | .486 | 16.5 | -24 | W2 |
10 Twins | 69 | 78 | .469 | 19 | -56 | L2 |
11 Mariners | 69 | 79 | .466 | 19.5 | -75 | L1 |
12 Tigers | 68 | 79 | .463 | 20 | +59 | W2 |
| 13Royals | 66 | 82 | .446 | 22.5 | -87 | W2 |
14 Athletics | 60 | 88 | .405 | 28.5 | -186 | W2 |
| 15Angels | 56 | 91 | .381 | 32 | -74 | L1 |
National League
| Team | W | L | PCT | GB | DIFF | STRK |
|---|---|---|---|---|---|---|
1 Brewers | 92 | 56 | .622 | - | +192 | W4 |
2 Dodgers | 90 | 57 | .612 | 1.5 | +173 | W8 |
3 Braves | 87 | 61 | .588 | 5 | +111 | W2 |
4 Cubs | 82 | 66 | .554 | 10 | +138 | W1 |
5 Phillies | 82 | 66 | .554 | 10 | +36 | L2 |
6 Padres | 79 | 68 | .537 | 12.5 | +19 | W5 |
| 7Diamondbacks | 79 | 69 | .534 | 13 | +7 | W1 |
8 Pirates | 74 | 74 | .500 | 18 | +26 | L1 |
9 Cardinals | 73 | 75 | .493 | 19 | -8 | W1 |
10 Marlins | 72 | 76 | .486 | 20 | +3 | L4 |
11 Reds | 69 | 78 | .469 | 22.5 | -142 | L4 |
12 Mets | 68 | 79 | .463 | 23.5 | -42 | L1 |
13 Nationals | 68 | 81 | .456 | 24.5 | +1 | W1 |
14 Giants | 62 | 86 | .419 | 30 | -74 | L1 |
15 Rockies | 55 | 92 | .374 | 36.5 | -158 | L5 |
KC
VS
BOS
Pitchers
Seth Lugo
Catchers
Carter Jensen
Infielders
Bobby Witt Jr.
Vinnie Pasquantino
Michael Massey
Nick Loftin
Outfielders
John Rave
Kyle Isbel
Isaac Collins
Designated Hitters
Salvador Perez
Pitchers
Sonny Gray
Catchers
Adley Rutschman
Infielders
Trevor Story
Nick Sogard
Caleb Durbin
Isiah Kiner-Falefa
Outfielders
Roman Anthony
Wilyer Abreu
Jarren Duran
Designated Hitters
Mickey Gasper
Royals
VS
Red Sox
Batting
148
Team Games Played
148
4965
At Bats
4971
1226
Hits
1231
602
Runs Batted In
625
154
Home Runs
154
119
Stolen Bases
100
.247
Batting Average
.248
632
Runs
654
269
Doubles
266
19
Triples
24
1995
Total Bases
2007
474
Walks
476
1149
Strikeouts
1205
.317
On Base Percentage
.322
.402
Slugging Percentage
.404
.718
OBP Pct + SLG Pct
.725
148
Games Played
148
148
Games Started
148
52
Hit By Pitch
87
0.0
Wins Above Replacement
0.0
0.0
Offensive Wins Above Replacement
0.0
32
Caught Stealing
37
1
Is Qualified
1
647.2
Runs Created
661.2
4.4
Runs Created Per 27 Outs
4.5
.085
Walks Per Plate Appearance
.085
0.41
Walk To Strikeout Ratio
0.40
.155
Isolated Power
.156
.268
Secondary Average
.265
3.80
Pitches Per Plate Appearance
3.84
442
Extra Base Hits
444
5562
Plate Appearances
5614
32.2
At Bats Per Home Run
32.3
25
Sacrifice Hit
31
44
Sacrifice Flies
46
Pitching
148
Team Games Played
148
60
Quality Starts
59
66
Wins
80
82
Losses
68
36
Saves
41
76
Holds
86
1285
Hits
1208
671
Earned runs
530
180
Home Runs
146
531
Walks
427
1075
Strikeouts
1275
7.4
Strikeouts Per 9 Innings
8.7
147.0
Pitches Per Start
140.7
1.39
Walks Plus Hits Per Inning Pitched
1.24
4.63
Earned Run Average
3.62
82
Losses
68
1305.1
Innings pitched
1317.1
.446
Win Percentage
.541
60
Save Opportunities
54
.258
Opponent Batting Average
.243
.335
Opponent's On-base pct.
.308
.429
Opponent's Slugging pct.
.382
.763
Opponent's OPB Pct + SLG Pct
.690
4977
At Bats
4968
264
Doubles
233
22
Triples
9
58
Batters Hit
59
68
Stolen Bases
105
148
Games Played
148
2
Complete Games
0
8
Shutouts
16
50
Wild Pitches
30
686
Runs Batted In
548
3
Balks
3
1305.1
Innings pitched
1317.1
7.4
Strikeouts Per 9 Innings
8.7
33
Caught Stealing
20
148
Games Started
148
0.0
Wins Above Replacement
0.0
1
Is Qualified
1
719
Runs
573
671
Earned Runs
530
2133
Total Bases
1897
Fielding
148
Team Games Played
148
1305
Full Innings
1317
5333
Total Chances
5316
3916
Putouts
3952
1352
Assists
1289
65
Errors
75
269
Double Plays
266
0.988
Fielding Percentage
0.986
36.3
Range Factor
35.8
0.0
Zone Rating
0.0
148
Games Played
148
0
Games Started
0
0.0
Defensive Wins Above Replacement
0.0
1
Qualified
1