

Royals vs Yankees Live Score (18 Apr, 2026)
Game Information
Stage
Standard
Season
2026
First Pitch
Sat, Apr 18, 1:35 pm
Venue
Yankee Stadium
Location
Bronx, New York
Attendance
42,070
Live Situation
3Balls
3Strikes
0Outs
—Pitcher
—At Bat
Pitch Sequence
1
BALL
Cutter
91 MPH
2
STRIKE LOOKING
Sinker
94 MPH
3
STRIKE FOUL
Sinker
95 MPH
4
BALL
Cutter
91 MPH
5
BALL
Cutter
90 MPH
6
STRIKE FOUL
Sinker
93 MPH
7
STRIKE SWINGING
Cutter
90 MPH
Injury Report


Team Stats
 KC
NYY


4
Runs
13
7
Hits
11
1
Errors
0
1
Home Runs
4
1
Walks
7
12
Strikeouts
6
Player Box Score
Kansas City Royals
| Player | H-AB | AB | R | H | RBI | HR | BB | K | #P | AVG | OBP | SLG |
|---|---|---|---|---|---|---|---|---|---|---|---|---|
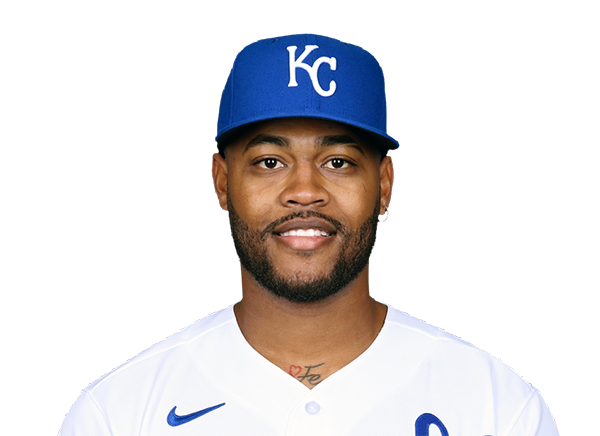 Maikel Garcia | 1-4 | 4 | 0 | 1 | 0 | 0 | 0 | 1 | 11 | .268 | .337 | .415 |
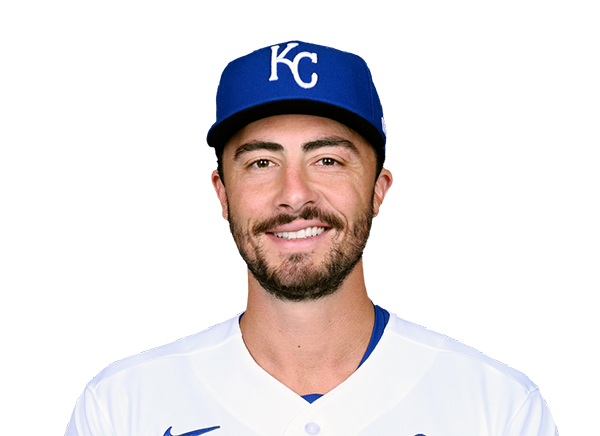 Jonathan India | 0-0 | 0 | 0 | 0 | 0 | 0 | 0 | 0 | 0 | .167 | .310 | .313 |
 Bobby Witt Jr. | 1-3 | 3 | 0 | 1 | 0 | 0 | 0 | 1 | 9 | .266 | .344 | .329 |
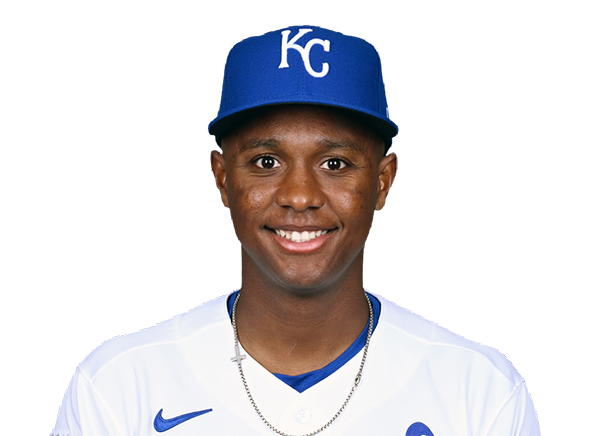 Tyler Tolbert | 1-1 | 1 | 1 | 1 | 0 | 0 | 0 | 0 | 2 | .200 | .200 | .200 |
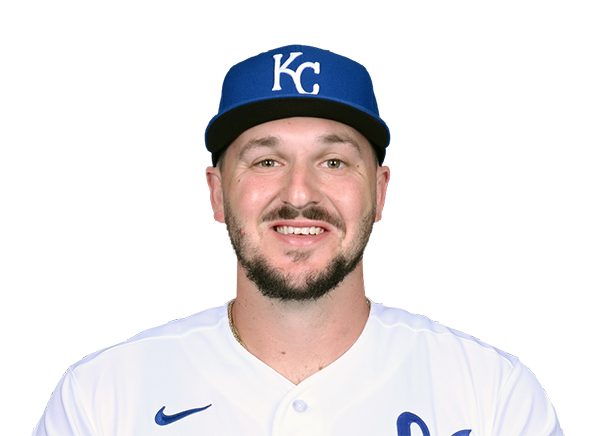 Vinnie Pasquantino | 0-4 | 4 | 0 | 0 | 0 | 0 | 0 | 1 | 13 | .165 | .244 | .278 |
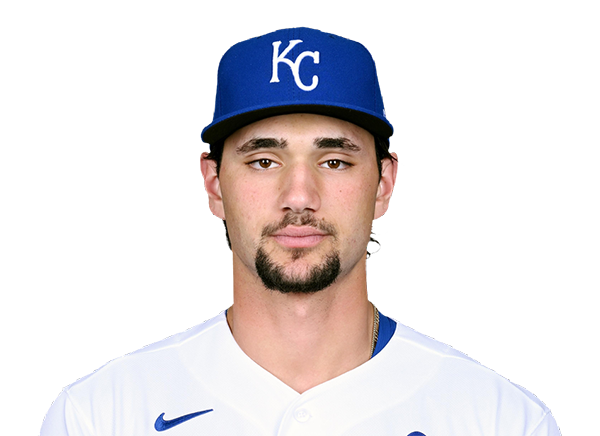 Jac Caglianone | 1-4 | 4 | 1 | 1 | 0 | 0 | 0 | 1 | 13 | .270 | .343 | .365 |
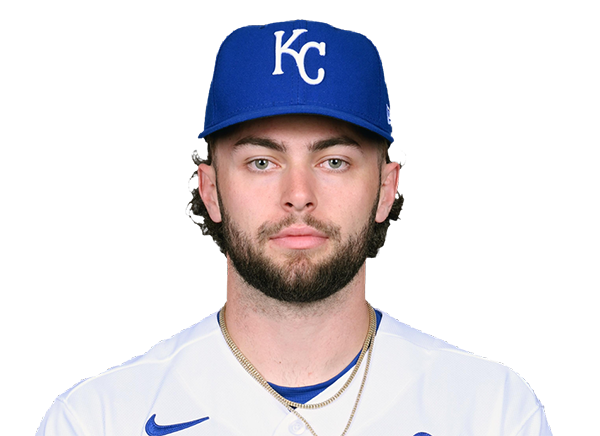 Carter Jensen | 2-3 | 3 | 2 | 2 | 2 | 1 | 1 | 1 | 22 | .237 | .303 | .508 |
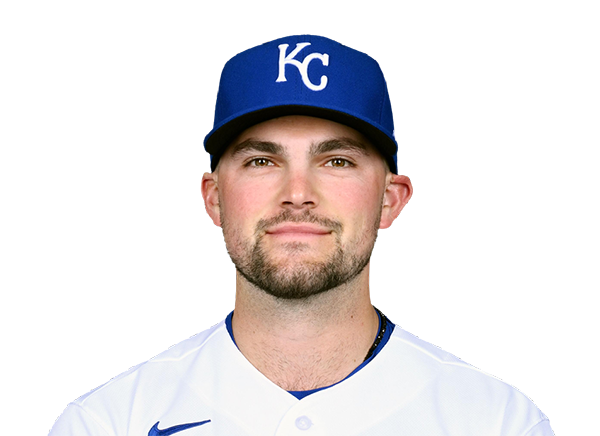 Michael Massey | 1-4 | 4 | 0 | 1 | 2 | 0 | 0 | 1 | 13 | .200 | .238 | .300 |
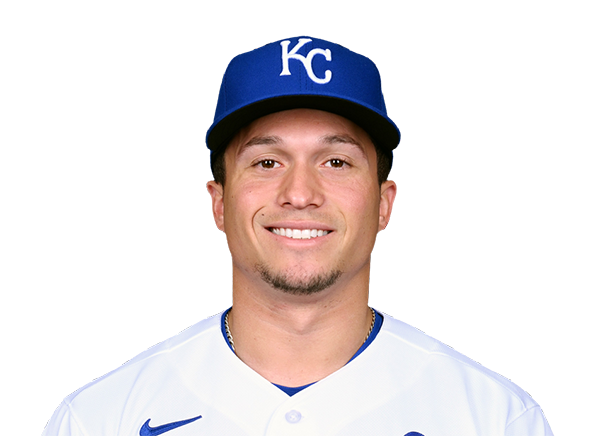 Isaac Collins | 0-4 | 4 | 0 | 0 | 0 | 0 | 0 | 4 | 22 | .196 | .302 | .283 |
 Lane Thomas | 0-3 | 3 | 0 | 0 | 0 | 0 | 0 | 1 | 11 | .184 | .311 | .211 |
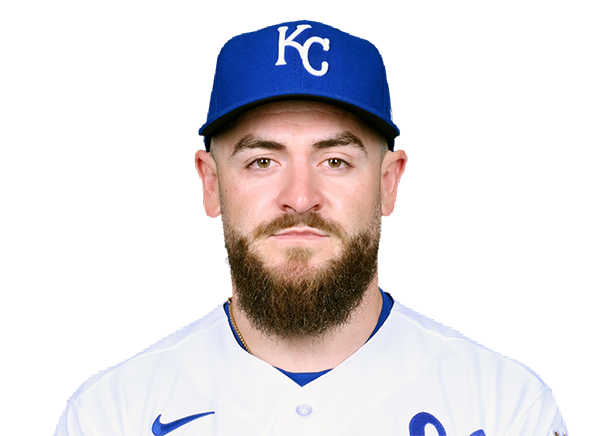 Kyle Isbel | 0-3 | 3 | 0 | 0 | 0 | 0 | 0 | 1 | 9 | .265 | .333 | .408 |
New York Yankees
| Player | H-AB | AB | R | H | RBI | HR | BB | K | #P | AVG | OBP | SLG |
|---|---|---|---|---|---|---|---|---|---|---|---|---|
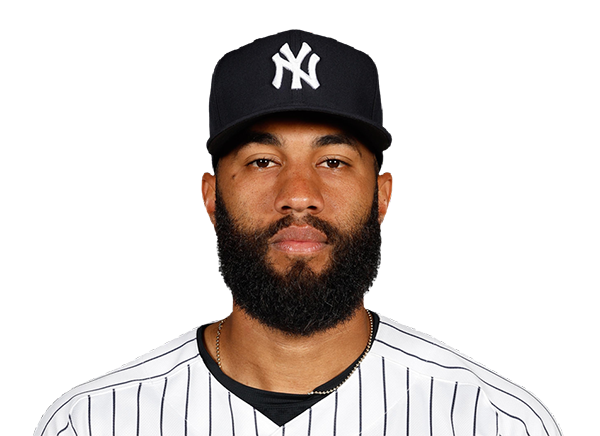 Amed Rosario | 2-5 | 5 | 2 | 2 | 3 | 1 | 0 | 0 | 16 | .262 | .289 | .548 |
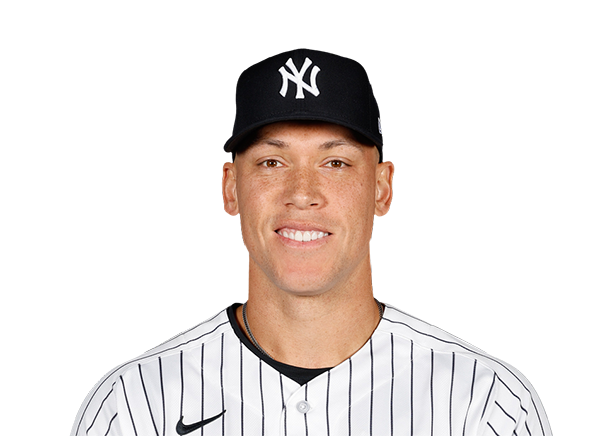 Aaron Judge | 0-2 | 2 | 1 | 0 | 0 | 0 | 2 | 2 | 21 | .234 | .337 | .584 |
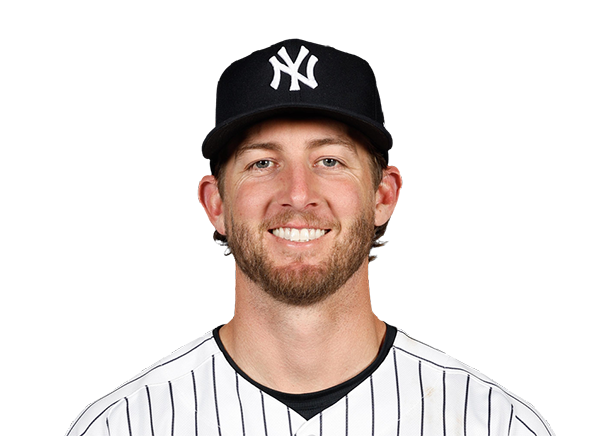 Ryan McMahon | 0-0 | 0 | 1 | 0 | 0 | 0 | 1 | 0 | 5 | .140 | .288 | .209 |
 Cody Bellinger | 3-4 | 4 | 2 | 3 | 5 | 2 | 1 | 0 | 12 | .274 | .368 | .452 |
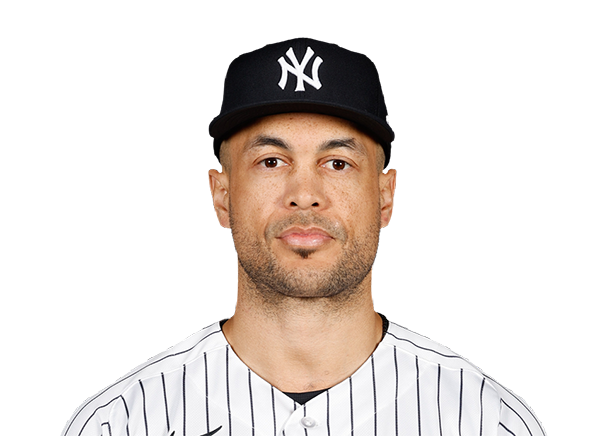 Giancarlo Stanton | 0-5 | 5 | 0 | 0 | 0 | 0 | 0 | 0 | 21 | .240 | .296 | .360 |
 Ben Rice | 1-3 | 3 | 1 | 1 | 1 | 1 | 2 | 0 | 24 | .339 | .468 | .774 |
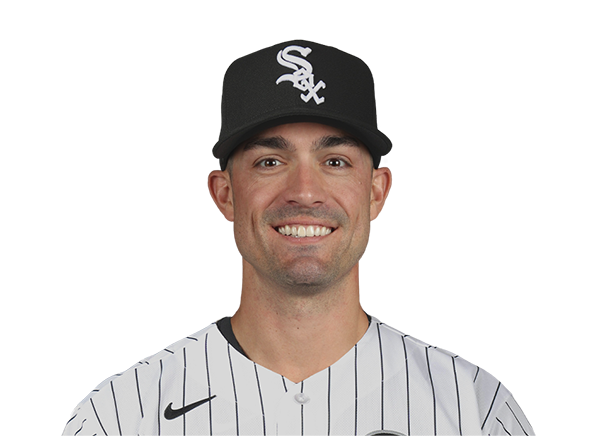 Randal Grichuk | 1-4 | 4 | 1 | 1 | 1 | 0 | 0 | 1 | 14 | .100 | .136 | .200 |
 Jazz Chisholm Jr. | 0-4 | 4 | 0 | 0 | 0 | 0 | 1 | 3 | 22 | .164 | .265 | .233 |
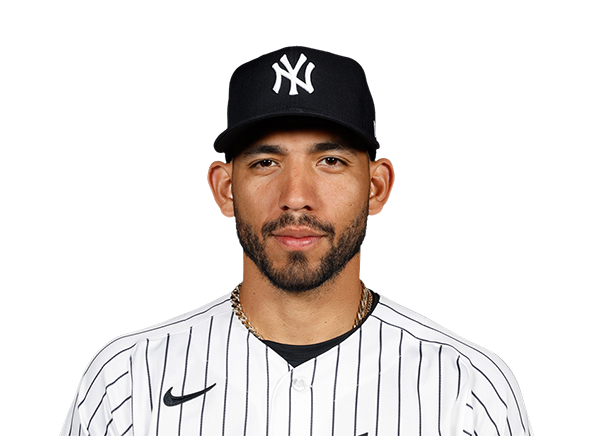 Jose Caballero | 2-4 | 4 | 3 | 2 | 0 | 0 | 0 | 0 | 7 | .232 | .284 | .333 |
 J.C. Escarra | 2-4 | 4 | 2 | 2 | 3 | 0 | 0 | 0 | 16 | .158 | .200 | .316 |
Kansas City Royals
| Player | IP | H | R | ER | BB | K | HR | PC-ST | ERA | PC |
|---|---|---|---|---|---|---|---|---|---|---|
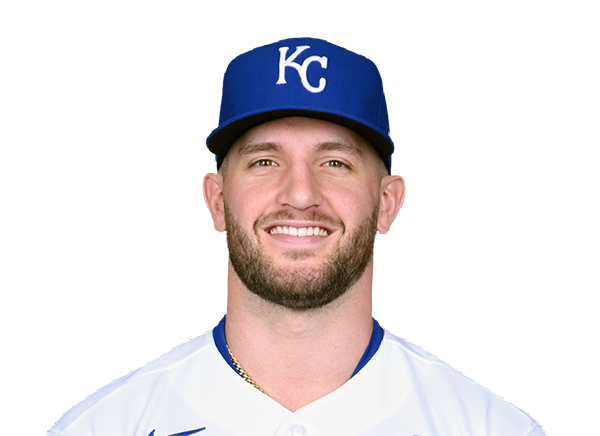 Noah Cameron | 4.0 | 7 | 7 | 5 | 2 | 3 | 3 | 74-39 | 5.40 | 74 |
 Mitch Spence | 4.0 | 4 | 6 | 6 | 5 | 3 | 1 | 84-46 | 13.50 | 84 |
New York Yankees
| Player | IP | H | R | ER | BB | K | HR | PC-ST | ERA | PC |
|---|---|---|---|---|---|---|---|---|---|---|
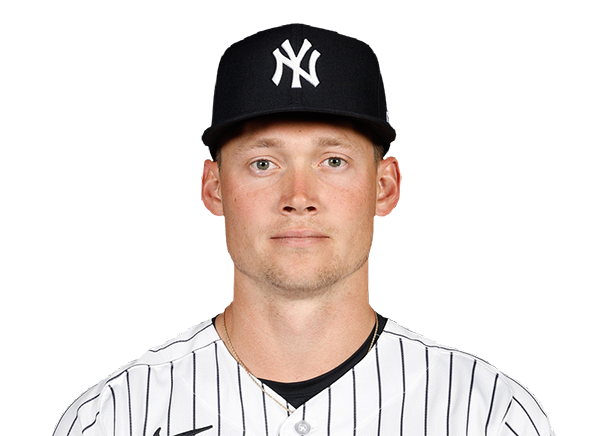 Will Warren | 7.0 | 5 | 2 | 2 | 0 | 11 | 1 | 93-62 | 2.49 | 93 |
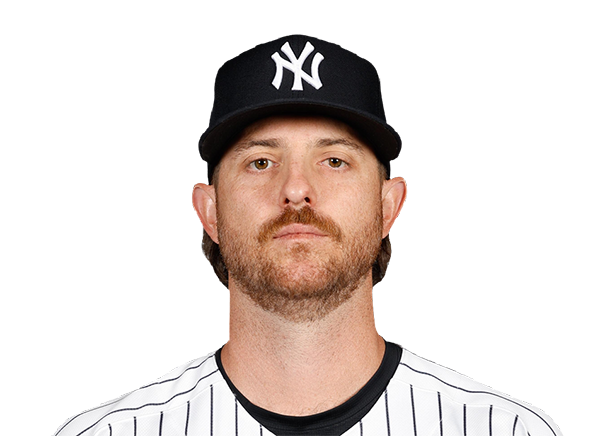 Paul Blackburn | 2.0 | 2 | 2 | 2 | 1 | 1 | 0 | 32-21 | 4.50 | 32 |
H2H / Season Series
KC0–7
NYY
KC1–15
NYY
KC3–4
NYY
NYY7–0
KC
NYY13–4
KC
NYY4–2
KC
Last 5 Games
| Date | Opponent | Result |
|---|---|---|
| Aug 22 |  vs DET | W3–1 |
| Aug 21 | vs DET | W5–2 |
| Aug 20 |  vs ATH | W6–2 |
| Aug 19 | vs ATH | W9–7 |
| Aug 18 | vs ATH | W4–3 |
| Date | Opponent | Result |
|---|---|---|
| Aug 22 |  vs TOR | L3–4 |
| Aug 21 | vs TOR | W3–1 |
| Aug 20 |  @ BAL | W6–1 |
| Aug 19 | @ BAL | W5–3 |
| Aug 18 | @ BAL | W3–1 |
Standings
American League
| Team | W | L | PCT | GB | DIFF | STRK |
|---|---|---|---|---|---|---|
1 Rays | 76 | 53 | .589 | - | +42 | L3 |
2 White Sox | 67 | 62 | .519 | 9 | +42 | L1 |
3 Astros | 65 | 65 | .500 | 11.5 | -43 | L1 |
| 4Yankees | 73 | 56 | .566 | 3 | +95 | L1 |
5 Red Sox | 70 | 59 | .543 | 6 | +98 | W2 |
6 Rangers | 64 | 66 | .492 | 12.5 | -48 | L1 |
7 Guardians | 64 | 66 | .492 | 12.5 | -14 | W3 |
| 8Blue Jays | 64 | 67 | .489 | 13 | -50 | W1 |
9 Twins | 63 | 67 | .485 | 13.5 | -47 | L2 |
| 10Orioles | 63 | 67 | .485 | 13.5 | -33 | W2 |
11 Mariners | 62 | 68 | .477 | 14.5 | -44 | W2 |
| 12Tigers | 61 | 68 | .473 | 15 | +77 | L4 |
| 13Royals | 57 | 74 | .435 | 20 | -95 | W7 |
14 Angels | 52 | 78 | .400 | 24.5 | -68 | W1 |
| 15Athletics | 50 | 80 | .385 | 26.5 | -188 | W1 |
National League
| Team | W | L | PCT | GB | DIFF | STRK |
|---|---|---|---|---|---|---|
1 Brewers | 81 | 49 | .623 | - | +163 | W3 |
2 Dodgers | 79 | 51 | .608 | 2 | +147 | W5 |
3 Braves | 75 | 55 | .577 | 6 | +108 | L2 |
4 Cubs | 74 | 56 | .569 | 7 | +98 | L3 |
5 Phillies | 72 | 58 | .554 | 9 | +25 | W8 |
6 Padres | 70 | 60 | .538 | 11 | +9 | W2 |
7 Diamondbacks | 68 | 62 | .523 | 13 | +7 | L1 |
8 Marlins | 66 | 64 | .508 | 15 | +17 | W2 |
9 Cardinals | 66 | 65 | .504 | 15.5 | 0 | L2 |
10 Pirates | 63 | 68 | .481 | 18.5 | +29 | L2 |
11 Reds | 62 | 68 | .477 | 19 | -92 | W1 |
12 Nationals | 61 | 70 | .466 | 20.5 | +14 | L3 |
13 Mets | 59 | 71 | .454 | 22 | -39 | W1 |
14 Giants | 52 | 77 | .403 | 28.5 | -79 | L3 |
15 Rockies | 50 | 79 | .388 | 30.5 | -131 | L5 |
KC
VS
NYY
Pitchers
Noah Cameron
Mitch Spence
Catchers
Carter Jensen
Infielders
Maikel Garcia
Jonathan India
Bobby Witt Jr.
Tyler Tolbert
Vinnie Pasquantino
Michael Massey
Outfielders
Jac Caglianone
Lane Thomas
Kyle Isbel
Designated Hitters
Isaac Collins
Pitchers
Will Warren
Paul Blackburn
Catchers
J.C. Escarra
Infielders
Ryan McMahon
Ben Rice
Jazz Chisholm Jr.
Jose Caballero
Outfielders
Amed Rosario
Aaron Judge
Cody Bellinger
Randal Grichuk
Designated Hitters
Giancarlo Stanton
Royals
VS
Yankees
Batting
131
Team Games Played
129
4380
At Bats
4255
1074
Hits
974
523
Runs Batted In
544
134
Home Runs
177
99
Stolen Bases
126
.245
Batting Average
.229
549
Runs
571
233
Doubles
190
18
Triples
16
1745
Total Bases
1727
406
Walks
469
1026
Strikeouts
1192
.313
On Base Percentage
.308
.398
Slugging Percentage
.406
.712
OBP Pct + SLG Pct
.714
131
Games Played
129
131
Games Started
129
46
Hit By Pitch
33
0.0
Wins Above Replacement
0.0
0.0
Offensive Wins Above Replacement
0.0
28
Caught Stealing
39
1
Is Qualified
1
558.4
Runs Created
547.8
4.3
Runs Created Per 27 Outs
4.3
.083
Walks Per Plate Appearance
.098
0.40
Walk To Strikeout Ratio
0.39
.153
Isolated Power
.177
.262
Secondary Average
.308
3.81
Pitches Per Plate Appearance
3.99
385
Extra Base Hits
383
4897
Plate Appearances
4798
32.7
At Bats Per Home Run
24.0
22
Sacrifice Hit
7
41
Sacrifice Flies
30
Pitching
131
Team Games Played
129
53
Quality Starts
52
57
Wins
73
74
Losses
56
33
Saves
39
63
Holds
71
1130
Hits
963
603
Earned runs
411
162
Home Runs
127
485
Walks
393
957
Strikeouts
1159
7.5
Strikeouts Per 9 Innings
9.0
147.2
Pitches Per Start
144.6
1.40
Walks Plus Hits Per Inning Pitched
1.18
4.71
Earned Run Average
3.21
74
Losses
56
1151.1
Innings pitched
1152.2
.435
Win Percentage
.566
56
Save Opportunities
62
.257
Opponent Batting Average
.225
.336
Opponent's On-base pct.
.295
.431
Opponent's Slugging pct.
.363
.767
Opponent's OPB Pct + SLG Pct
.658
4389
At Bats
4285
237
Doubles
181
20
Triples
16
49
Batters Hit
47
64
Stolen Bases
62
131
Games Played
129
2
Complete Games
0
7
Shutouts
12
46
Wild Pitches
29
613
Runs Batted In
455
3
Balks
3
1151.1
Innings pitched
1152.2
7.5
Strikeouts Per 9 Innings
9.0
33
Caught Stealing
18
131
Games Started
129
0.0
Wins Above Replacement
0.0
1
Is Qualified
1
644
Runs
476
603
Earned Runs
411
1893
Total Bases
1557
Fielding
131
Team Games Played
129
1151
Full Innings
1153
4700
Total Chances
4663
3454
Putouts
3458
1190
Assists
1135
56
Errors
70
233
Double Plays
190
0.988
Fielding Percentage
0.985
36.3
Range Factor
35.9
0.0
Zone Rating
0.0
131
Games Played
129
0
Games Started
0
0.0
Defensive Wins Above Replacement
0.0
1
Qualified
1