

Tigers vs Yankees Live Score (29 Jun, 2026)
Game Information
Stage
Standard
Season
2026
First Pitch
Mon, Jun 29, 7:05 pm
Venue
Yankee Stadium
Location
Bronx, New York
Attendance
40,506
Live Situation
0Balls
0Strikes
0Outs
—Pitcher
—At Bat
Pitch Sequence
1
BALL IN PLAY
Four-seam FB
97 MPH
Injury Report




Team Stats
 DET
NYY


7
Runs
3
11
Hits
3
0
Errors
2
0
Home Runs
1
2
Walks
1
9
Strikeouts
13
Player Box Score
Detroit Tigers
| Player | H-AB | AB | R | H | RBI | HR | BB | K | #P | AVG | OBP | SLG |
|---|---|---|---|---|---|---|---|---|---|---|---|---|
 Matt Vierling | 1-5 | 5 | 2 | 1 | 1 | 0 | 0 | 1 | 18 | .203 | .258 | .335 |
 Dillon Dingler | 1-4 | 4 | 2 | 1 | 1 | 0 | 0 | 2 | 24 | .262 | .326 | .528 |
 Kevin McGonigle | 2-4 | 4 | 1 | 2 | 2 | 0 | 0 | 2 | 19 | .284 | .397 | .422 |
 Spencer Torkelson | 1-4 | 4 | 0 | 1 | 1 | 0 | 1 | 1 | 22 | .214 | .314 | .416 |
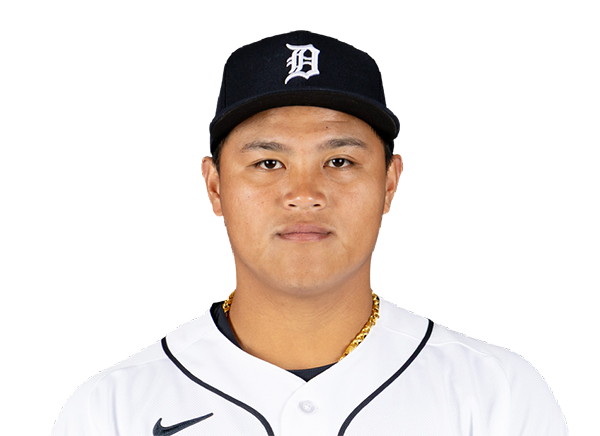 Hao-Yu Lee | 2-5 | 5 | 0 | 2 | 2 | 0 | 0 | 0 | 10 | .258 | .291 | .391 |
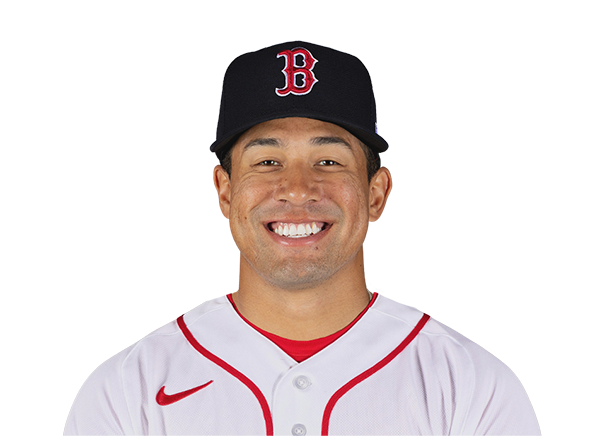 Jahmai Jones | 0-1 | 1 | 0 | 0 | 0 | 0 | 0 | 1 | 5 | .140 | .223 | .226 |
 Kerry Carpenter | 1-3 | 3 | 0 | 1 | 0 | 0 | 1 | 0 | 17 | .236 | .310 | .494 |
 Zach McKinstry | 2-5 | 5 | 1 | 2 | 0 | 0 | 0 | 0 | 13 | .197 | .282 | .298 |
 Ben Malgeri | 0-4 | 4 | 0 | 0 | 0 | 0 | 0 | 1 | 12 | .200 | .308 | .200 |
 James Outman | 1-4 | 4 | 1 | 1 | 0 | 0 | 0 | 1 | 10 | .194 | .286 | .387 |
New York Yankees
| Player | H-AB | AB | R | H | RBI | HR | BB | K | #P | AVG | OBP | SLG |
|---|---|---|---|---|---|---|---|---|---|---|---|---|
 Ben Rice | 0-4 | 4 | 0 | 0 | 0 | 0 | 0 | 3 | 15 | .269 | .358 | .558 |
 Cody Bellinger | 0-4 | 4 | 0 | 0 | 0 | 0 | 0 | 1 | 16 | .258 | .357 | .440 |
 Paul Goldschmidt | 0-4 | 4 | 0 | 0 | 0 | 0 | 0 | 2 | 17 | .284 | .345 | .538 |
 Jazz Chisholm Jr. | 0-1 | 1 | 0 | 0 | 0 | 0 | 0 | 1 | 4 | .222 | .305 | .398 |
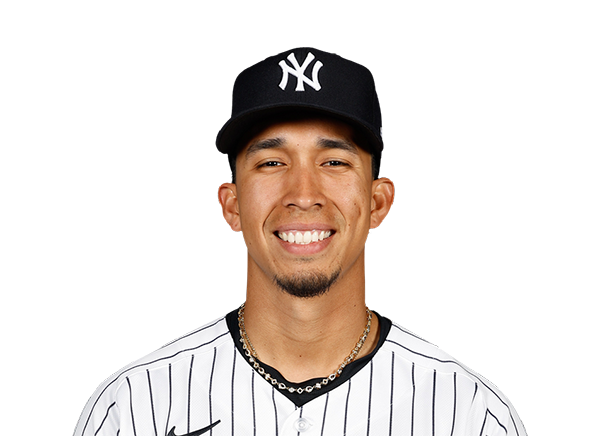 Oswaldo Cabrera | 0-3 | 3 | 0 | 0 | 0 | 0 | 0 | 2 | 10 | .000 | .000 | .000 |
 Jasson Dominguez | 0-2 | 2 | 1 | 0 | 0 | 0 | 1 | 0 | 15 | .209 | .253 | .395 |
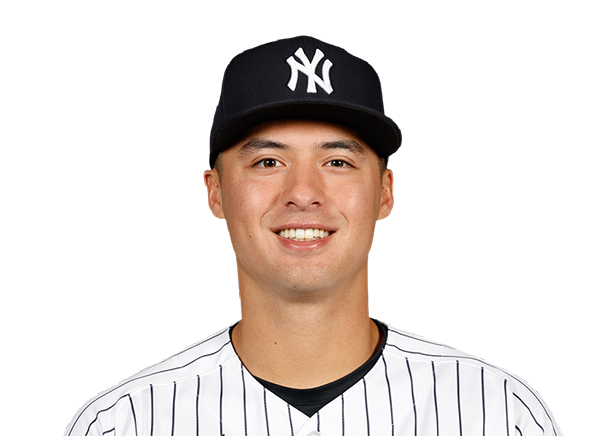 Anthony Volpe | 0-3 | 3 | 0 | 0 | 0 | 0 | 0 | 0 | 9 | .246 | .348 | .342 |
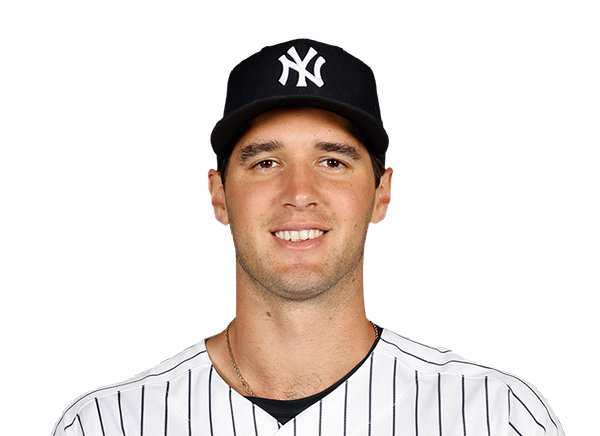 Spencer Jones | 2-3 | 3 | 1 | 2 | 0 | 0 | 0 | 0 | 6 | .235 | .325 | .382 |
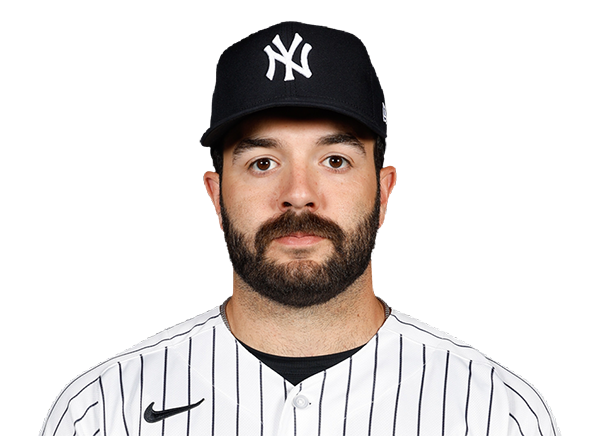 Austin Wells | 0-2 | 2 | 0 | 0 | 0 | 0 | 0 | 2 | 10 | .155 | .255 | .238 |
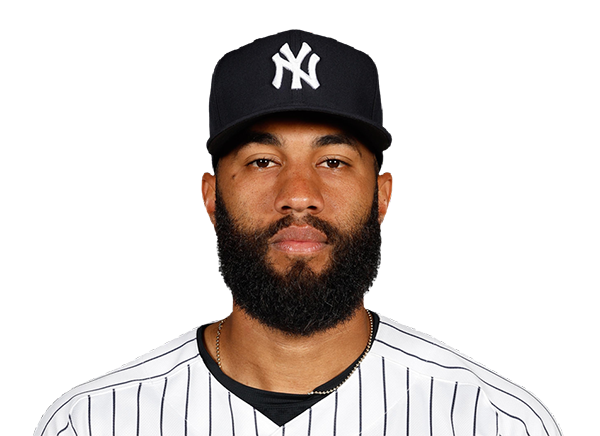 Amed Rosario | 1-1 | 1 | 1 | 1 | 3 | 1 | 0 | 0 | 6 | .258 | .299 | .485 |
 Ali Sanchez | 0-0 | 0 | 0 | 0 | 0 | 0 | 0 | 0 | 0 | .286 | .348 | .381 |
 Jose Caballero | 0-3 | 3 | 0 | 0 | 0 | 0 | 0 | 2 | 11 | .249 | .308 | .392 |
Detroit Tigers
| Player | IP | H | R | ER | BB | K | HR | PC-ST | ERA | PC |
|---|---|---|---|---|---|---|---|---|---|---|
 Casey Mize | 7.0 | 1 | 0 | 0 | 0 | 10 | 0 | 88-58 | 2.63 | 88 |
 Drew Sommers | 1.0 | 2 | 3 | 3 | 1 | 2 | 1 | 23-13 | 3.38 | 23 |
 Drew Anderson | 1.0 | 0 | 0 | 0 | 0 | 1 | 0 | 8-6 | 4.09 | 8 |
New York Yankees
| Player | IP | H | R | ER | BB | K | HR | PC-ST | ERA | PC |
|---|---|---|---|---|---|---|---|---|---|---|
 Ryan Weathers | 1.2 | 7 | 5 | 2 | 1 | 3 | 0 | 55-35 | 4.08 | 55 |
 Yerry De los Santos | 2.0 | 2 | 2 | 0 | 0 | 0 | 0 | 29-20 | 1.04 | 29 |
 Tim Hill | 1.1 | 0 | 0 | 0 | 0 | 0 | 0 | 9-6 | 4.02 | 9 |
 Jake Bird | 1.1 | 0 | 0 | 0 | 0 | 2 | 0 | 14-10 | 4.62 | 14 |
 Ryan Yarbrough | 0.2 | 1 | 0 | 0 | 1 | 1 | 0 | 19-12 | 3.94 | 19 |
 Camilo Doval | 1.0 | 0 | 0 | 0 | 0 | 3 | 0 | 15-12 | 4.55 | 15 |
 Brent Headrick | 1.0 | 1 | 0 | 0 | 0 | 0 | 0 | 9-8 | 1.58 | 9 |
H2H / Season Series
NYY2–6
DET
NYY3–9
DET
NYY3–7
DET
DET2–4
NYY
DET3–4
NYY
DET5–3
NYY
DET3–1
NYY
NYY1–12
DET
DET3–4
NYY
NYY20–3
DET
Last 5 Games
| Date | Opponent | Result |
|---|---|---|
| Aug 22 |  @ KC | L1–3 |
| Aug 21 | @ KC | L2–5 |
| Aug 19 |  @ PIT | L3–4 |
| Aug 18 | @ PIT | L1–4 |
| Aug 17 | @ PIT | W8–5 |
| Date | Opponent | Result |
|---|---|---|
| Aug 22 |  vs TOR | L3–4 |
| Aug 21 | vs TOR | W3–1 |
| Aug 20 |  @ BAL | W6–1 |
| Aug 19 | @ BAL | W5–3 |
| Aug 18 | @ BAL | W3–1 |
Standings
American League
| Team | W | L | PCT | GB | DIFF | STRK |
|---|---|---|---|---|---|---|
1 Rays | 76 | 53 | .589 | - | +42 | L3 |
2 White Sox | 67 | 62 | .519 | 9 | +42 | L1 |
3 Astros | 65 | 65 | .500 | 11.5 | -43 | L1 |
| 4Yankees | 73 | 56 | .566 | 3 | +95 | L1 |
5 Red Sox | 70 | 59 | .543 | 6 | +98 | W2 |
6 Rangers | 64 | 66 | .492 | 12.5 | -48 | L1 |
7 Guardians | 64 | 66 | .492 | 12.5 | -14 | W3 |
| 8Blue Jays | 64 | 67 | .489 | 13 | -50 | W1 |
9 Twins | 63 | 67 | .485 | 13.5 | -47 | L2 |
| 10Orioles | 63 | 67 | .485 | 13.5 | -33 | W2 |
11 Mariners | 62 | 68 | .477 | 14.5 | -44 | W2 |
| 12Tigers | 61 | 68 | .473 | 15 | +77 | L4 |
| 13Royals | 57 | 74 | .435 | 20 | -95 | W7 |
14 Angels | 52 | 78 | .400 | 24.5 | -68 | W1 |
15 Athletics | 50 | 80 | .385 | 26.5 | -188 | W1 |
National League
| Team | W | L | PCT | GB | DIFF | STRK |
|---|---|---|---|---|---|---|
1 Brewers | 81 | 49 | .623 | - | +163 | W3 |
2 Dodgers | 79 | 51 | .608 | 2 | +147 | W5 |
3 Braves | 75 | 55 | .577 | 6 | +108 | L2 |
4 Cubs | 74 | 56 | .569 | 7 | +98 | L3 |
5 Phillies | 72 | 58 | .554 | 9 | +25 | W8 |
6 Padres | 70 | 60 | .538 | 11 | +9 | W2 |
7 Diamondbacks | 68 | 62 | .523 | 13 | +7 | L1 |
8 Marlins | 66 | 64 | .508 | 15 | +17 | W2 |
9 Cardinals | 66 | 65 | .504 | 15.5 | 0 | L2 |
| 10Pirates | 63 | 68 | .481 | 18.5 | +29 | L2 |
11 Reds | 62 | 68 | .477 | 19 | -92 | W1 |
12 Nationals | 61 | 70 | .466 | 20.5 | +14 | L3 |
13 Mets | 59 | 71 | .454 | 22 | -39 | W1 |
14 Giants | 52 | 77 | .403 | 28.5 | -79 | L3 |
15 Rockies | 50 | 79 | .388 | 30.5 | -131 | L5 |
DET
VS
NYY
Pitchers
Casey Mize
Drew Sommers
Drew Anderson
Catchers
Dillon Dingler
Infielders
Kevin McGonigle
Spencer Torkelson
Hao-Yu Lee
Zach McKinstry
Outfielders
Matt Vierling
Ben Malgeri
James Outman
Designated Hitters
Jahmai Jones
Kerry Carpenter
Pitchers
Ryan Weathers
Yerry De los Santos
Tim Hill
Jake Bird
Ryan Yarbrough
Camilo Doval
Brent Headrick
Catchers
Austin Wells
Ali Sanchez
Infielders
Paul Goldschmidt
Jazz Chisholm Jr.
Oswaldo Cabrera
Anthony Volpe
Jose Caballero
Outfielders
Cody Bellinger
Jasson Dominguez
Spencer Jones
Designated Hitters
Ben Rice
Other Players
Amed Rosario
Tigers
VS
Yankees
Batting
129
Team Games Played
129
4352
At Bats
4255
1050
Hits
974
553
Runs Batted In
544
153
Home Runs
177
36
Stolen Bases
126
.241
Batting Average
.229
580
Runs
571
197
Doubles
190
26
Triples
16
1758
Total Bases
1727
460
Walks
469
1102
Strikeouts
1192
.318
On Base Percentage
.308
.404
Slugging Percentage
.406
.722
OBP Pct + SLG Pct
.714
129
Games Played
129
0
Games Started
0
49
Hit By Pitch
33
0.0
Wins Above Replacement
0.0
0.0
Offensive Wins Above Replacement
0.0
18
Caught Stealing
39
1
Is Qualified
1
569.7
Runs Created
547.8
4.5
Runs Created Per 27 Outs
4.3
.094
Walks Per Plate Appearance
.098
0.42
Walk To Strikeout Ratio
0.39
.163
Isolated Power
.177
.273
Secondary Average
.308
3.92
Pitches Per Plate Appearance
3.99
376
Extra Base Hits
383
4909
Plate Appearances
4798
28.4
At Bats Per Home Run
24.0
6
Sacrifice Hit
7
37
Sacrifice Flies
30
Pitching
129
Team Games Played
129
48
Quality Starts
52
61
Wins
73
68
Losses
56
26
Saves
39
60
Holds
71
987
Hits
963
451
Earned runs
411
132
Home Runs
127
396
Walks
393
1055
Strikeouts
1159
8.3
Strikeouts Per 9 Innings
9.0
0.0
Pitches Per Start
0.0
1.21
Walks Plus Hits Per Inning Pitched
1.18
3.56
Earned Run Average
3.21
68
Losses
56
1141.1
Innings pitched
1152.2
.473
Win Percentage
.566
54
Save Opportunities
62
.231
Opponent Batting Average
.225
.303
Opponent's On-base pct.
.295
.377
Opponent's Slugging pct.
.363
.680
Opponent's OPB Pct + SLG Pct
.658
4277
At Bats
4285
193
Doubles
181
18
Triples
16
55
Batters Hit
47
71
Stolen Bases
62
129
Games Played
129
0
Complete Games
0
0
Shutouts
0
29
Wild Pitches
29
0
Runs Batted In
0
3
Balks
4
1141.1
Innings pitched
1152.2
8.3
Strikeouts Per 9 Innings
9.0
25
Caught Stealing
18
129
Games Started
129
0.0
Wins Above Replacement
0.0
1
Is Qualified
1
503
Runs
476
448
Earned Runs
407
1612
Total Bases
1557
Fielding
129
Team Games Played
129
1141
Full Innings
1153
4621
Total Chances
4663
3424
Putouts
3458
1138
Assists
1135
59
Errors
70
197
Double Plays
190
0.987
Fielding Percentage
0.985
36.0
Range Factor
35.9
0.0
Zone Rating
0.0
129
Games Played
129
0
Games Started
0
0.0
Defensive Wins Above Replacement
0.0
1
Qualified
1