

White Sox vs Astros Live Score (30 Sep, 2026)
Game Information
Stage
RD16
Season
2026
First Pitch
Wed, Sep 30, 5:00 pm
Venue
Daikin Park
Location
Houston, Texas
Venue Type
Indoor
Broadcast
Peacock
Attendance
36,015
Live Situation
2Balls
3Strikes
0Outs
—Pitcher
—At Bat
Pitch Sequence
1
BALL
Cutter
94 MPH
2
BALL
Sinker
97 MPH
3
STRIKE LOOKING
Sweeper
83 MPH
4
STRIKE FOUL
Sinker
96 MPH
5
STRIKE FOUL
Sweeper
83 MPH
6
STRIKE FOUL
Sinker
95 MPH
7
STRIKE FOUL
Sweeper
83 MPH
8
STRIKE SWINGING
Sweeper
83 MPH
Injury Report






Team Stats
 CHW
HOU


7
Runs
3
8
Hits
5
0
Errors
2
1
Home Runs
3
4
Walks
1
13
Strikeouts
15
Player Box Score
Chicago White Sox
| Player | H-AB | AB | R | H | RBI | HR | BB | K | #P | AVG | OBP | SLG |
|---|---|---|---|---|---|---|---|---|---|---|---|---|
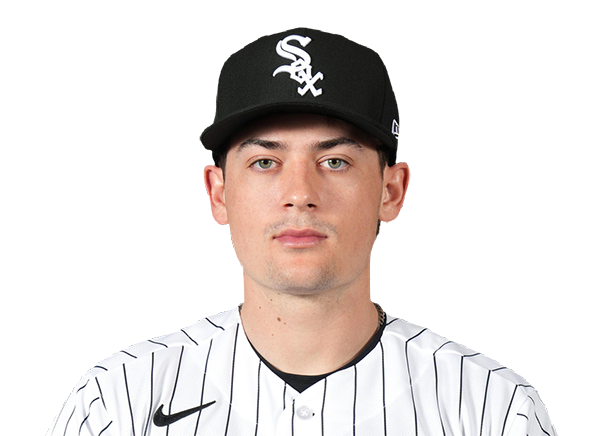 Sam Antonacci | 1-4 | 4 | 1 | 1 | 0 | 0 | 0 | 1 | 14 | .286 | .444 | .429 |
 Brenton Doyle | 1-1 | 1 | 0 | 1 | 0 | 0 | 0 | 0 | 3 | 1.000 | 1.000 | 1.000 |
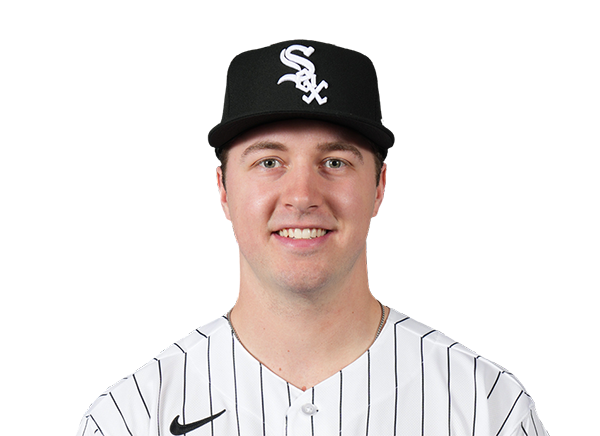 Kyle Teel | 2-5 | 5 | 1 | 2 | 1 | 0 | 0 | 3 | 18 | .300 | .300 | .300 |
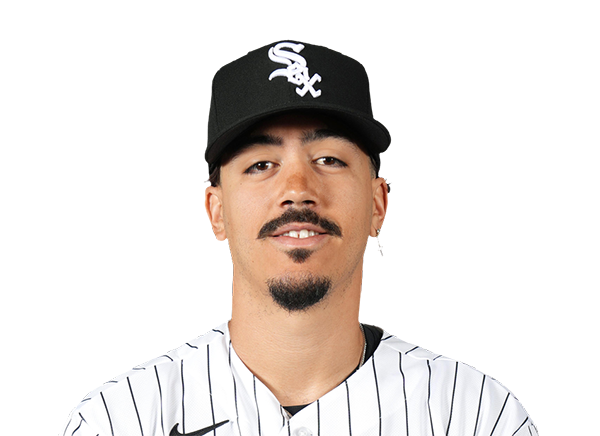 Miguel Vargas | 0-5 | 5 | 1 | 0 | 0 | 0 | 0 | 2 | 23 | .000 | .100 | .000 |
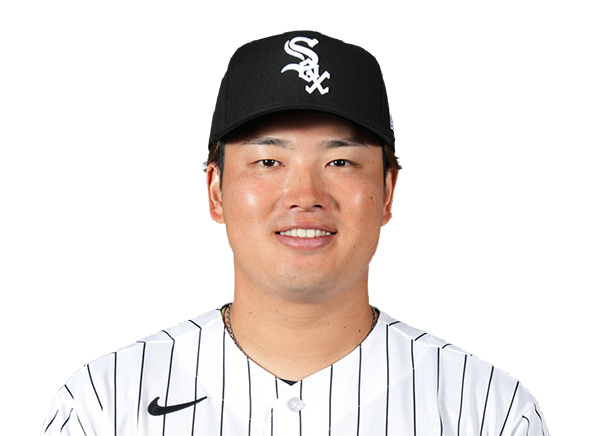 Munetaka Murakami | 0-5 | 5 | 0 | 0 | 0 | 0 | 0 | 3 | 24 | .125 | .200 | .125 |
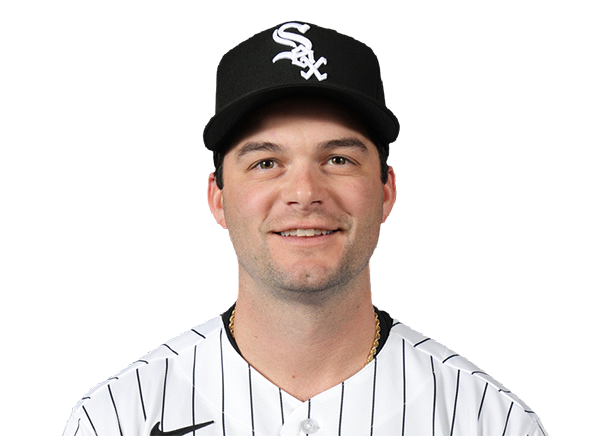 Andrew Benintendi | 1-2 | 2 | 1 | 1 | 1 | 0 | 1 | 0 | 13 | .333 | .600 | .333 |
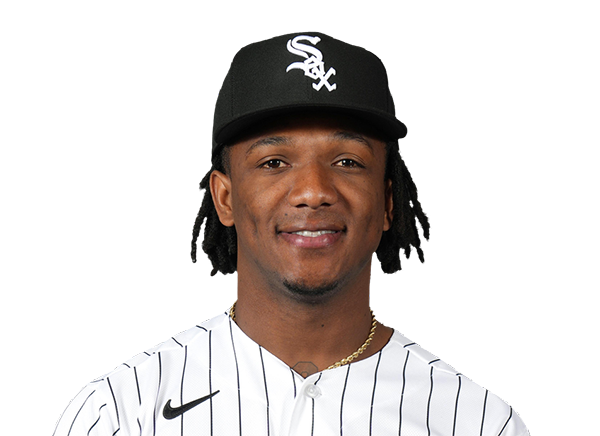 Luisangel Acuna | 0-1 | 1 | 1 | 0 | 0 | 0 | 0 | 0 | 2 | .000 | .000 | .000 |
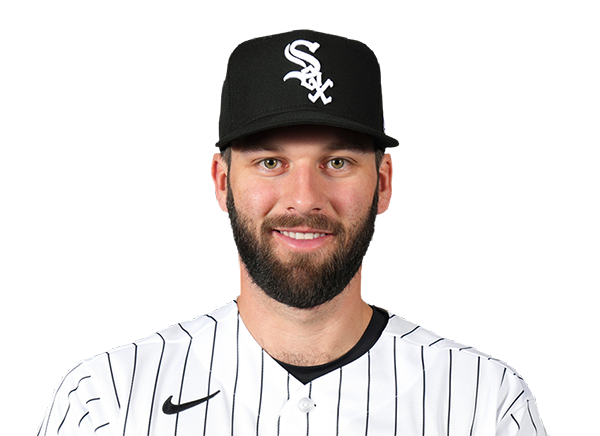 Tristan Peters | 1-3 | 3 | 1 | 1 | 1 | 0 | 1 | 1 | 17 | .286 | .375 | .286 |
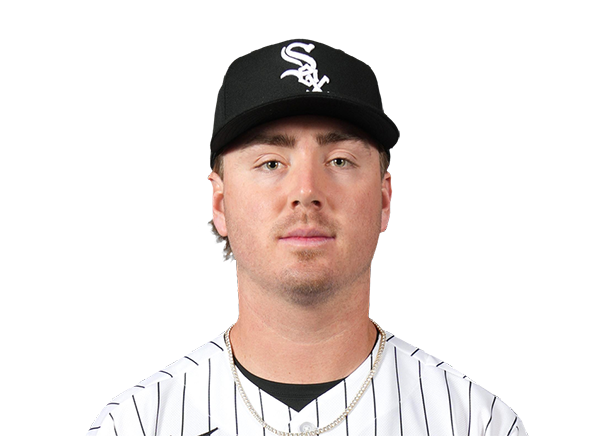 Chase Meidroth | 2-3 | 3 | 1 | 2 | 3 | 1 | 1 | 0 | 24 | .571 | .625 | 1.000 |
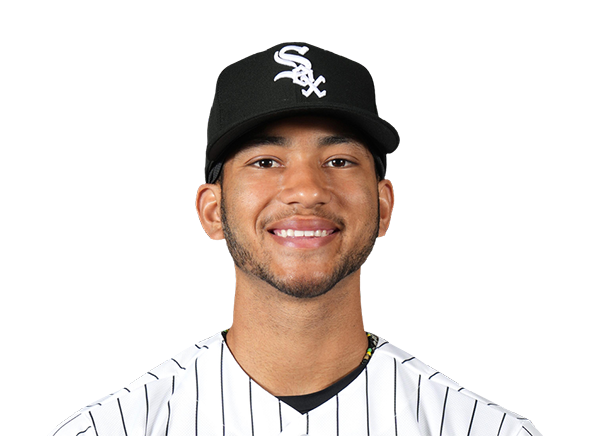 Braden Montgomery | 0-4 | 4 | 0 | 0 | 0 | 0 | 0 | 1 | 9 | .250 | .250 | .250 |
 Colson Montgomery | 0-3 | 3 | 0 | 0 | 0 | 0 | 1 | 2 | 18 | .167 | .375 | .667 |
Houston Astros
| Player | H-AB | AB | R | H | RBI | HR | BB | K | #P | AVG | OBP | SLG |
|---|---|---|---|---|---|---|---|---|---|---|---|---|
 Jeremy Pena | 2-4 | 4 | 1 | 2 | 1 | 1 | 0 | 2 | 17 | .375 | .375 | .750 |
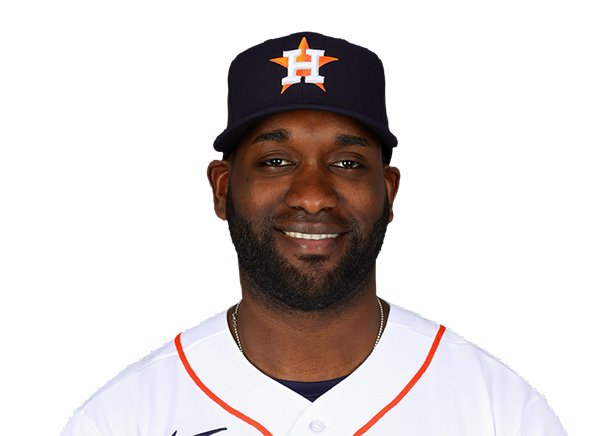 Yordan Alvarez | 0-4 | 4 | 0 | 0 | 0 | 0 | 0 | 2 | 19 | .125 | .125 | .125 |
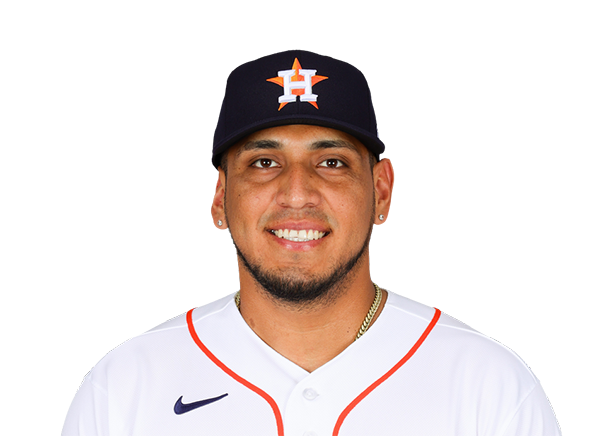 Isaac Paredes | 0-2 | 2 | 0 | 0 | 0 | 0 | 1 | 1 | 24 | .167 | .375 | .167 |
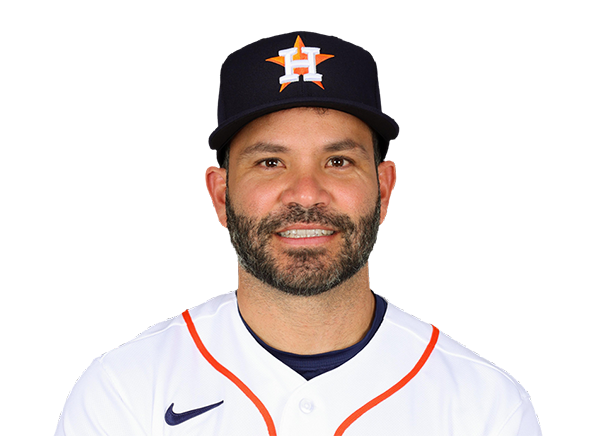 Jose Altuve | 2-4 | 4 | 1 | 2 | 1 | 1 | 0 | 1 | 12 | .250 | .250 | .625 |
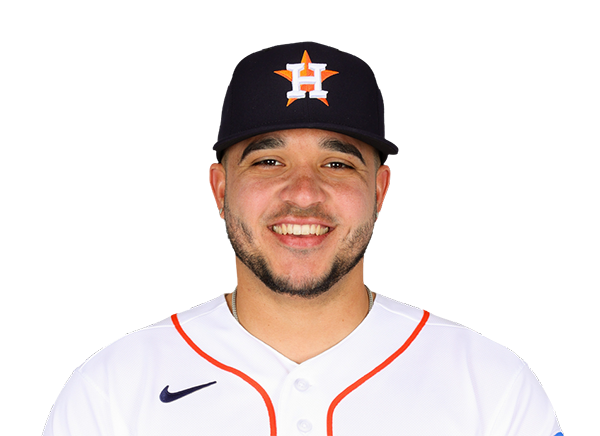 Yainer Diaz | 0-4 | 4 | 0 | 0 | 0 | 0 | 0 | 2 | 16 | .000 | .000 | .000 |
 Christian Walker | 0-4 | 4 | 0 | 0 | 0 | 0 | 0 | 3 | 20 | .000 | .250 | .000 |
 Lucas Spence | 0-4 | 4 | 0 | 0 | 0 | 0 | 0 | 1 | 17 | .125 | .125 | .125 |
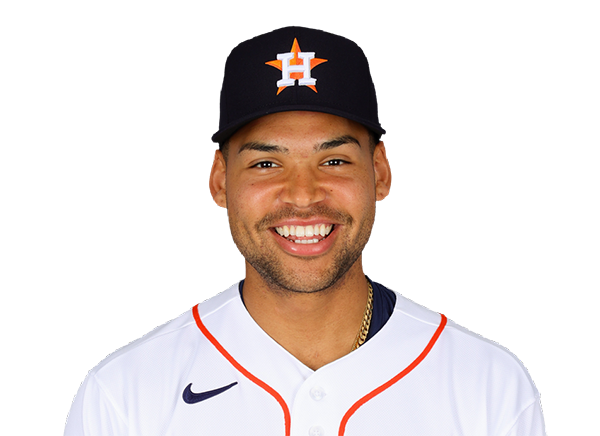 Cam Smith | 1-3 | 3 | 1 | 1 | 1 | 1 | 0 | 2 | 20 | .286 | .375 | .714 |
 Nick Allen | 0-3 | 3 | 0 | 0 | 0 | 0 | 0 | 1 | 9 | .000 | .000 | .000 |
Chicago White Sox
| Player | IP | H | R | ER | BB | K | HR | PC-ST | ERA | PC |
|---|---|---|---|---|---|---|---|---|---|---|
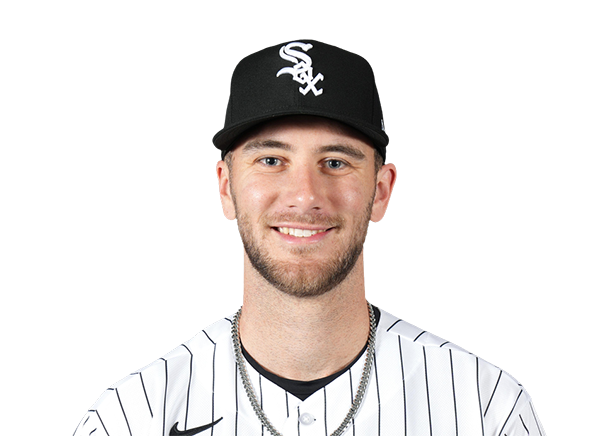 Sean Burke | 4.0 | 4 | 3 | 3 | 0 | 8 | 3 | 72-48 | 6.75 | 72 |
 Huascar Brazoban | 0.1 | 1 | 0 | 0 | 0 | 1 | 0 | 16-9 | 0.00 | 16 |
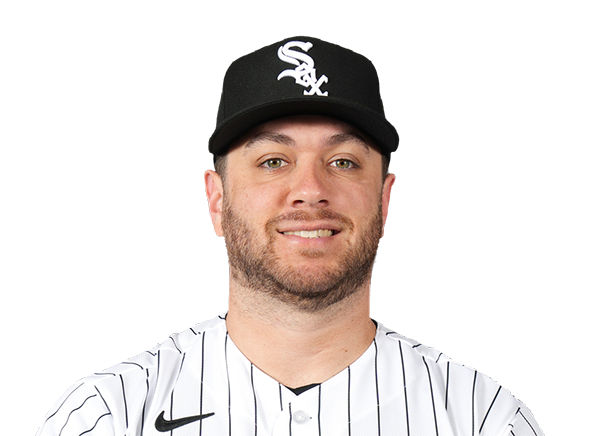 Anthony Kay | 0.2 | 0 | 0 | 0 | 1 | 0 | 0 | 11-4 | 0.00 | 11 |
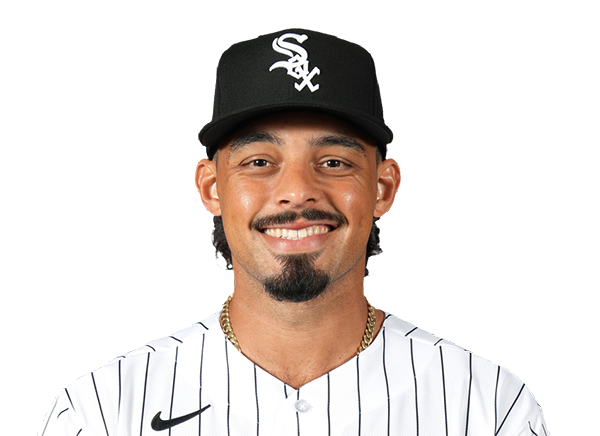 Jordan Hicks | 2.0 | 0 | 0 | 0 | 0 | 3 | 0 | 21-13 | 0.00 | 21 |
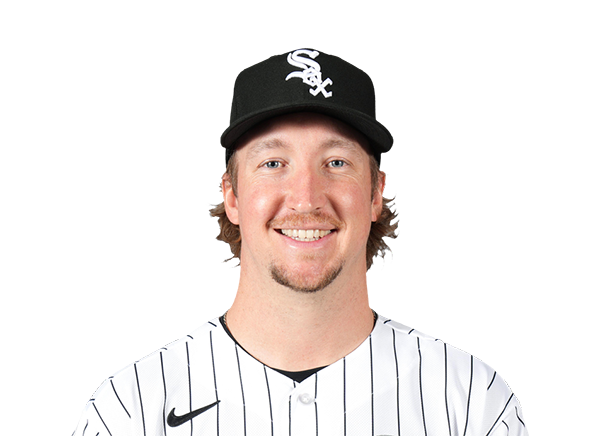 Erick Fedde | 2.0 | 0 | 0 | 0 | 0 | 3 | 0 | 34-20 | 0.00 | 34 |
Houston Astros
| Player | IP | H | R | ER | BB | K | HR | PC-ST | ERA | PC |
|---|---|---|---|---|---|---|---|---|---|---|
 Hunter Brown | 0.2 | 5 | 4 | 3 | 1 | 2 | 0 | 36-22 | 40.50 | 36 |
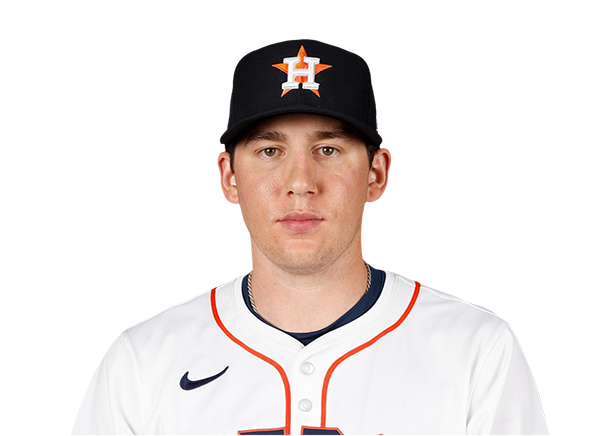 AJ Blubaugh | 1.1 | 0 | 0 | 0 | 0 | 2 | 0 | 15-11 | 0.00 | 15 |
 Peter Lambert | 3.0 | 0 | 2 | 2 | 2 | 2 | 0 | 48-28 | 6.00 | 48 |
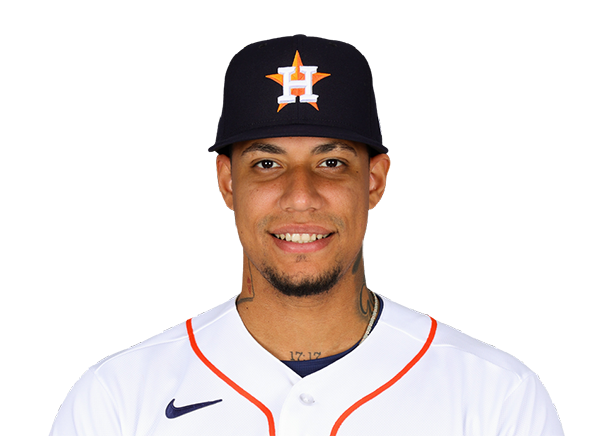 Bryan Abreu | 2.2 | 1 | 1 | 1 | 1 | 6 | 1 | 44-28 | 2.45 | 44 |
 Josh Hader | 1.1 | 2 | 0 | 0 | 0 | 1 | 0 | 22-16 | 0.00 | 22 |
H2H / Season Series
HOU3–7
CHW
HOU3–6
CHW
HOU6–2
CHW
HOU2–0
CHW
HOU1–5
CHW
HOU6–3
CHW
CHW12–3
HOU
CHW1–4
HOU
CHW5–9
HOU
Last 5 Games
| Date | Opponent | Result |
|---|---|---|
| Sep 30 | @ HOU | W7–3 |
| Sep 29 | @ HOU | W6–3 |
| Date | Opponent | Result |
|---|---|---|
| Sep 30 | vs CHW | L3–7 |
| Sep 29 | vs CHW | L3–6 |
Standings
American League
| Team | W | L | PCT | GB | DIFF | STRK |
|---|---|---|---|---|---|---|
1 Rays | 98 | 64 | .605 | - | +86 | L1 |
2 Guardians | 85 | 77 | .525 | 13 | +11 | L1 |
| 3Astros | 81 | 81 | .500 | 17 | -32 | W2 |
4 Yankees | 93 | 68 | .578 | 4.5 | +138 | W1 |
5 Red Sox | 87 | 75 | .537 | 11 | +78 | L1 |
| 6White Sox | 84 | 78 | .519 | 14 | +56 | W1 |
7 Rangers | 80 | 82 | .494 | 18 | -46 | L1 |
8 Orioles | 79 | 82 | .491 | 18.5 | -21 | L1 |
9 Blue Jays | 79 | 83 | .488 | 19 | -46 | W1 |
10 Twins | 77 | 85 | .475 | 21 | -58 | W1 |
11 Tigers | 76 | 86 | .469 | 22 | +71 | L1 |
12 Mariners | 76 | 86 | .469 | 22 | -58 | W2 |
13 Royals | 69 | 93 | .426 | 29 | -120 | W1 |
14 Athletics | 64 | 98 | .395 | 34 | -238 | L2 |
15 Angels | 62 | 100 | .383 | 36 | -97 | L2 |
National League
| Team | W | L | PCT | GB | DIFF | STRK |
|---|---|---|---|---|---|---|
1 Brewers | 103 | 59 | .636 | - | +214 | W5 |
2 Dodgers | 100 | 62 | .617 | 3 | +201 | W3 |
3 Braves | 94 | 68 | .580 | 9 | +116 | L1 |
4 Padres | 91 | 71 | .562 | 12 | +41 | W2 |
5 Cubs | 89 | 73 | .549 | 14 | +147 | W1 |
6 Phillies | 88 | 74 | .543 | 15 | +15 | W1 |
7 Diamondbacks | 86 | 76 | .531 | 17 | +9 | L2 |
8 Pirates | 82 | 80 | .506 | 21 | +28 | W1 |
9 Marlins | 80 | 82 | .494 | 23 | +3 | W1 |
10 Cardinals | 77 | 85 | .475 | 26 | -29 | L4 |
11 Nationals | 77 | 85 | .475 | 26 | +6 | W1 |
12 Reds | 75 | 87 | .463 | 28 | -160 | L1 |
13 Mets | 74 | 88 | .457 | 29 | -32 | L1 |
14 Giants | 65 | 97 | .401 | 38 | -91 | L5 |
15 Rockies | 58 | 104 | .358 | 45 | -192 | L1 |
CHW
VS
HOU
Pitchers
Sean Burke
Catchers
Kyle Teel
Infielders
Miguel Vargas
Munetaka Murakami
Chase Meidroth
Colson Montgomery
Outfielders
Sam Antonacci
Tristan Peters
Braden Montgomery
Designated Hitters
Andrew Benintendi
Pitchers
Hunter Brown
Catchers
Yainer Diaz
Infielders
Jeremy Pena
Jose Altuve
Christian Walker
Nick Allen
Outfielders
Yordan Alvarez
Lucas Spence
Cam Smith
Designated Hitters
Isaac Paredes
White Sox
VS
Astros
Batting
2
Team Games Played
2
70
At Bats
65
19
Hits
11
11
Runs Batted In
5
2
Home Runs
4
3
Stolen Bases
0
.271
Batting Average
.169
13
Runs
6
1
Doubles
0
0
Triples
0
26
Total Bases
23
8
Walks
3
21
Strikeouts
22
.358
On Base Percentage
.229
.371
Slugging Percentage
.354
.729
OBP Pct + SLG Pct
.582
2
Games Played
2
2
Games Started
2
2
Hit By Pitch
2
0.0
Wins Above Replacement
0.0
0.0
Offensive Wins Above Replacement
0.0
0
Caught Stealing
0
1
Is Qualified
1
9.8
Runs Created
5.3
4.7
Runs Created Per 27 Outs
2.6
.098
Walks Per Plate Appearance
.042
0.38
Walk To Strikeout Ratio
0.14
.100
Isolated Power
.185
.257
Secondary Average
.231
3.90
Pitches Per Plate Appearance
4.28
3
Extra Base Hits
4
82
Plate Appearances
71
35.0
At Bats Per Home Run
16.3
1
Sacrifice Hit
1
1
Sacrifice Flies
0
Pitching
2
Team Games Played
2
0
Quality Starts
0
2
Wins
0
0
Losses
2
0
Saves
0
1
Holds
0
11
Hits
19
5
Earned runs
11
4
Home Runs
2
3
Walks
8
22
Strikeouts
21
11.0
Strikeouts Per 9 Innings
10.5
152.0
Pitches Per Start
160.0
0.78
Walks Plus Hits Per Inning Pitched
1.50
2.50
Earned Run Average
5.50
0
Losses
2
18.0
Innings pitched
18.0
1.000
Win Percentage
.000
0
Save Opportunities
0
.169
Opponent Batting Average
.271
.229
Opponent's On-base pct.
.358
.354
Opponent's Slugging pct.
.371
.582
Opponent's OPB Pct + SLG Pct
.729
65
At Bats
70
0
Doubles
1
0
Triples
0
2
Batters Hit
2
0
Stolen Bases
3
2
Games Played
2
0
Complete Games
0
0
Shutouts
0
0
Wild Pitches
3
5
Runs Batted In
11
0
Balks
0
18.0
Innings pitched
18.0
11.0
Strikeouts Per 9 Innings
10.5
0
Caught Stealing
0
2
Games Started
2
0.0
Wins Above Replacement
0.0
1
Is Qualified
1
6
Runs
13
5
Earned Runs
11
23
Total Bases
26
Fielding
2
Team Games Played
2
162
Full Innings
162
70
Total Chances
72
54
Putouts
54
15
Assists
15
1
Errors
3
0
Double Plays
7
0.986
Fielding Percentage
0.958
3.8
Range Factor
3.8
0.0
Zone Rating
0.0
2
Games Played
2
0
Games Started
0
0.0
Defensive Wins Above Replacement
0.0
1
Qualified
1