

Yankees vs Giants Live Score (28 Mar, 2026)
Game Information
Stage
Standard
Season
2026
First Pitch
Sat, Mar 28, 7:15 pm
Venue
Oracle Park
Location
San Francisco, California
Attendance
40,634
Live Situation
0Balls
1Strikes
0Outs
—Pitcher
—At Bat
Pitch Sequence
1
STRIKE SWINGING
Curve
77 MPH
2
BALL IN PLAY
Splitter
93 MPH
Injury Report


Team Stats
 NYY
SF


3
Runs
1
7
Hits
9
0
Errors
0
1
Home Runs
0
2
Walks
3
10
Strikeouts
8
Player Box Score
New York Yankees
| Player | H-AB | AB | R | H | RBI | HR | BB | K | #P | AVG | OBP | SLG |
|---|---|---|---|---|---|---|---|---|---|---|---|---|
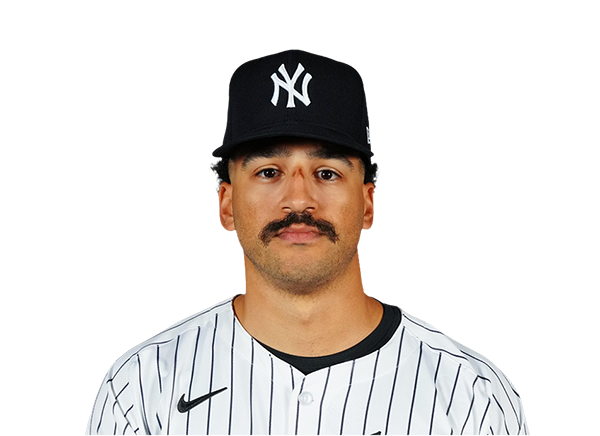 Trent Grisham | 1-3 | 3 | 1 | 1 | 0 | 0 | 1 | 0 | 19 | .222 | .364 | .444 |
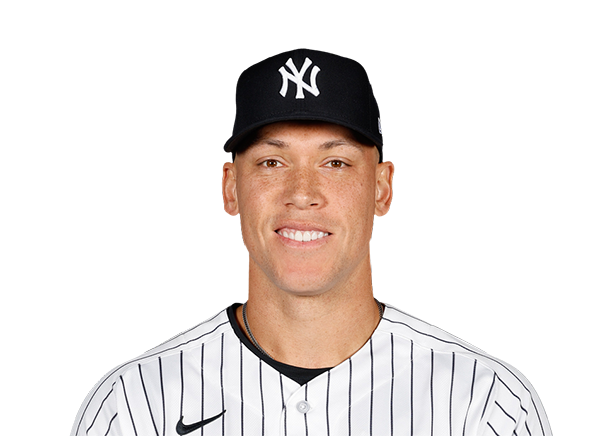 Aaron Judge | 1-4 | 4 | 1 | 1 | 1 | 1 | 0 | 1 | 19 | .154 | .154 | .615 |
 Cody Bellinger | 2-3 | 3 | 1 | 2 | 0 | 0 | 1 | 0 | 15 | .364 | .462 | .545 |
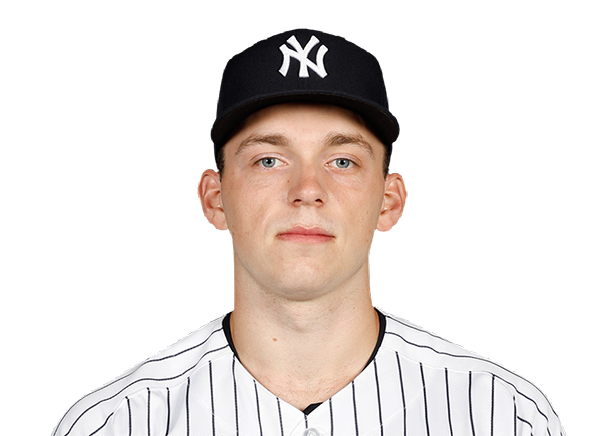 Ben Rice | 1-4 | 4 | 0 | 1 | 2 | 0 | 0 | 1 | 15 | .250 | .333 | .375 |
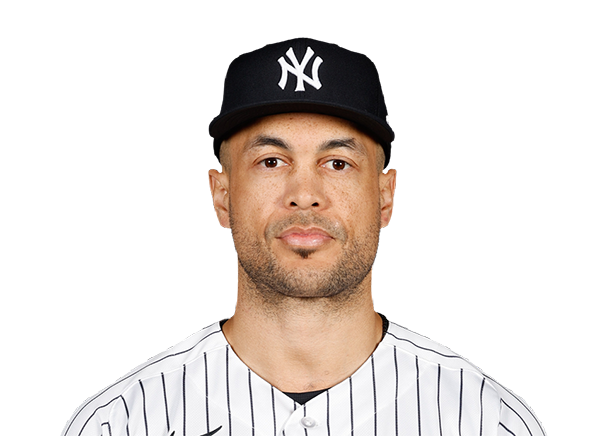 Giancarlo Stanton | 2-4 | 4 | 0 | 2 | 0 | 0 | 0 | 1 | 17 | .500 | .500 | .750 |
 Jazz Chisholm Jr. | 0-4 | 4 | 0 | 0 | 0 | 0 | 0 | 2 | 23 | .182 | .250 | .182 |
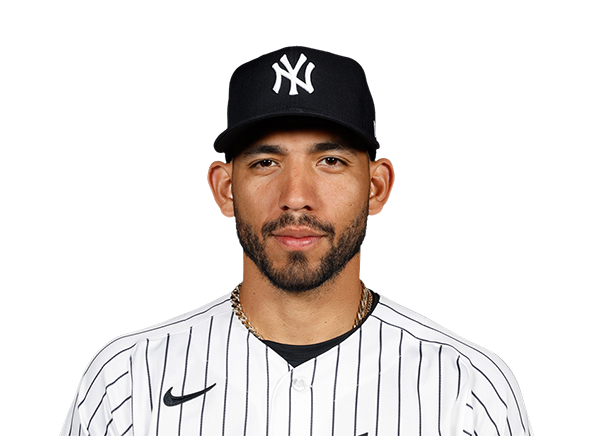 Jose Caballero | 0-4 | 4 | 0 | 0 | 0 | 0 | 0 | 3 | 20 | .250 | .250 | .250 |
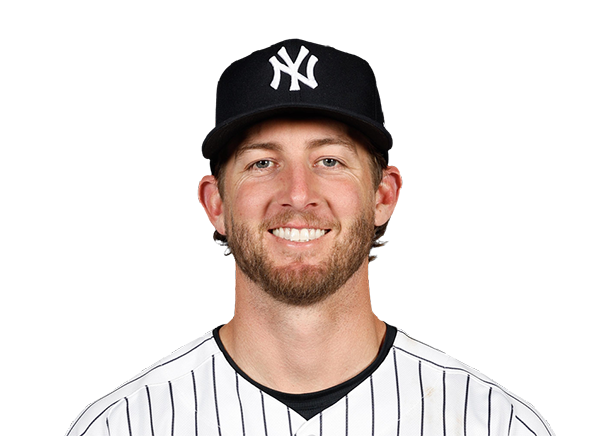 Ryan McMahon | 0-4 | 4 | 0 | 0 | 0 | 0 | 0 | 0 | 10 | .125 | .300 | .125 |
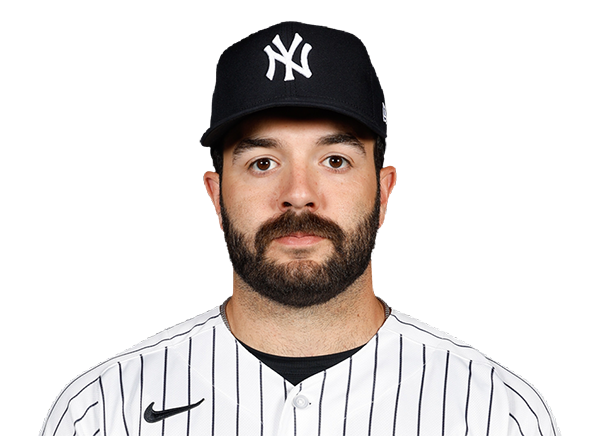 Austin Wells | 0-3 | 3 | 0 | 0 | 0 | 0 | 0 | 2 | 11 | .200 | .273 | .200 |
San Francisco Giants
| Player | H-AB | AB | R | H | RBI | HR | BB | K | #P | AVG | OBP | SLG |
|---|---|---|---|---|---|---|---|---|---|---|---|---|
 Jung Hoo Lee | 1-3 | 3 | 1 | 1 | 0 | 0 | 1 | 1 | 16 | .100 | .182 | .200 |
 Matt Chapman | 1-4 | 4 | 0 | 1 | 1 | 0 | 0 | 1 | 14 | .111 | .333 | .111 |
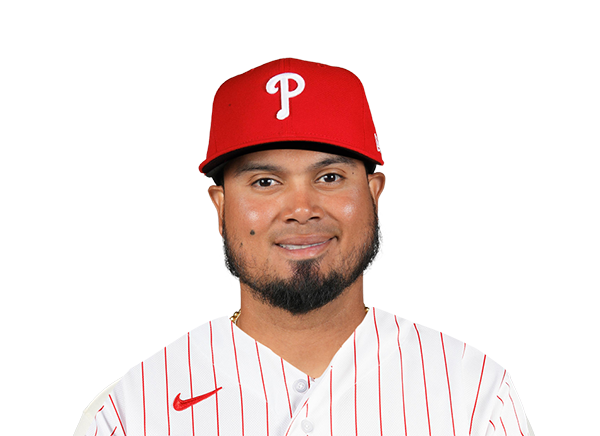 Luis Arraez | 2-4 | 4 | 0 | 2 | 0 | 0 | 0 | 1 | 11 | .273 | .333 | .273 |
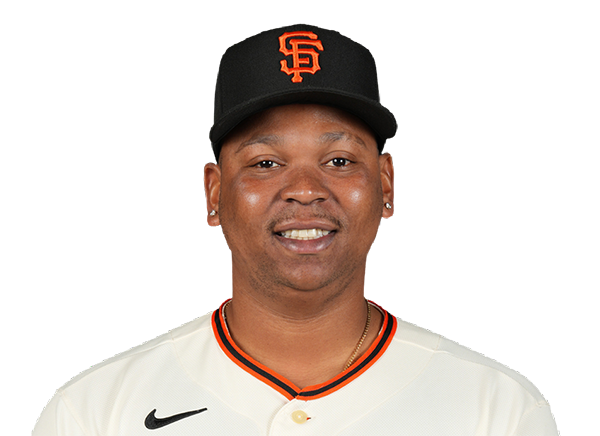 Rafael Devers | 2-4 | 4 | 0 | 2 | 0 | 0 | 0 | 1 | 17 | .250 | .250 | .333 |
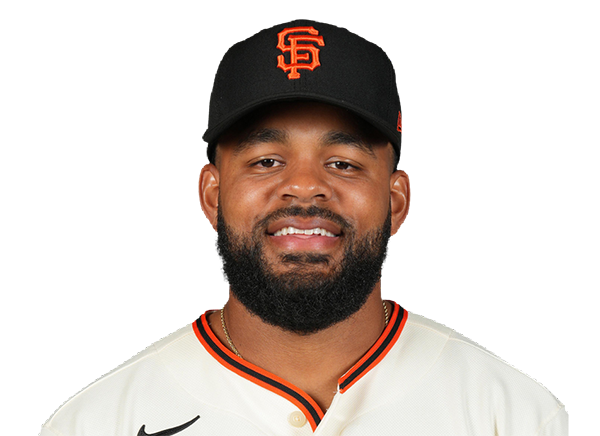 Heliot Ramos | 1-3 | 3 | 0 | 1 | 0 | 0 | 1 | 1 | 31 | .300 | .364 | .400 |
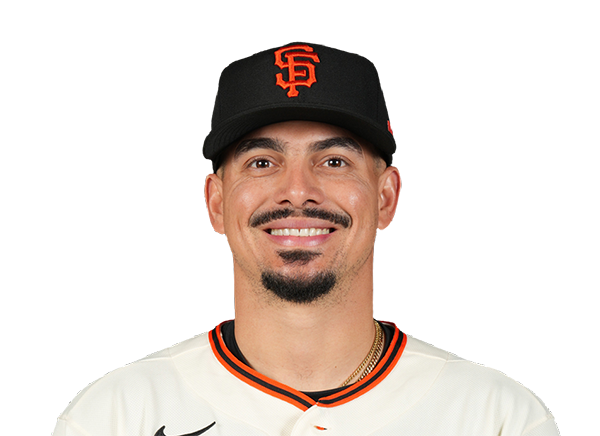 Willy Adames | 1-4 | 4 | 0 | 1 | 0 | 0 | 0 | 1 | 18 | .091 | .091 | .091 |
 Jared Oliva | 0-0 | 0 | 0 | 0 | 0 | 0 | 0 | 0 | 0 | .000 | .000 | .000 |
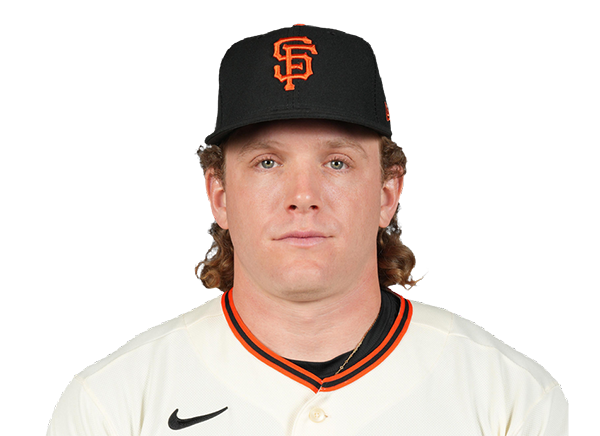 Harrison Bader | 1-4 | 4 | 0 | 1 | 0 | 0 | 0 | 1 | 13 | .100 | .100 | .100 |
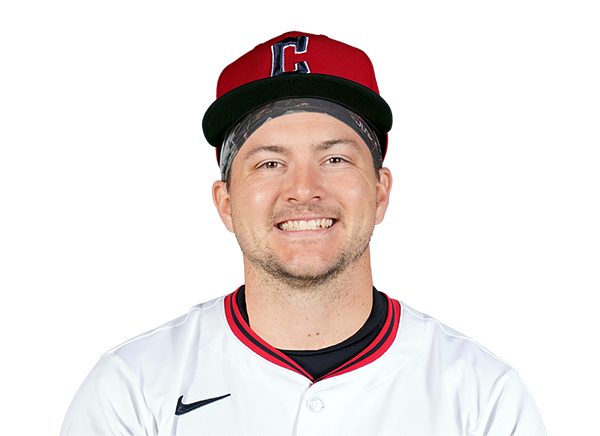 Patrick Bailey | 0-3 | 3 | 0 | 0 | 0 | 0 | 1 | 0 | 13 | .000 | .100 | .000 |
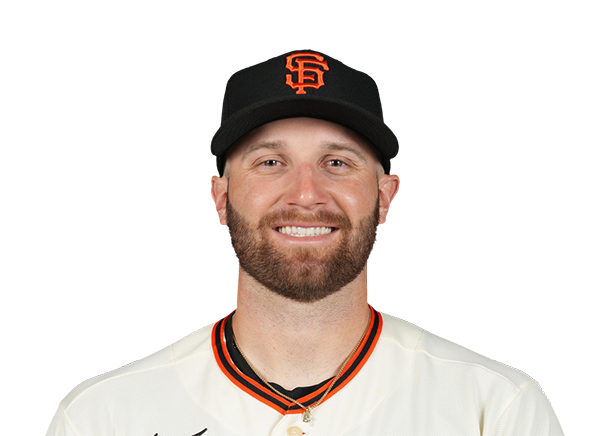 Casey Schmitt | 0-3 | 3 | 0 | 0 | 0 | 0 | 0 | 1 | 13 | .000 | .100 | .000 |
New York Yankees
| Player | IP | H | R | ER | BB | K | HR | PC-ST | ERA | PC |
|---|---|---|---|---|---|---|---|---|---|---|
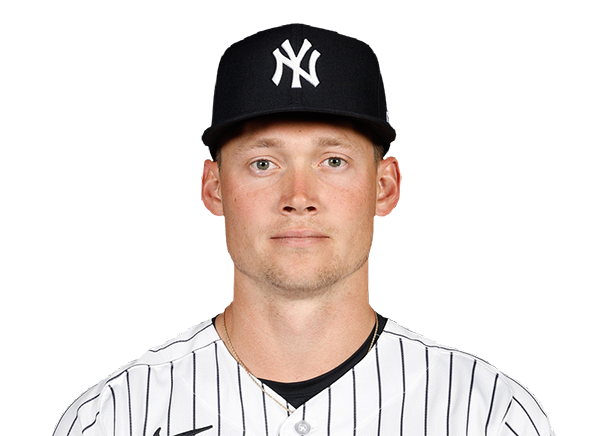 Will Warren | 4.1 | 5 | 1 | 1 | 2 | 3 | 0 | 83-54 | 2.08 | 83 |
 Brent Headrick | 0.2 | 1 | 0 | 0 | 0 | 1 | 0 | 14-10 | 0.00 | 14 |
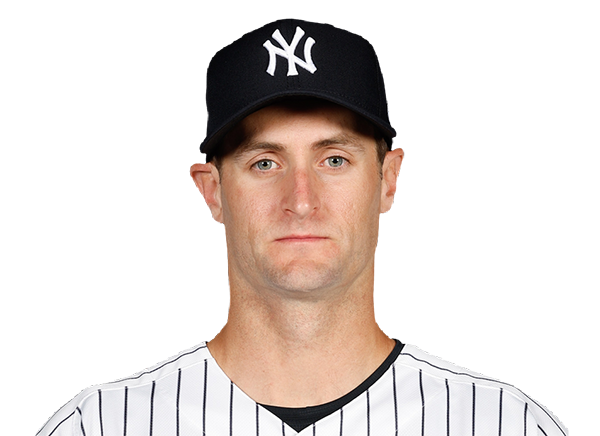 Jake Bird | 1.2 | 1 | 0 | 0 | 0 | 2 | 0 | 18-12 | 0.00 | 18 |
 Tim Hill | 1.1 | 1 | 0 | 0 | 0 | 1 | 0 | 11-8 | 0.00 | 11 |
 David Bednar | 1.0 | 1 | 0 | 0 | 1 | 1 | 0 | 20-12 | 0.00 | 20 |
San Francisco Giants
| Player | IP | H | R | ER | BB | K | HR | PC-ST | ERA | PC |
|---|---|---|---|---|---|---|---|---|---|---|
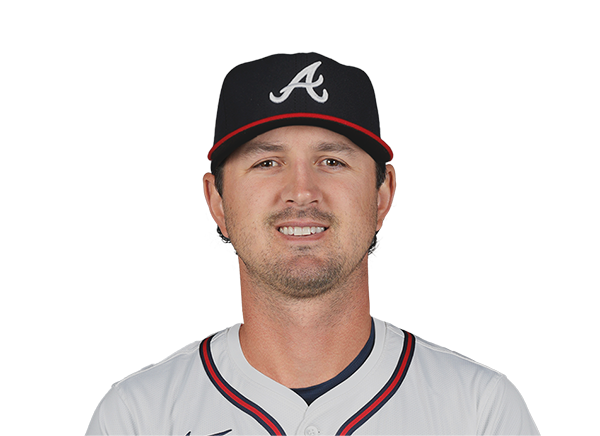 Tyler Mahle | 4.0 | 5 | 2 | 2 | 1 | 5 | 0 | 80-50 | 4.50 | 80 |
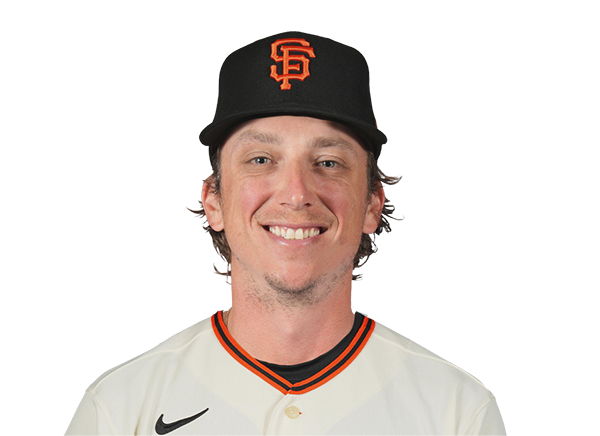 Ryan Borucki | 1.0 | 1 | 1 | 1 | 0 | 1 | 1 | 15-11 | 5.40 | 15 |
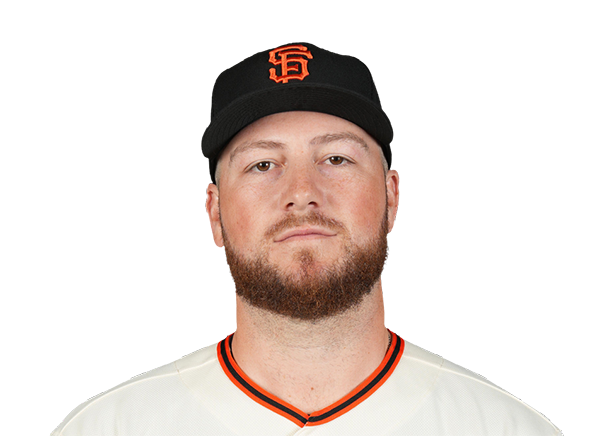 Matt Gage | 1.0 | 0 | 0 | 0 | 0 | 1 | 0 | 8-6 | 0.00 | 8 |
 Keaton Winn | 1.0 | 0 | 0 | 0 | 0 | 1 | 0 | 9-7 | 0.00 | 9 |
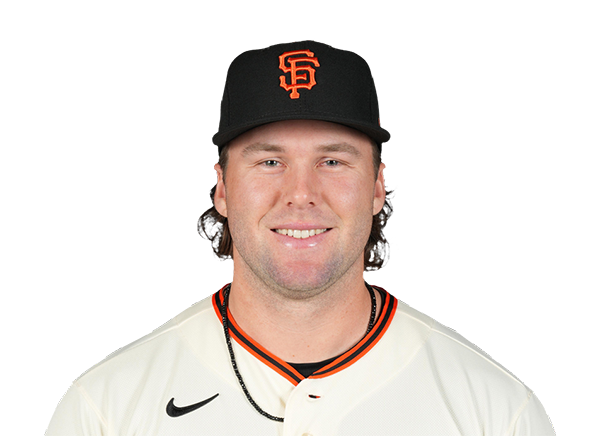 Erik Miller | 0.2 | 1 | 0 | 0 | 1 | 1 | 0 | 20-9 | 0.00 | 20 |
 JT Brubaker | 0.1 | 0 | 0 | 0 | 0 | 0 | 0 | 2-1 | 0.00 | 2 |
 Ryan Walker | 1.0 | 0 | 0 | 0 | 0 | 1 | 0 | 15-9 | 0.00 | 15 |
H2H / Season Series
SF1–3
NYY
SF0–3
NYY
SF0–7
NYY
Last 5 Games
| Date | Opponent | Result |
|---|---|---|
| Aug 22 |  vs TOR | L3–4 |
| Aug 21 | vs TOR | W3–1 |
| Aug 20 |  @ BAL | W6–1 |
| Aug 19 | @ BAL | W5–3 |
| Aug 18 | @ BAL | W3–1 |
| Date | Opponent | Result |
|---|---|---|
| Aug 22 |  @ BOS | L2–3 |
| Aug 21 | @ BOS | L4–6 |
| Aug 20 |  @ CLE | L2–5 |
| Aug 19 | @ CLE | W1–0 |
| Aug 18 | @ CLE | L1–8 |
Standings
American League
| Team | W | L | PCT | GB | DIFF | STRK |
|---|---|---|---|---|---|---|
1 Rays | 76 | 52 | .594 | - | +43 | L2 |
2 White Sox | 67 | 61 | .523 | 9 | +47 | W1 |
3 Astros | 65 | 64 | .504 | 11.5 | -42 | W1 |
| 4Yankees | 73 | 56 | .566 | 3.5 | +95 | L1 |
| 5Red Sox | 69 | 59 | .539 | 7 | +97 | W1 |
6 Rangers | 64 | 66 | .492 | 13 | -48 | L1 |
| 7Blue Jays | 64 | 67 | .489 | 13.5 | -50 | W1 |
8 Twins | 63 | 66 | .488 | 13.5 | -45 | L1 |
| 9Guardians | 63 | 66 | .488 | 13.5 | -15 | W2 |
| 10Orioles | 62 | 67 | .481 | 14.5 | -34 | W1 |
11 Tigers | 61 | 68 | .473 | 15.5 | +77 | L4 |
12 Mariners | 61 | 68 | .473 | 15.5 | -45 | W1 |
13 Royals | 57 | 74 | .435 | 20.5 | -95 | W7 |
14 Angels | 52 | 78 | .400 | 25 | -68 | W1 |
15 Athletics | 49 | 80 | .380 | 27.5 | -189 | L5 |
National League
| Team | W | L | PCT | GB | DIFF | STRK |
|---|---|---|---|---|---|---|
1 Brewers | 81 | 49 | .623 | - | +163 | W3 |
2 Dodgers | 78 | 51 | .605 | 2.5 | +146 | W4 |
3 Braves | 75 | 55 | .577 | 6 | +108 | L2 |
4 Cubs | 74 | 55 | .574 | 6.5 | +99 | L2 |
5 Phillies | 72 | 58 | .554 | 9 | +25 | W8 |
6 Padres | 69 | 60 | .535 | 11.5 | +7 | W1 |
7 Diamondbacks | 68 | 61 | .527 | 12.5 | +13 | W2 |
8 Marlins | 66 | 64 | .508 | 15 | +17 | W2 |
9 Cardinals | 66 | 65 | .504 | 15.5 | 0 | L2 |
10 Pirates | 63 | 67 | .485 | 18 | +30 | L1 |
11 Reds | 61 | 68 | .473 | 19.5 | -98 | L2 |
12 Nationals | 61 | 70 | .466 | 20.5 | +14 | L3 |
13 Mets | 58 | 71 | .450 | 22.5 | -44 | L1 |
| 14Giants | 52 | 76 | .406 | 28 | -78 | L2 |
15 Rockies | 50 | 78 | .391 | 30 | -130 | L4 |
NYY
VS
SF
Pitchers
Will Warren
Brent Headrick
Jake Bird
Tim Hill
David Bednar
Catchers
Austin Wells
Infielders
Ben Rice
Jazz Chisholm Jr.
Jose Caballero
Ryan McMahon
Outfielders
Trent Grisham
Aaron Judge
Cody Bellinger
Designated Hitters
Giancarlo Stanton
Pitchers
Tyler Mahle
Ryan Borucki
Matt Gage
Keaton Winn
Erik Miller
JT Brubaker
Ryan Walker
Catchers
Patrick Bailey
Infielders
Matt Chapman
Luis Arraez
Willy Adames
Casey Schmitt
Outfielders
Jung Hoo Lee
Heliot Ramos
Harrison Bader
Designated Hitters
Rafael Devers
Other Players
Jared Oliva
Yankees
VS
Giants
Batting
128
Team Games Played
128
4225
At Bats
4346
970
Hits
1074
541
Runs Batted In
497
176
Home Runs
141
123
Stolen Bases
56
.230
Batting Average
.247
568
Runs
517
189
Doubles
214
16
Triples
24
1719
Total Bases
1759
464
Walks
338
1180
Strikeouts
1019
.308
On Base Percentage
.305
.407
Slugging Percentage
.405
.715
OBP Pct + SLG Pct
.710
128
Games Played
128
128
Games Started
128
31
Hit By Pitch
41
0.0
Wins Above Replacement
0.0
0.0
Offensive Wins Above Replacement
0.0
39
Caught Stealing
18
1
Is Qualified
1
544.4
Runs Created
540.2
4.3
Runs Created Per 27 Outs
4.3
.097
Walks Per Plate Appearance
.071
0.39
Walk To Strikeout Ratio
0.33
.177
Isolated Power
.158
.307
Secondary Average
.244
3.99
Pitches Per Plate Appearance
3.86
381
Extra Base Hits
379
4761
Plate Appearances
4783
24.0
At Bats Per Home Run
30.8
7
Sacrifice Hit
22
30
Sacrifice Flies
36
Pitching
128
Team Games Played
128
52
Quality Starts
45
73
Wins
52
55
Losses
76
39
Saves
24
71
Holds
61
948
Hits
1053
407
Earned runs
546
126
Home Runs
118
391
Walks
481
1153
Strikeouts
962
9.1
Strikeouts Per 9 Innings
7.7
144.4
Pitches Per Start
147.6
1.17
Walks Plus Hits Per Inning Pitched
1.36
3.20
Earned Run Average
4.36
55
Losses
76
1143.2
Innings pitched
1128.0
.570
Win Percentage
.406
62
Save Opportunities
43
.223
Opponent Batting Average
.247
.294
Opponent's On-base pct.
.329
.362
Opponent's Slugging pct.
.387
.656
Opponent's OPB Pct + SLG Pct
.716
4245
At Bats
4257
178
Doubles
186
16
Triples
28
47
Batters Hit
55
62
Stolen Bases
104
128
Games Played
128
0
Complete Games
1
12
Shutouts
9
28
Wild Pitches
47
451
Runs Batted In
559
3
Balks
4
1143.2
Innings pitched
1128.0
9.1
Strikeouts Per 9 Innings
7.7
18
Caught Stealing
34
128
Games Started
128
0.0
Wins Above Replacement
0.0
1
Is Qualified
1
472
Runs
595
407
Earned Runs
546
1536
Total Bases
1649
Fielding
128
Team Games Played
128
1144
Full Innings
1128
4623
Total Chances
4675
3431
Putouts
3384
1124
Assists
1207
68
Errors
84
189
Double Plays
214
0.985
Fielding Percentage
0.982
35.8
Range Factor
36.6
0.0
Zone Rating
0.0
128
Games Played
128
0
Games Started
0
0.0
Defensive Wins Above Replacement
0.0
1
Qualified
1