

Yankees vs Rays Live Score (10 Apr, 2026)
Game Information
Stage
Standard
Season
2026
First Pitch
Fri, Apr 10, 7:10 pm
Venue
Tropicana Field
Location
St. Petersburg, Florida
Attendance
20,511
Live Situation
1Balls
2Strikes
0Outs
—Pitcher
—At Bat
Pitch Sequence
1
BALL
Four-seam FB
96 MPH
2
STRIKE FOUL
Four-seam FB
96 MPH
3
STRIKE SWINGING
Changeup
86 MPH
4
BALL IN PLAY
Changeup
83 MPH
Injury Report


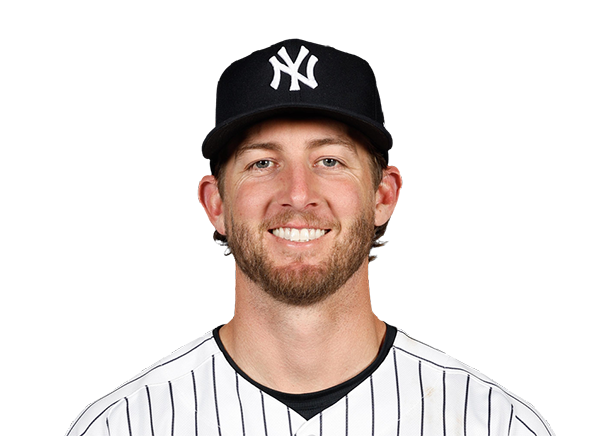
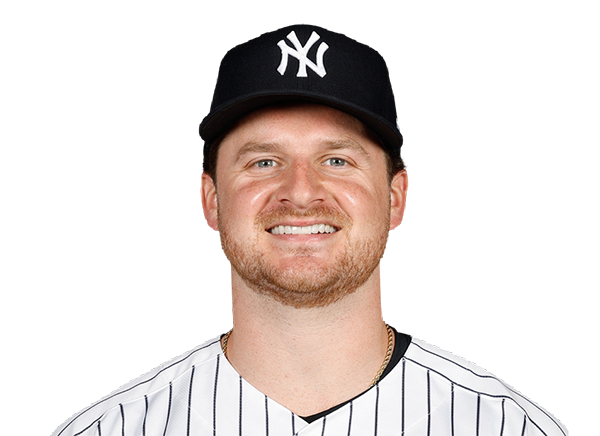
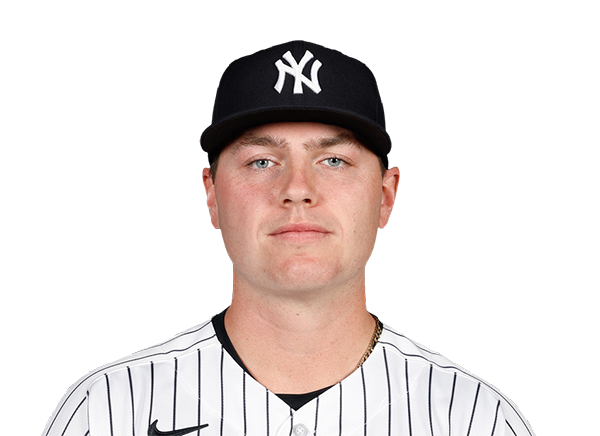

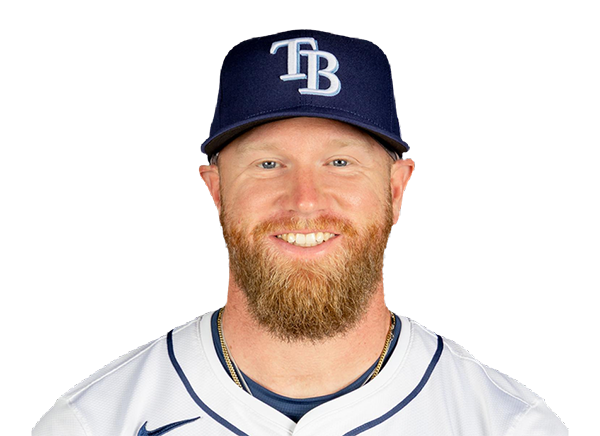
Team Stats
 NYY
TB


3
Runs
5
5
Hits
9
1
Errors
1
1
Home Runs
1
2
Walks
5
12
Strikeouts
5
Player Box Score
New York Yankees
| Player | H-AB | AB | R | H | RBI | HR | BB | K | #P | AVG | OBP | SLG |
|---|---|---|---|---|---|---|---|---|---|---|---|---|
 Paul Goldschmidt | 0-1 | 1 | 0 | 0 | 0 | 0 | 1 | 1 | 18 | .200 | .385 | .600 |
 Ben Rice | 1-1 | 1 | 1 | 1 | 1 | 1 | 0 | 0 | 4 | .342 | .490 | .763 |
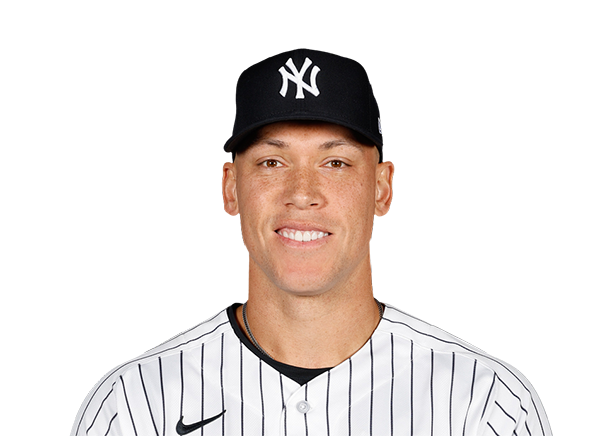 Aaron Judge | 1-4 | 4 | 1 | 1 | 0 | 0 | 0 | 2 | 20 | .224 | .309 | .429 |
 Cody Bellinger | 0-3 | 3 | 0 | 0 | 1 | 0 | 0 | 2 | 14 | .222 | .339 | .356 |
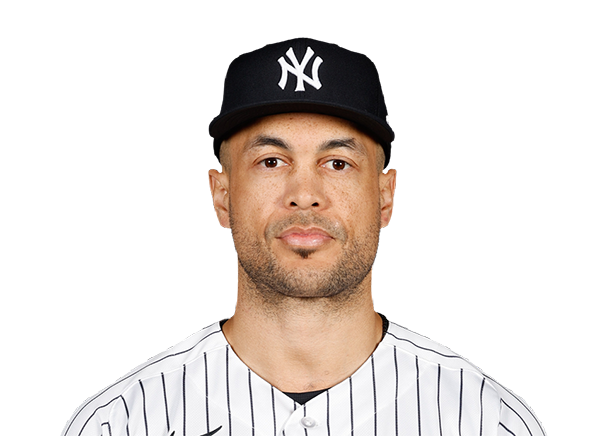 Giancarlo Stanton | 1-3 | 3 | 1 | 1 | 0 | 0 | 1 | 1 | 19 | .326 | .380 | .435 |
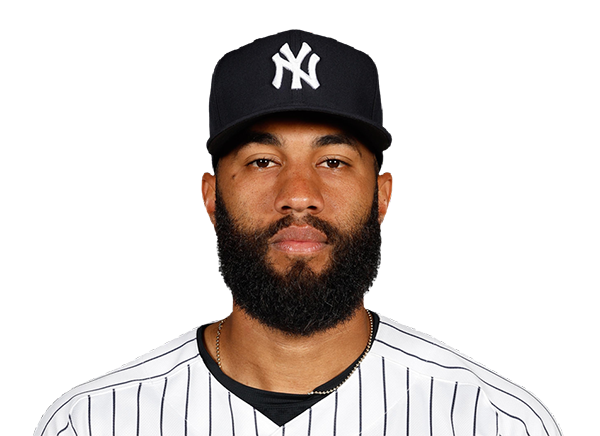 Amed Rosario | 2-4 | 4 | 0 | 2 | 1 | 0 | 0 | 1 | 18 | .300 | .348 | .700 |
 Jazz Chisholm Jr. | 0-4 | 4 | 0 | 0 | 0 | 0 | 0 | 1 | 11 | .170 | .235 | .234 |
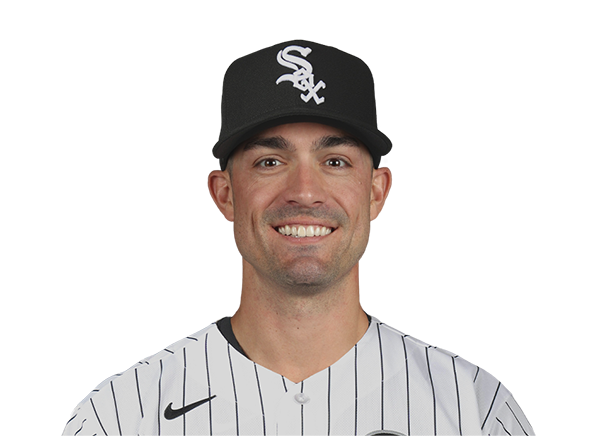 Randal Grichuk | 0-4 | 4 | 0 | 0 | 0 | 0 | 0 | 2 | 20 | .000 | .000 | .000 |
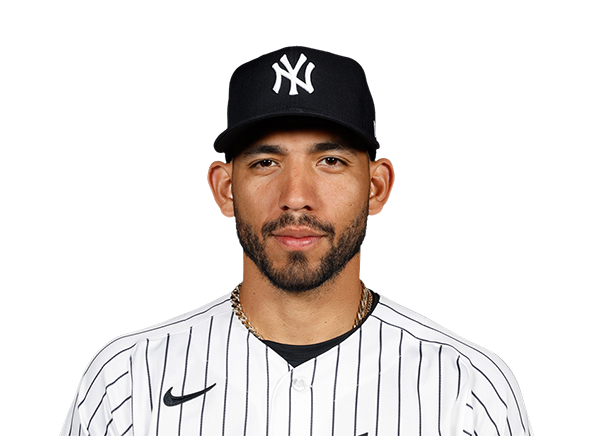 Jose Caballero | 0-3 | 3 | 0 | 0 | 0 | 0 | 0 | 2 | 14 | .150 | .209 | .175 |
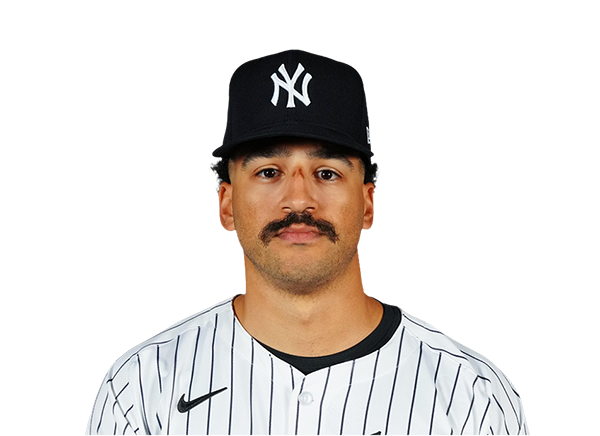 Trent Grisham | 0-1 | 1 | 0 | 0 | 0 | 0 | 0 | 0 | 4 | .158 | .347 | .237 |
 Austin Wells | 0-3 | 3 | 0 | 0 | 0 | 0 | 0 | 0 | 6 | .152 | .263 | .182 |
Tampa Bay Rays
| Player | H-AB | AB | R | H | RBI | HR | BB | K | #P | AVG | OBP | SLG |
|---|---|---|---|---|---|---|---|---|---|---|---|---|
 Chandler Simpson | 1-5 | 5 | 0 | 1 | 2 | 0 | 0 | 1 | 15 | .373 | .407 | .412 |
 Junior Caminero | 1-4 | 4 | 0 | 1 | 0 | 0 | 1 | 1 | 19 | .220 | .339 | .360 |
 Jonathan Aranda | 0-4 | 4 | 1 | 0 | 1 | 0 | 1 | 1 | 20 | .250 | .328 | .481 |
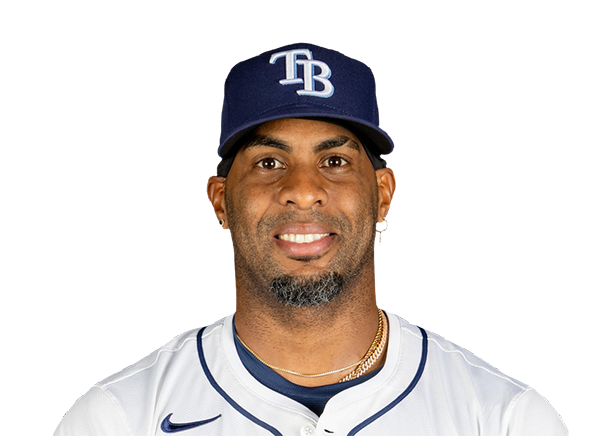 Yandy Diaz | 2-4 | 4 | 1 | 2 | 2 | 1 | 0 | 0 | 18 | .373 | .458 | .608 |
 Cedric Mullins | 1-3 | 3 | 0 | 1 | 0 | 0 | 1 | 0 | 18 | .136 | .188 | .227 |
 Jonny DeLuca | 0-4 | 4 | 0 | 0 | 0 | 0 | 0 | 0 | 15 | .240 | .269 | .400 |
 Ben Williamson | 1-2 | 2 | 1 | 1 | 0 | 0 | 2 | 1 | 26 | .250 | .318 | .300 |
 Taylor Walls | 1-2 | 2 | 2 | 1 | 0 | 0 | 0 | 0 | 21 | .167 | .231 | .250 |
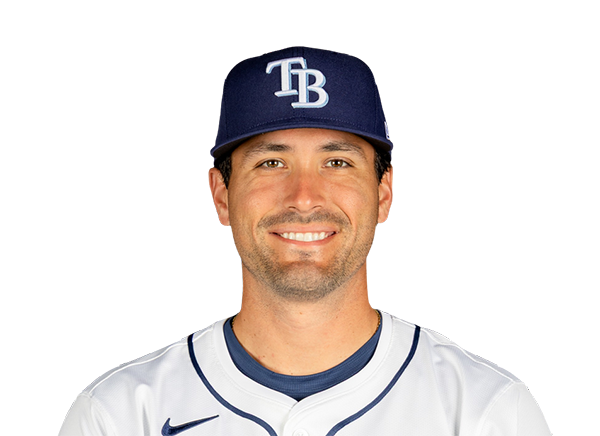 Nick Fortes | 2-4 | 4 | 0 | 2 | 0 | 0 | 0 | 1 | 8 | .324 | .359 | .486 |
New York Yankees
| Player | IP | H | R | ER | BB | K | HR | PC-ST | ERA | PC |
|---|---|---|---|---|---|---|---|---|---|---|
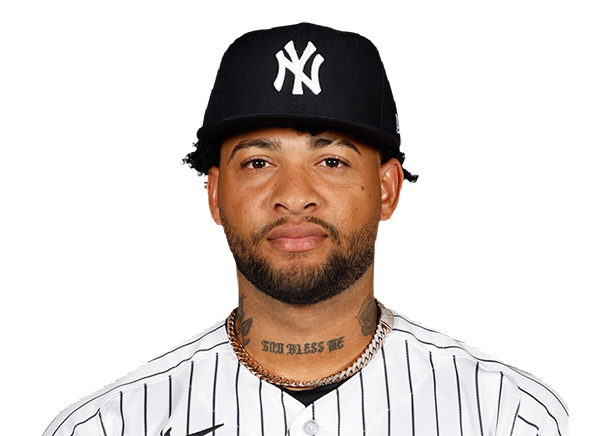 Luis Gil | 4.0 | 3 | 3 | 3 | 3 | 2 | 1 | 88-50 | 6.75 | 88 |
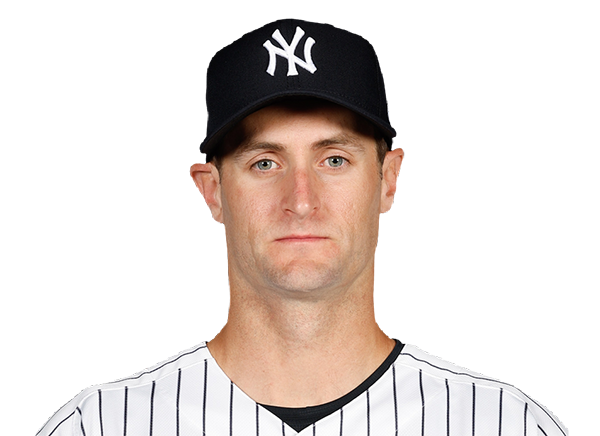 Jake Bird | 1.0 | 2 | 0 | 0 | 0 | 2 | 0 | 20-14 | 4.50 | 20 |
 Brent Headrick | 0.1 | 2 | 2 | 1 | 0 | 1 | 0 | 16-14 | 1.23 | 16 |
 Camilo Doval | 0.2 | 1 | 0 | 0 | 0 | 0 | 0 | 8-5 | 7.20 | 8 |
 Ryan Yarbrough | 2.0 | 1 | 0 | 0 | 2 | 0 | 0 | 28-16 | 0.00 | 28 |
Tampa Bay Rays
| Player | IP | H | R | ER | BB | K | HR | PC-ST | ERA | PC |
|---|---|---|---|---|---|---|---|---|---|---|
 Steven Matz | 5.0 | 2 | 2 | 2 | 2 | 7 | 0 | 88-57 | 3.94 | 88 |
 Griffin Jax | 1.0 | 0 | 0 | 0 | 0 | 2 | 0 | 13-7 | 9.00 | 13 |
 Ian Seymour | 1.0 | 0 | 0 | 0 | 0 | 1 | 0 | 17-12 | 10.80 | 17 |
 Hunter Bigge | 1.0 | 1 | 1 | 1 | 0 | 1 | 1 | 14-8 | 2.70 | 14 |
 Bryan Baker | 1.0 | 2 | 0 | 0 | 0 | 1 | 0 | 16-12 | 1.80 | 16 |
H2H / Season Series
TB4–12
NYY
TB3–0
NYY
TB6–4
NYY
TB1–5
NYY
NYY2–0
TB
NYY2–4
TB
TB5–4
NYY
TB5–4
NYY
TB5–3
NYY
TB2–3
NYY
Last 5 Games
| Date | Opponent | Result |
|---|---|---|
| Aug 22 |  vs TOR | L3–4 |
| Aug 21 | vs TOR | W3–1 |
| Aug 20 |  @ BAL | W6–1 |
| Aug 19 | @ BAL | W5–3 |
| Aug 18 | @ BAL | W3–1 |
| Date | Opponent | Result |
|---|---|---|
| Aug 22 | @ BAL | L2–3 |
| Aug 21 | @ BAL | L3–5 |
| Aug 20 | vs TOR | L1–5 |
| Aug 19 | vs TOR | W7–6 |
| Aug 18 | vs TOR | L5–10 |
Standings
American League
| Team | W | L | PCT | GB | DIFF | STRK |
|---|---|---|---|---|---|---|
| 1Rays | 76 | 53 | .589 | - | +42 | L3 |
2 White Sox | 67 | 62 | .519 | 9 | +42 | L1 |
3 Astros | 65 | 65 | .500 | 11.5 | -43 | L1 |
| 4Yankees | 73 | 56 | .566 | 3 | +95 | L1 |
5 Red Sox | 70 | 59 | .543 | 6 | +98 | W2 |
6 Rangers | 64 | 66 | .492 | 12.5 | -48 | L1 |
7 Guardians | 64 | 66 | .492 | 12.5 | -14 | W3 |
| 8Blue Jays | 64 | 67 | .489 | 13 | -50 | W1 |
9 Twins | 63 | 67 | .485 | 13.5 | -47 | L2 |
| 10Orioles | 63 | 67 | .485 | 13.5 | -33 | W2 |
11 Mariners | 62 | 68 | .477 | 14.5 | -44 | W2 |
12 Tigers | 61 | 68 | .473 | 15 | +77 | L4 |
13 Royals | 57 | 74 | .435 | 20 | -95 | W7 |
14 Angels | 52 | 78 | .400 | 24.5 | -68 | W1 |
15 Athletics | 50 | 80 | .385 | 26.5 | -188 | W1 |
National League
| Team | W | L | PCT | GB | DIFF | STRK |
|---|---|---|---|---|---|---|
1 Brewers | 81 | 49 | .623 | - | +163 | W3 |
2 Dodgers | 79 | 51 | .608 | 2 | +147 | W5 |
3 Braves | 75 | 55 | .577 | 6 | +108 | L2 |
4 Cubs | 74 | 56 | .569 | 7 | +98 | L3 |
5 Phillies | 72 | 58 | .554 | 9 | +25 | W8 |
6 Padres | 70 | 60 | .538 | 11 | +9 | W2 |
7 Diamondbacks | 68 | 62 | .523 | 13 | +7 | L1 |
8 Marlins | 66 | 64 | .508 | 15 | +17 | W2 |
9 Cardinals | 66 | 65 | .504 | 15.5 | 0 | L2 |
10 Pirates | 63 | 68 | .481 | 18.5 | +29 | L2 |
11 Reds | 62 | 68 | .477 | 19 | -92 | W1 |
12 Nationals | 61 | 70 | .466 | 20.5 | +14 | L3 |
13 Mets | 59 | 71 | .454 | 22 | -39 | W1 |
14 Giants | 52 | 77 | .403 | 28.5 | -79 | L3 |
15 Rockies | 50 | 79 | .388 | 30.5 | -131 | L5 |
NYY
VS
TB
Pitchers
Luis Gil
Jake Bird
Brent Headrick
Camilo Doval
Ryan Yarbrough
Catchers
Austin Wells
Infielders
Paul Goldschmidt
Ben Rice
Amed Rosario
Jazz Chisholm Jr.
Jose Caballero
Outfielders
Aaron Judge
Cody Bellinger
Randal Grichuk
Designated Hitters
Giancarlo Stanton
Other Players
Trent Grisham
Pitchers
Steven Matz
Griffin Jax
Ian Seymour
Hunter Bigge
Bryan Baker
Catchers
Nick Fortes
Infielders
Junior Caminero
Jonathan Aranda
Ben Williamson
Taylor Walls
Outfielders
Chandler Simpson
Cedric Mullins
Jonny DeLuca
Designated Hitters
Yandy Diaz
Yankees
VS
Rays
Batting
129
Team Games Played
129
4255
At Bats
4337
974
Hits
1131
544
Runs Batted In
556
177
Home Runs
135
126
Stolen Bases
128
.229
Batting Average
.261
571
Runs
584
190
Doubles
183
16
Triples
20
1727
Total Bases
1759
469
Walks
416
1192
Strikeouts
913
.308
On Base Percentage
.330
.406
Slugging Percentage
.406
.714
OBP Pct + SLG Pct
.735
129
Games Played
129
129
Games Started
129
33
Hit By Pitch
47
0.0
Wins Above Replacement
0.0
0.0
Offensive Wins Above Replacement
0.0
39
Caught Stealing
42
1
Is Qualified
1
547.8
Runs Created
589.5
4.3
Runs Created Per 27 Outs
4.7
.098
Walks Per Plate Appearance
.085
0.39
Walk To Strikeout Ratio
0.46
.177
Isolated Power
.145
.308
Secondary Average
.261
3.99
Pitches Per Plate Appearance
3.78
383
Extra Base Hits
338
4798
Plate Appearances
4874
24.0
At Bats Per Home Run
32.1
7
Sacrifice Hit
36
30
Sacrifice Flies
35
Pitching
129
Team Games Played
129
52
Quality Starts
39
73
Wins
76
56
Losses
53
39
Saves
50
71
Holds
97
963
Hits
1014
411
Earned runs
493
127
Home Runs
166
393
Walks
329
1159
Strikeouts
1056
9.0
Strikeouts Per 9 Innings
8.3
144.6
Pitches Per Start
139.8
1.18
Walks Plus Hits Per Inning Pitched
1.17
3.21
Earned Run Average
3.85
56
Losses
53
1152.2
Innings pitched
1151.0
.566
Win Percentage
.589
62
Save Opportunities
65
.225
Opponent Batting Average
.234
.295
Opponent's On-base pct.
.293
.363
Opponent's Slugging pct.
.401
.658
Opponent's OPB Pct + SLG Pct
.694
4285
At Bats
4331
181
Doubles
199
16
Triples
13
47
Batters Hit
48
62
Stolen Bases
109
129
Games Played
129
0
Complete Games
1
12
Shutouts
11
29
Wild Pitches
35
455
Runs Batted In
518
3
Balks
2
1152.2
Innings pitched
1151.0
9.0
Strikeouts Per 9 Innings
8.3
18
Caught Stealing
29
129
Games Started
129
0.0
Wins Above Replacement
0.0
1
Is Qualified
1
476
Runs
542
411
Earned Runs
493
1557
Total Bases
1737
Fielding
129
Team Games Played
129
1153
Full Innings
1151
4663
Total Chances
4547
3458
Putouts
3453
1135
Assists
1017
70
Errors
77
190
Double Plays
183
0.985
Fielding Percentage
0.983
35.9
Range Factor
35.0
0.0
Zone Rating
0.0
129
Games Played
129
0
Games Started
0
0.0
Defensive Wins Above Replacement
0.0
1
Qualified
1