

Bulls vs Lakers Live Score (17 Feb, 2027)
Game Information
League
NBA
Season
1
Date
February 16, 2027
Tipoff
10:00 PM EST
Status
Scheduled
Team Stats
 CHI
Game Comparison
LAL
-Points-
-Rebounds-
-Assists-
45Field Goal %50
-3-Point %-
-Free Throw %-
Game Leaders
CHILAL
 —#
Points
—
—#
—#
Rebounds
—
—#
—#
Assists
—
—#
H2H / Season Series
Last 5 Games







NBA Standings
Eastern Conference — Central

Western Conference — Pacific
| Team | W | L | PCT | GB | STRK |
|---|---|---|---|---|---|
| LA Lakers | 13 | 2 | .867 | - | W9 |
 Golden State | 8 | 6 | .571 | 4.5 | L3 |
 Phoenix | 6 | 7 | .462 | 6 | W1 |
 LA Clippers | 4 | 9 | .308 | 8 | L1 |
 Sacramento | 1 | 12 | .077 | 11 | L6 |
Rosters
Bulls
4th in Central Division
VS
Lakers
1st in Pacific Division
Guard
#24

Norman Powell
#30

Tre Jones
#3

Josh Giddey
#7
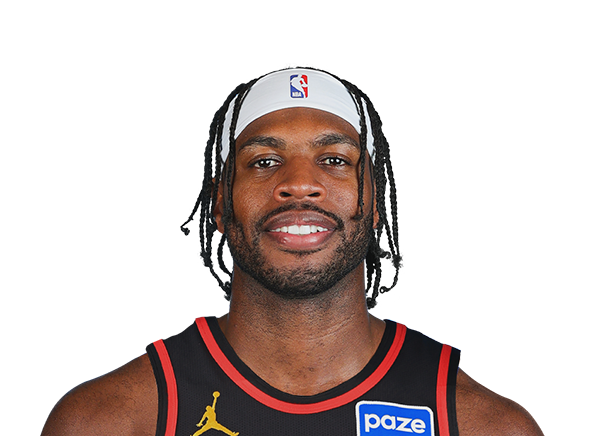
Buddy Hield
#22
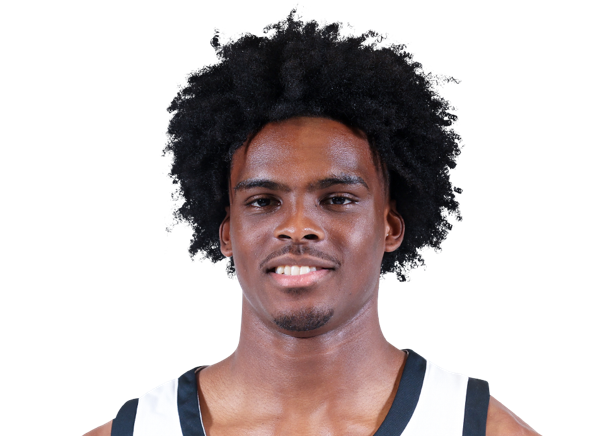
Jaylin Sellers
#15

Jordan Hawkins
#5
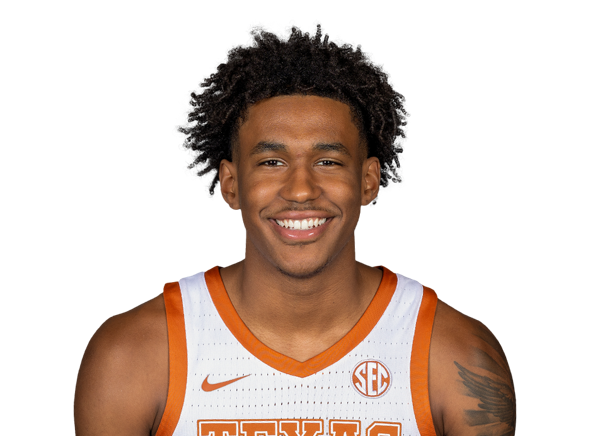
Dailyn Swain
Forward
#8
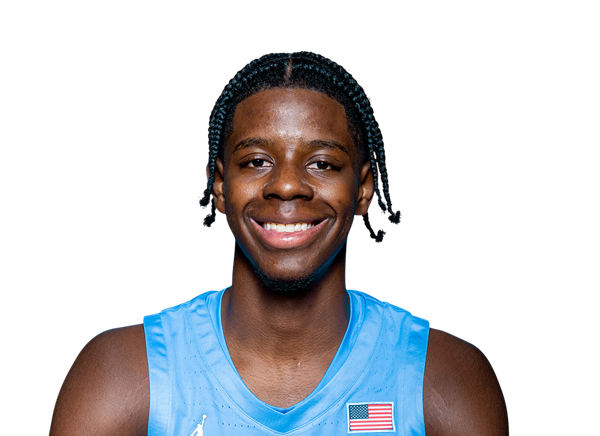
Caleb Wilson
#14

Matas Buzelis
#25
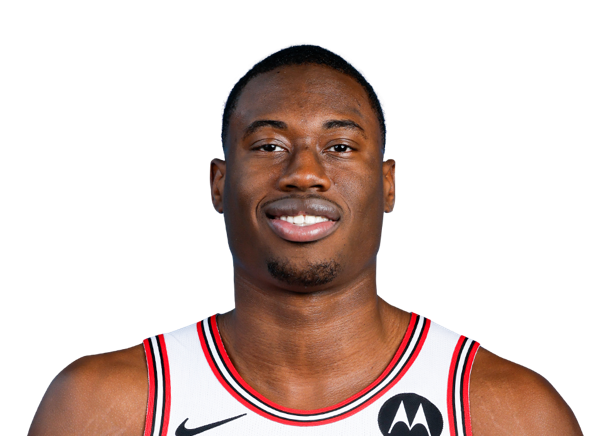
Jalen Smith
#35

Isaac Okoro
#11

Leonard Miller
#2
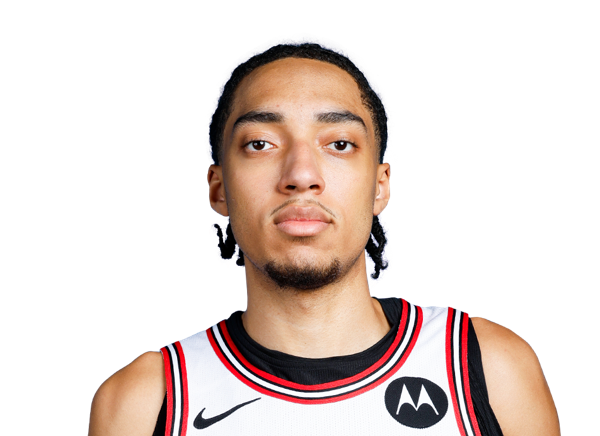
Noa Essengue
#12

Zach Collins
#44
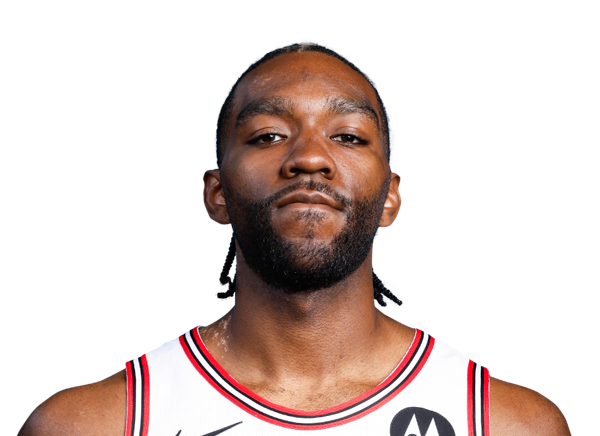
Patrick Williams
#19
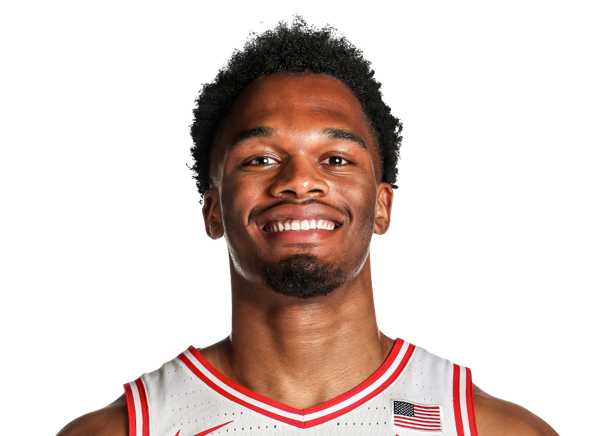
Tobe Awaka
Center
#9

Nic Claxton
Guard
#77

Luka Doncic
#15

Austin Reaves
#5

Quentin Grimes
#10
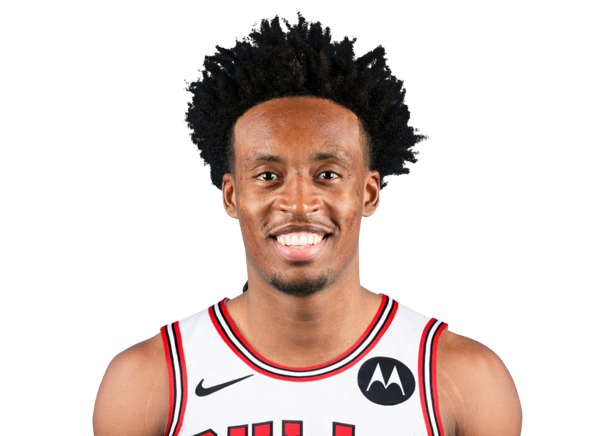
Collin Sexton
#4
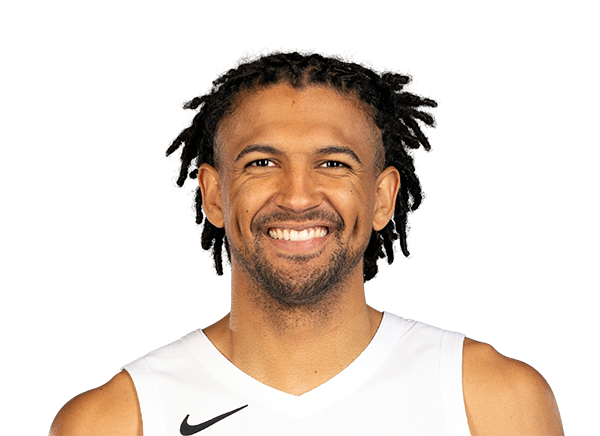
Matisse Thybulle
#43
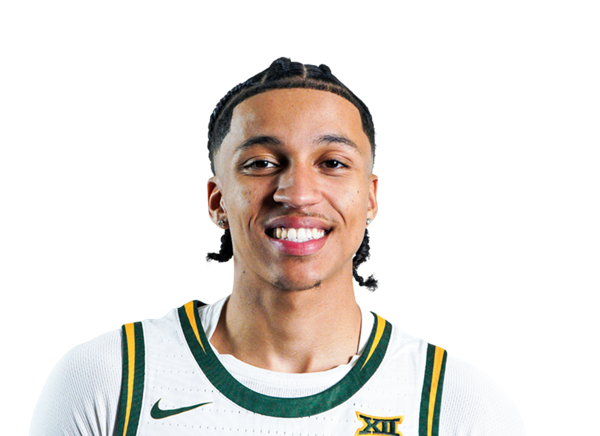
Cameron Carr
#7

Jaden Hardy
#9

Bronny James
#30
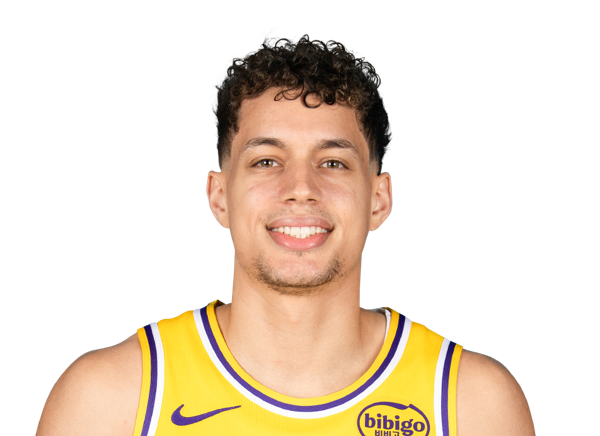
Chris Manon
Center
#14
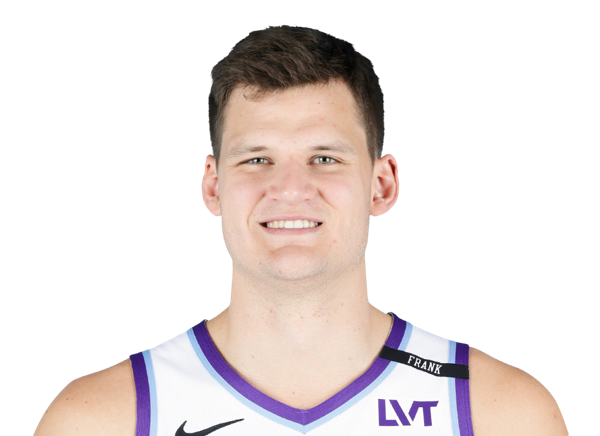
Walker Kessler

Carson Cooper

Lawson Lovering
Forward
#54

Sandro Mamukelashvili
#11
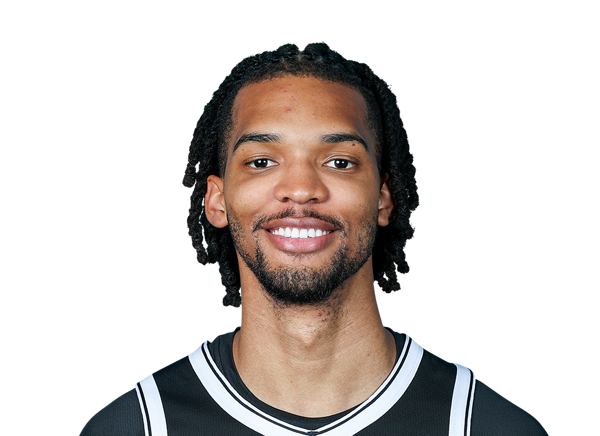
Ziaire Williams
#12

Jake LaRavia
#2

Jarred Vanderbilt
#55
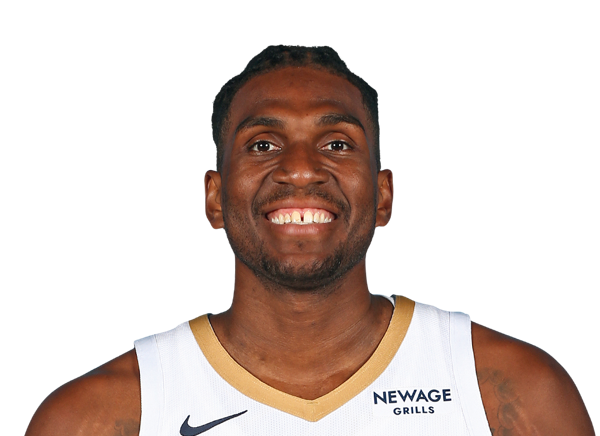
Kevon Looney
#1

Adou Thiero
Team Statistics
Bulls
4th in Central Division
VS
Lakers
1st in Pacific Division
General
43.8
Rebounds Per Game
41.1
1.7
Assist To Turnover Ratio
1.6
23.2
Fouls Per Game
22.5
15
Games Played
17
0
Games Started
0
0
Minutes
0
0.0
Minutes Per Game
0.0
657
Rebounds
698
657
Rebounds
698
Offensive
76.5
Free Throw Percentage
78.7
31.8
3-Point Field Goal Percentage
37.1
40.6
Average Field Goals Made
41.4
90.0
Average Field Goals Attempted
84.6
12.9
Average 3-Point Field Goals Made
13.9
40.7
Average 3-Point Field Goals Attempted
37.5
20.6
Average Free Throws Made
23.2
26.9
Average Free Throws Attempted
29.5
114.7
Points Per Game
120.0
12.7
Offensive Rebounds Per Game
11.8
27.5
Assists Per Game
24.6
16.5
Turnovers Per Game
15.8
56.2
2-Point Field Goal Percentage
58.3
1.275
Scoring Efficiency
1.418
0.52
Shooting Efficiency
0.57
45.1
Field Goal Percentage
48.9
415.0
2-Point Field Goals Made
467.0
739.0
2-Point Field Goals Attempted
801.0
1721
Points
2040
190
Offensive Rebounds
201
413
Assists
418
248
Turnovers
268
609
Field Goals Made
704
1350
Field Goals Attempted
1439
309
Free Throws Made
395
404
Free Throws Attempted
502
194
3-Point Field Goals Made
237
611
3-Point Field Goals Attempted
638
31.8
3-Point Field Goal Percentage
37.1
27.7
2-Point Field Goals Made per Game
27.5
49.3
2-Point Field Goals Attempted per Game
47.1
Defensive
31.1
Defensive Rebounds Per Game
29.2
5.5
Blocks Per Game
5.8
8.3
Steals Per Game
10.6
467
Defensive Rebounds
497
124
Steals
181
83
Blocks
98