

Lakers vs Pistons Live Score (8 Nov, 2026)
Game Information
League
NBA
Season
2027
Date
November 8, 2026
Tipoff
6:00 PM EST
Status
Scheduled
LAL Record
8-2
DET Record
6-2
Venue
Little Caesars Arena
Location
Detroit, MI
Arena Type
Indoor
Broadcast
NBA TV
Team Stats
 LAL
Game Comparison
DET

-Points-
-Rebounds-
-Assists-
51Field Goal %47
-3-Point %-
-Free Throw %-
Game Leaders
LALDET
 —#
Points
—
—#
—#Rebounds
—
—#
—#Assists
—
—#
H2H / Season Series
Last 5 Games







NBA Standings
Western Conference — Pacific
| Team | W | L | PCT | GB | STRK |
|---|---|---|---|---|---|
| LA Lakers | 8 | 2 | .800 | - | W4 |
 Golden State | 7 | 3 | .700 | 1 | W7 |
 Phoenix | 3 | 5 | .375 | 4 | W2 |
 LA Clippers | 1 | 7 | .125 | 6 | L7 |
 Sacramento | 1 | 8 | .111 | 6.5 | L2 |




Rosters
Lakers
1st in Pacific Division
VS
Pistons
1st in Central Division
Guard
#77

Luka Doncic
#15

Austin Reaves
#10
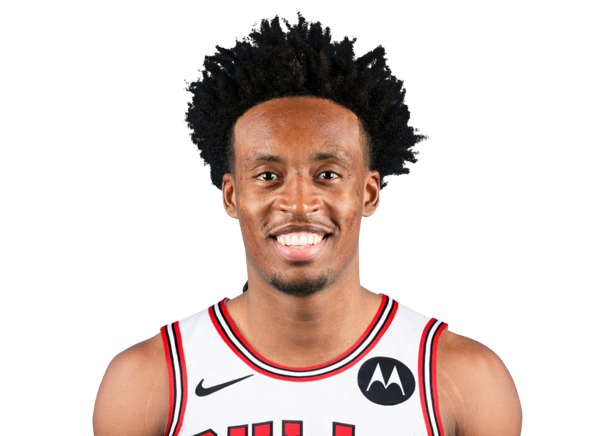
Collin Sexton
#5

Quentin Grimes
#4

Matisse Thybulle
#7

Jaden Hardy
#30
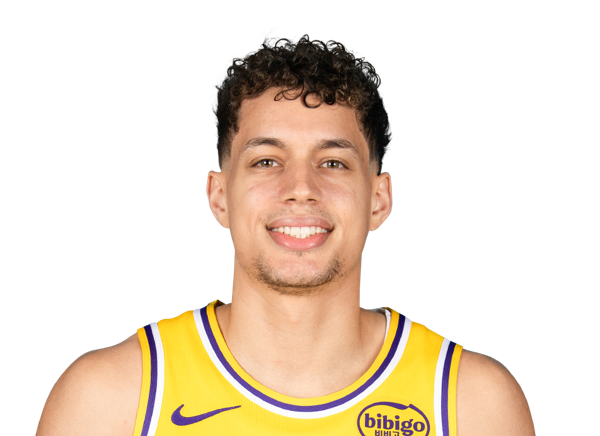
Chris Manon
#9

Bronny James
#43
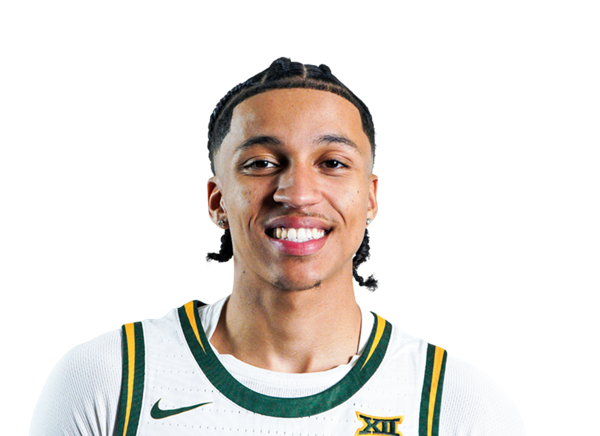
Cameron Carr
Center
#14
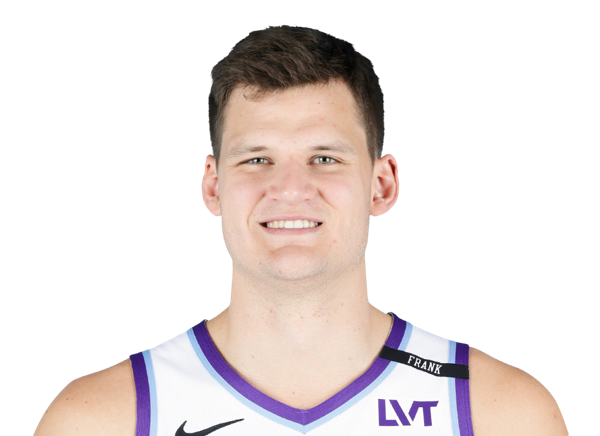
Walker Kessler

Lawson Lovering
Forward
#11

Ziaire Williams
#54

Sandro Mamukelashvili
#12

Jake LaRavia
#1

Adou Thiero
#55

Kevon Looney
#2

Jarred Vanderbilt
Guard
#2

Cade Cunningham
#9
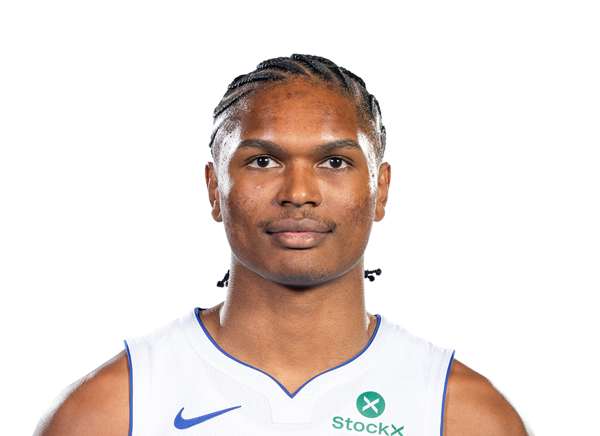
Ausar Thompson
#24

Daniss Jenkins
#27

Kevin Huerter
#31

Javonte Green
#17

Isaiah Joe
#8

Chaz Lanier
#23
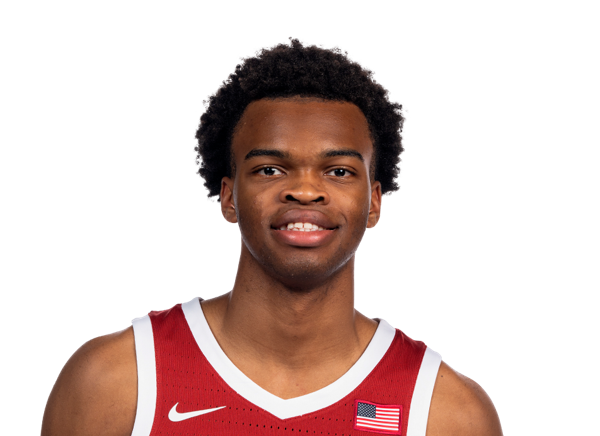
Ebuka Okorie
#94

Elijah Harkless
Forward
#55
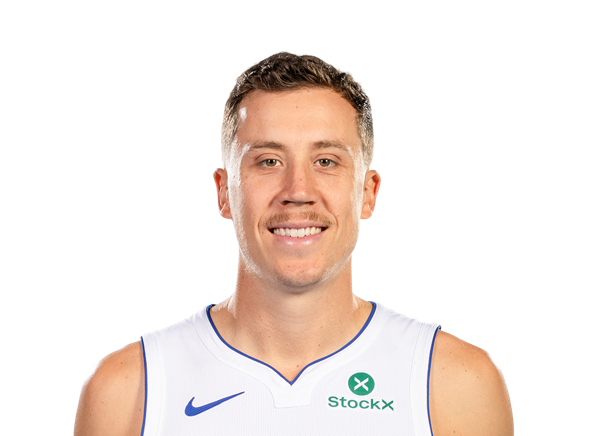
Duncan Robinson
#7

Paul Reed
#20
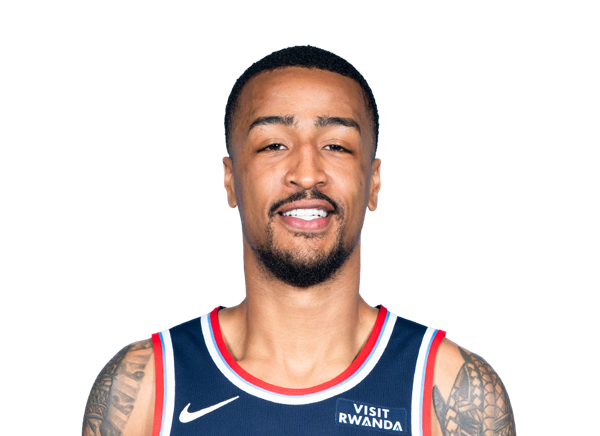
John Collins
#5
Ronald Holland II
#35

Tolu Smith
#12

Taurean Prince
Center

Jalen Duren
#13

Isaac Jones
Team Statistics
Lakers
1st in Pacific Division
VS
Pistons
1st in Central Division
General
39.9
Rebounds Per Game
44.0
1.5
Assist To Turnover Ratio
1.9
24.3
Fouls Per Game
22.4
10
Games Played
8
0
Games Started
0
0
Minutes
0
0.0
Minutes Per Game
0.0
399
Rebounds
352
399
Rebounds
352
Offensive
79.9
Free Throw Percentage
75.9
37.9
3-Point Field Goal Percentage
37.8
41.6
Average Field Goals Made
39.8
82.3
Average Field Goals Attempted
85.0
14.2
Average 3-Point Field Goals Made
13.9
37.5
Average 3-Point Field Goals Attempted
36.8
24.6
Average Free Throws Made
17.8
30.8
Average Free Throws Attempted
23.4
122.0
Points Per Game
111.1
10.8
Offensive Rebounds Per Game
10.3
24.0
Assists Per Game
26.9
16.3
Turnovers Per Game
14.5
61.2
2-Point Field Goal Percentage
53.6
1.482
Scoring Efficiency
1.307
0.59
Shooting Efficiency
0.55
50.5
Field Goal Percentage
46.8
274.0
2-Point Field Goals Made
207.0
448.0
2-Point Field Goals Attempted
386.0
1220
Points
889
108
Offensive Rebounds
82
240
Assists
215
163
Turnovers
116
416
Field Goals Made
318
823
Field Goals Attempted
680
246
Free Throws Made
142
308
Free Throws Attempted
187
142
3-Point Field Goals Made
111
375
3-Point Field Goals Attempted
294
37.9
3-Point Field Goal Percentage
37.8
27.4
2-Point Field Goals Made per Game
25.9
44.8
2-Point Field Goals Attempted per Game
48.3
Defensive
29.1
Defensive Rebounds Per Game
33.8
6.5
Blocks Per Game
6.5
10.7
Steals Per Game
9.3
291
Defensive Rebounds
270
107
Steals
74
65
Blocks
52