

Bulls vs Spurs Live Score (19 Dec, 2026)
Game Information
League
NBA
Season
1
Date
December 18, 2026
Tipoff
8:00 PM EST
Status
Scheduled
Team Stats
 CHI
Game Comparison
SA
-Points-
-Rebounds-
-Assists-
45Field Goal %47
-3-Point %-
-Free Throw %-
Game Leaders
CHISA
 —#
Points
—
—#
—#
Rebounds
—
—#
—#
Assists
—
—#
Injury Report
H2H / Season Series
Last 5 Games








NBA Standings
Eastern Conference — Central


Western Conference — Southwest
| Team | W | L | PCT | GB | STRK |
|---|---|---|---|---|---|
| San Antonio | 13 | 3 | .813 | - | W1 |
 Houston | 12 | 4 | .750 | 1 | W1 |
 Memphis | 12 | 4 | .750 | 1 | W5 |
 Dallas | 8 | 7 | .533 | 4.5 | W1 |
 New Orleans | 5 | 11 | .313 | 8 | L1 |
Rosters
Bulls
4th in Central Division
VS
Spurs
1st in Western Conference Division
Guard
#24

Norman Powell
#30

Tre Jones
#3

Josh Giddey
#7
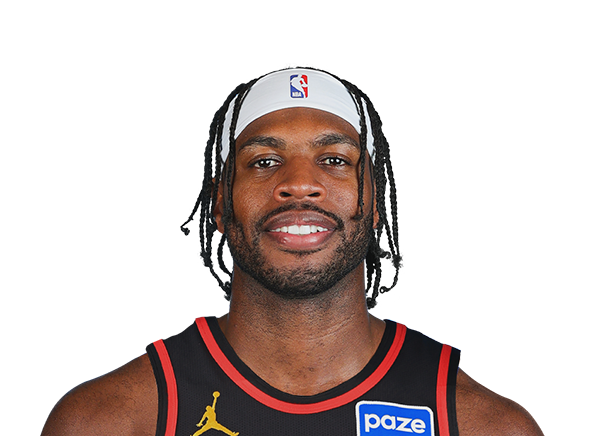
Buddy Hield
#22
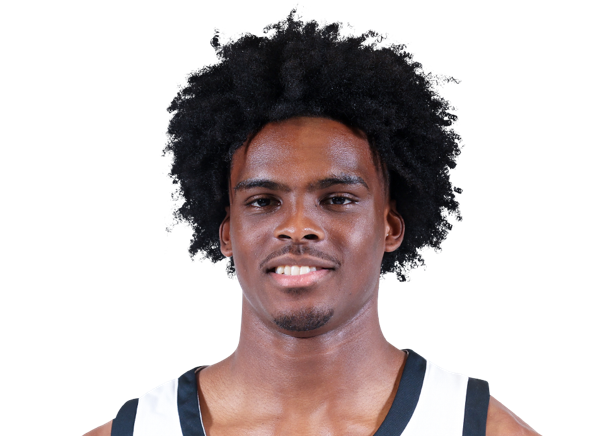
Jaylin Sellers
#15

Jordan Hawkins
#5
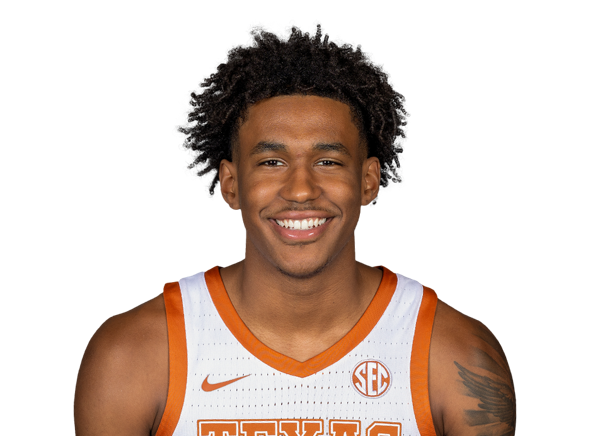
Dailyn Swain
Forward
#8

Caleb Wilson
#14

Matas Buzelis
#25
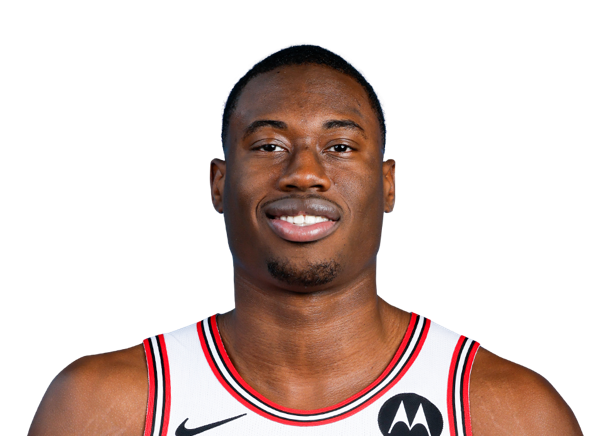
Jalen Smith
#35

Isaac Okoro
#11

Leonard Miller
#2
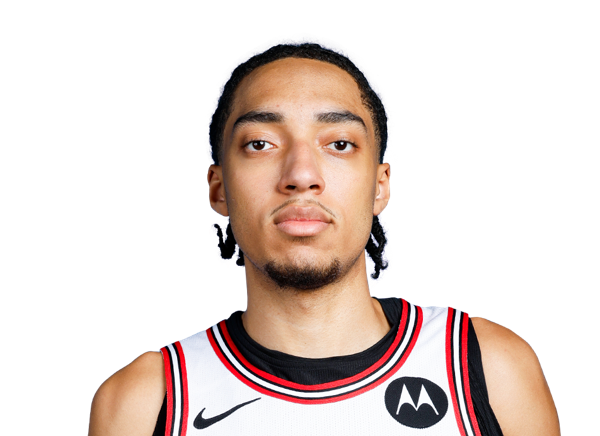
Noa Essengue
#12

Zach Collins
#44
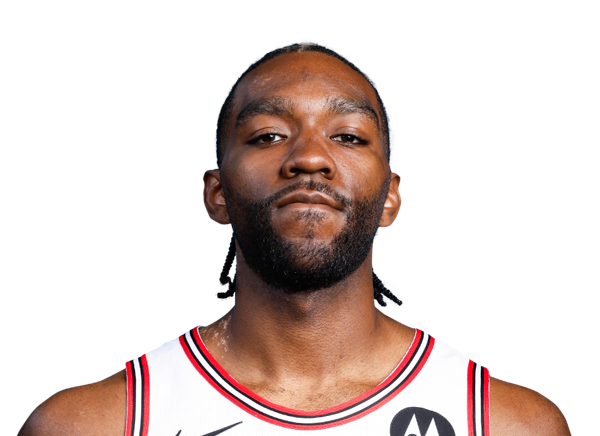
Patrick Williams
#19
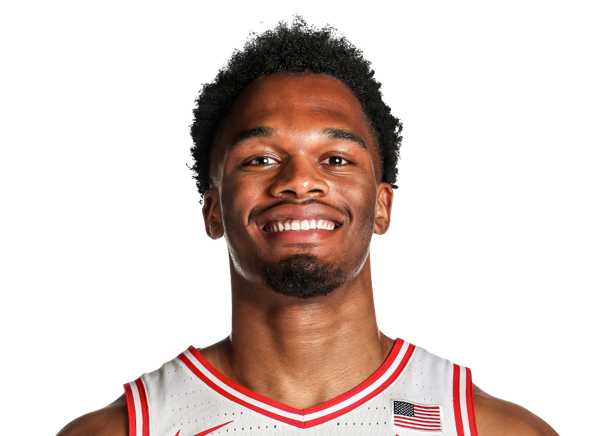
Tobe Awaka
Center
#9

Nic Claxton
Forward
#1
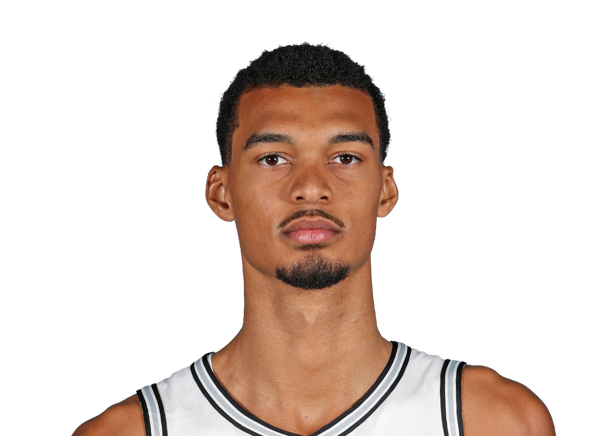
Victor Wembanyama
#30

Julian Champagnie
#3
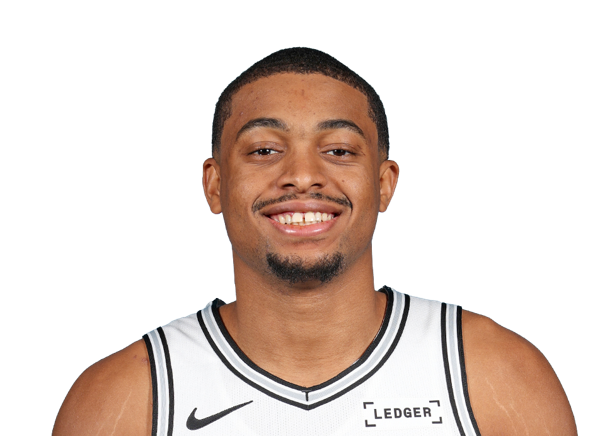
Keldon Johnson
#40
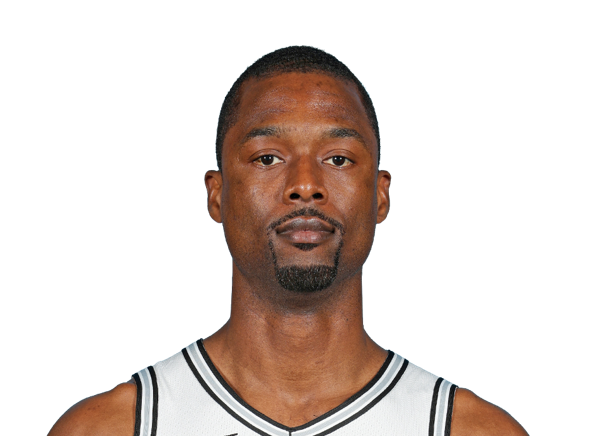
Harrison Barnes
#11
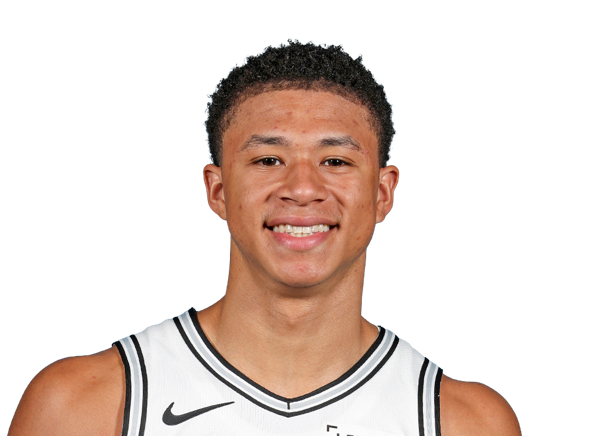
Carter Bryant
#25
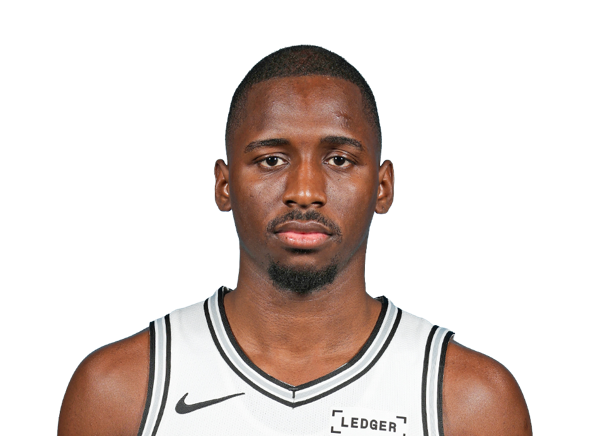
David Jones Garcia
#15
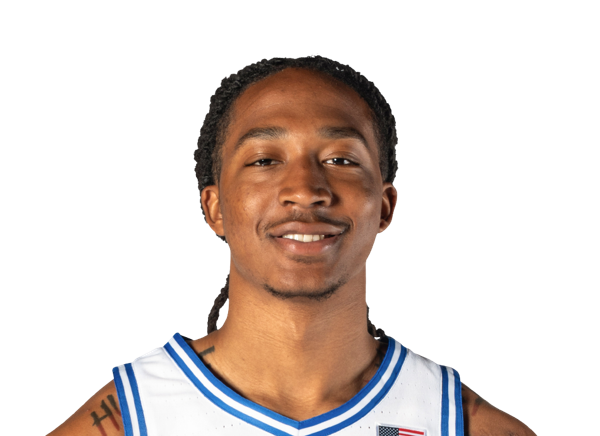
Maliq Brown
#23
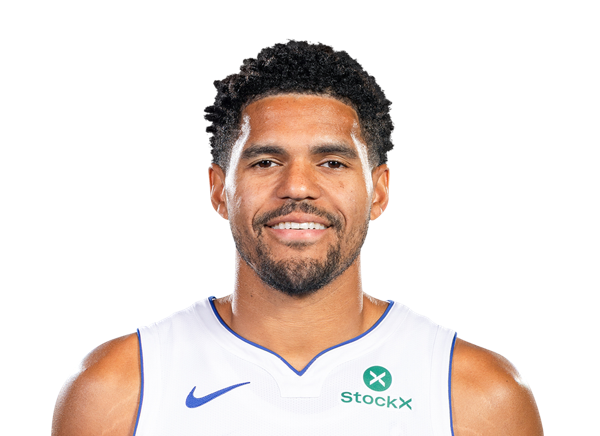
Tobias Harris
#22
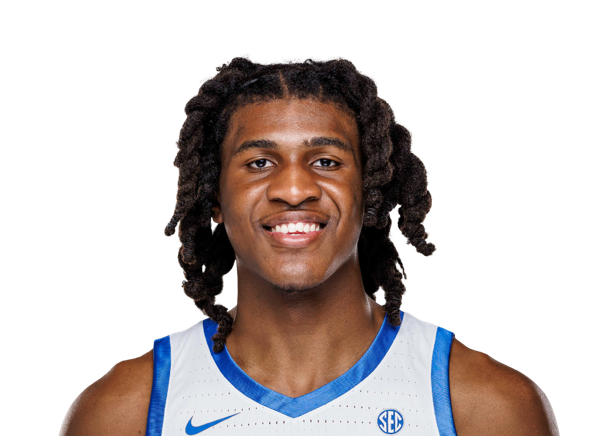
Jayden Quaintance
Guard
#2
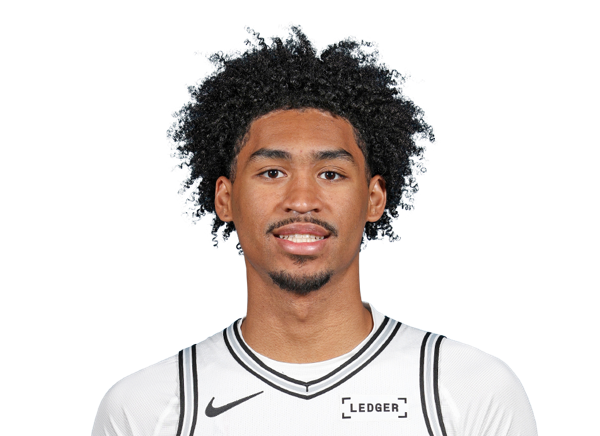
Dylan Harper
#5
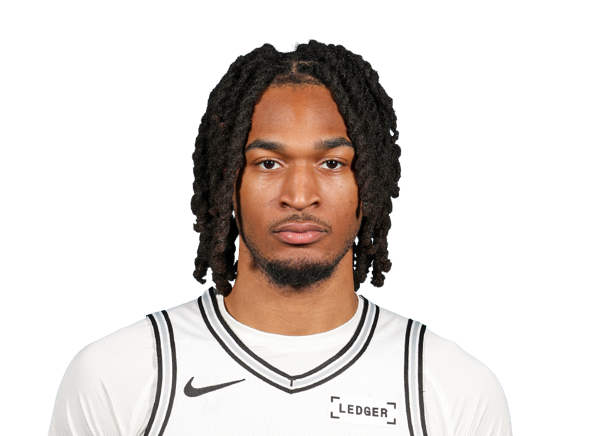
Stephon Castle
#4
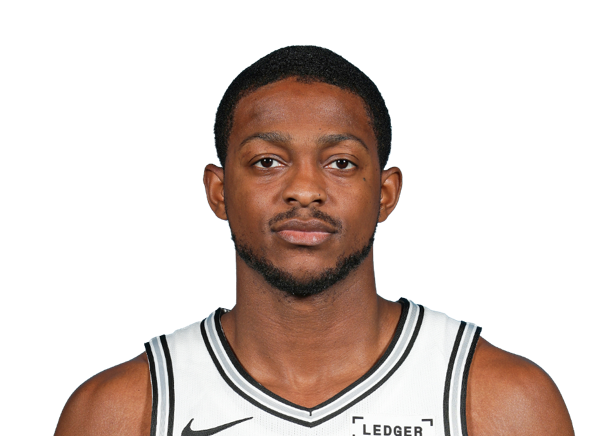
De'Aaron Fox
#24

Devin Vassell
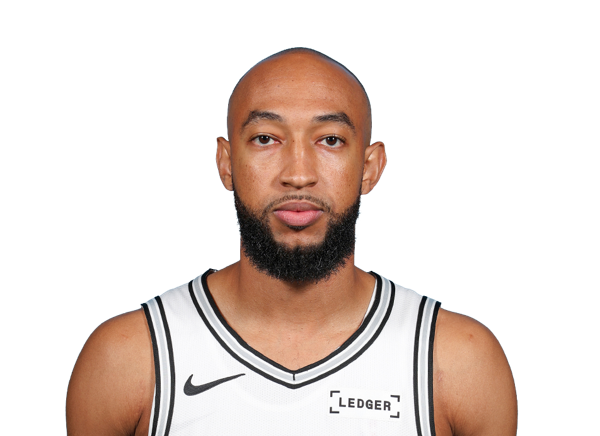
Jordan McLaughlin
#17
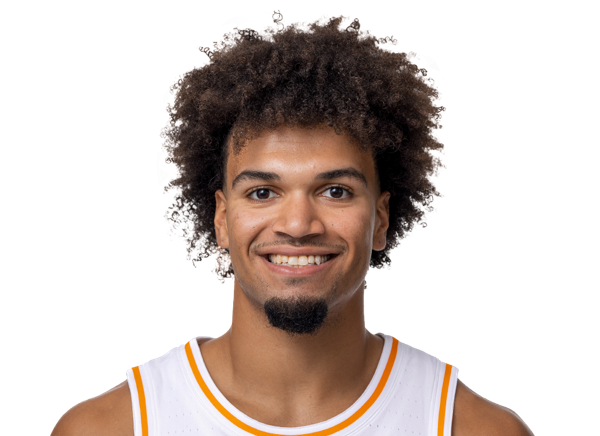
Ja'Kobi Gillespie
Center
#7

Luke Kornet
#10
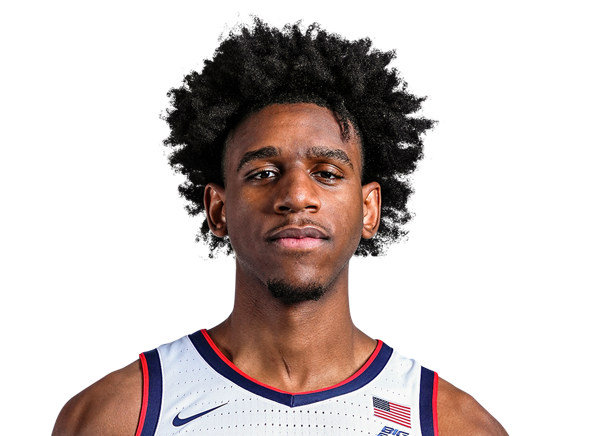
Tarris Reed Jr.
Team Statistics
Bulls
4th in Central Division
VS
Spurs
1st in Western Conference Division
General
43.8
Rebounds Per Game
47.8
1.7
Assist To Turnover Ratio
2.3
23.2
Fouls Per Game
18.8
15
Games Played
17
0
Games Started
0
0
Minutes
0
0.0
Minutes Per Game
0.0
657
Rebounds
812
657
Rebounds
812
Offensive
76.5
Free Throw Percentage
80.5
31.8
3-Point Field Goal Percentage
33.7
40.6
Average Field Goals Made
42.5
90.0
Average Field Goals Attempted
90.9
12.9
Average 3-Point Field Goals Made
12.4
40.7
Average 3-Point Field Goals Attempted
36.9
20.6
Average Free Throws Made
19.9
26.9
Average Free Throws Attempted
24.8
114.7
Points Per Game
117.3
12.7
Offensive Rebounds Per Game
12.7
27.5
Assists Per Game
28.5
16.5
Turnovers Per Game
12.2
56.2
2-Point Field Goal Percentage
55.6
1.275
Scoring Efficiency
1.290
0.52
Shooting Efficiency
0.54
45.1
Field Goal Percentage
46.7
415.0
2-Point Field Goals Made
511.0
739.0
2-Point Field Goals Attempted
919.0
1721
Points
1994
190
Offensive Rebounds
216
413
Assists
484
248
Turnovers
208
609
Field Goals Made
722
1350
Field Goals Attempted
1546
309
Free Throws Made
339
404
Free Throws Attempted
421
194
3-Point Field Goals Made
211
611
3-Point Field Goals Attempted
627
31.8
3-Point Field Goal Percentage
33.7
27.7
2-Point Field Goals Made per Game
30.1
49.3
2-Point Field Goals Attempted per Game
54.1
Defensive
31.1
Defensive Rebounds Per Game
35.1
5.5
Blocks Per Game
6.8
8.3
Steals Per Game
8.5
467
Defensive Rebounds
596
124
Steals
144
83
Blocks
115