

Cavaliers vs Pelicans Live Score (26 Jan, 2027)
Game Information
League
NBA
Season
1
Date
January 25, 2027
Tipoff
8:00 PM EST
Status
Scheduled
Team Stats
 CLE
Game Comparison
NO

-Points-
-Rebounds-
-Assists-
47Field Goal %48
-3-Point %-
-Free Throw %-
Game Leaders
CLENO
 —#
Points
—
—#
—#Rebounds
—
—#
—#Assists
—
—#
Injury Report
H2H / Season Series
Last 5 Games








NBA Standings
Eastern Conference — Central



Western Conference — Southwest
| Team | W | L | PCT | GB | STRK |
|---|---|---|---|---|---|
 Houston | 4 | 0 | 1.000 | - | W4 |
 Memphis | 4 | 0 | 1.000 | - | W4 |
 Dallas | 2 | 2 | .500 | 2 | W1 |
 San Antonio | 1 | 2 | .333 | 2.5 | W1 |
| New Orleans | 0 | 3 | .000 | 3.5 | L3 |
Rosters
Cavaliers
2nd in Central Division
VS
Pelicans
11th in Western Conference Division
Guard
#45
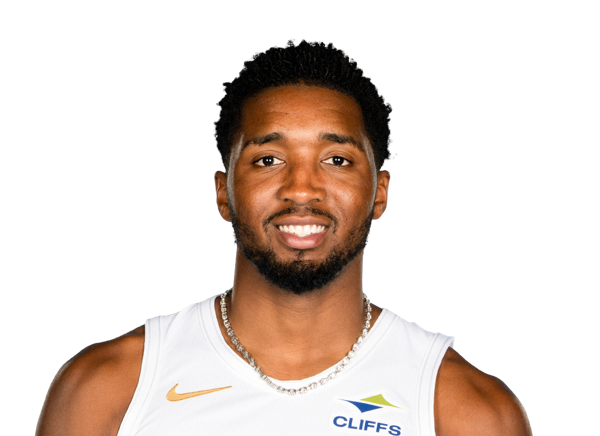
Donovan Mitchell
#1
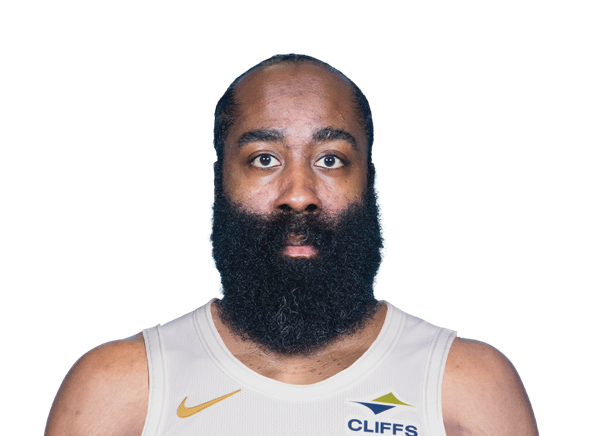
James Harden
#8

Peyton Watson
#5

Sam Merrill
#20

Jaylon Tyson
#24
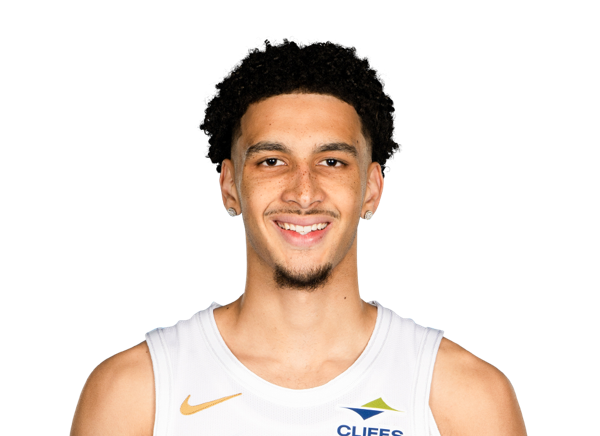
Tyrese Proctor
#9
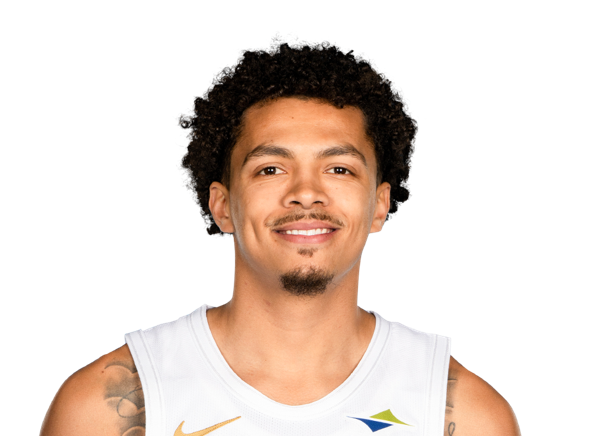
Craig Porter Jr.
#15

Meleek Thomas
Center
#4
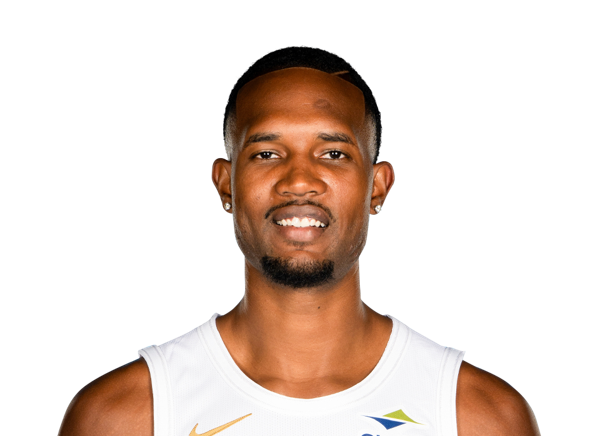
Evan Mobley
#31

Jarrett Allen
#3

Thomas Bryant
Forward
#33

Mario Hezonja
#21

Tristan Enaruna
#12

Riley Minix
Forward
#1

Zion Williamson
#41
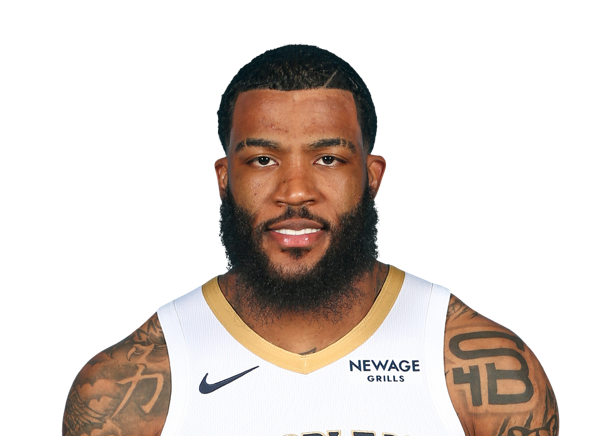
Saddiq Bey
#25

Trey Murphy III
#17

Karlo Matkovic
#2

Herbert Jones
#9
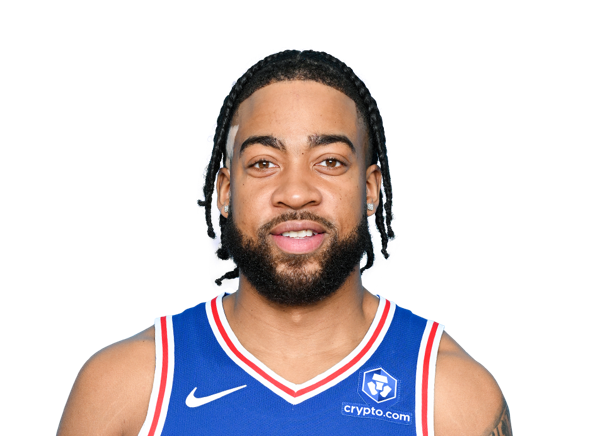
Trendon Watford
#13

Julian Reese
Guard

Jeremiah Fears
#24
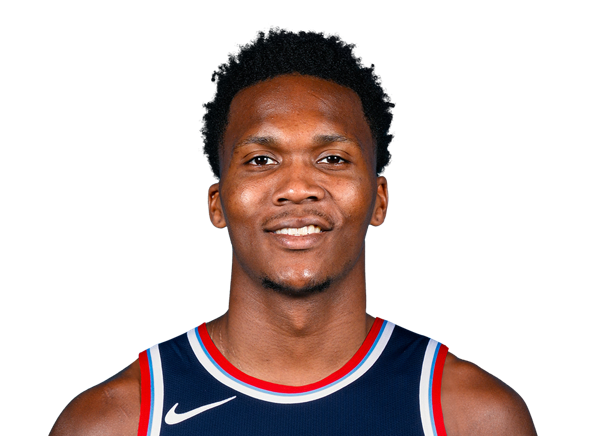
Bennedict Mathurin
#5

Dejounte Murray
#3

Jordan Poole
#11

Bryce McGowens
#14
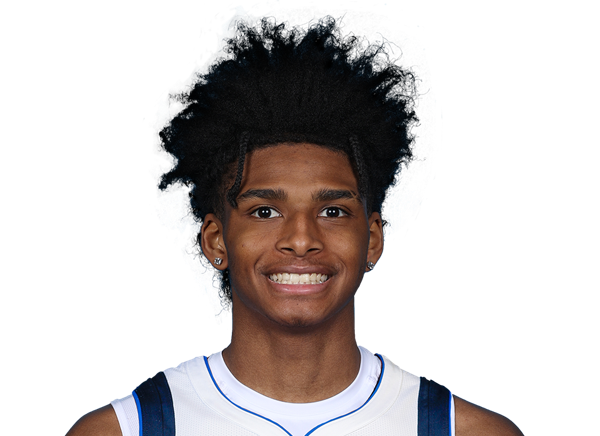
AJ Johnson
Center
#22
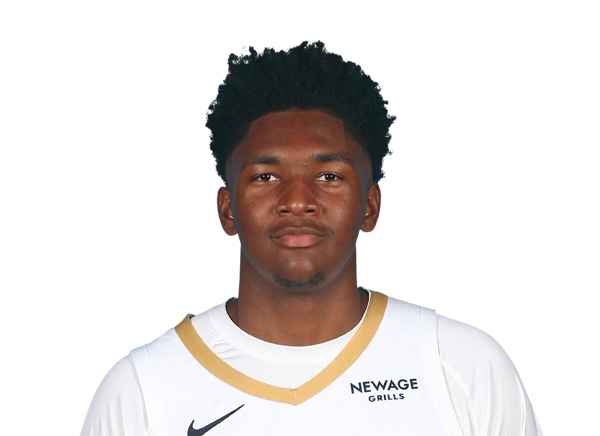
Derik Queen
#21
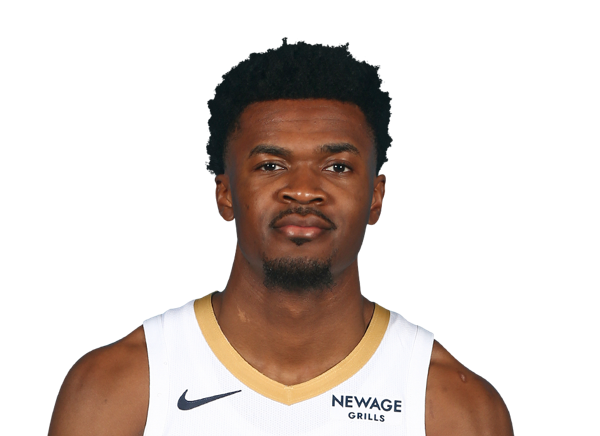
Yves Missi
#6

DeAndre Jordan
Team Statistics
Cavaliers
2nd in Central Division
VS
Pelicans
11th in Western Conference Division
General
47.9
Rebounds Per Game
44.4
2.1
Assist To Turnover Ratio
1.5
20.9
Fouls Per Game
22.6
7
Games Played
7
0
Games Started
0
0
Minutes
0
0.0
Minutes Per Game
0.0
335
Rebounds
311
335
Rebounds
311
Offensive
74.7
Free Throw Percentage
80.8
36.9
3-Point Field Goal Percentage
32.4
42.6
Average Field Goals Made
43.9
90.9
Average Field Goals Attempted
88.4
15.1
Average 3-Point Field Goals Made
9.6
41.0
Average 3-Point Field Goals Attempted
29.6
19.4
Average Free Throws Made
24.6
26.0
Average Free Throws Attempted
30.4
119.7
Points Per Game
121.9
11.6
Offensive Rebounds Per Game
10.6
29.0
Assists Per Game
25.7
13.7
Turnovers Per Game
16.7
55.0
2-Point Field Goal Percentage
58.3
1.318
Scoring Efficiency
1.378
0.55
Shooting Efficiency
0.55
46.9
Field Goal Percentage
49.6
192.0
2-Point Field Goals Made
240.0
349.0
2-Point Field Goals Attempted
412.0
838
Points
853
81
Offensive Rebounds
74
203
Assists
180
96
Turnovers
117
298
Field Goals Made
307
636
Field Goals Attempted
619
136
Free Throws Made
172
182
Free Throws Attempted
213
106
3-Point Field Goals Made
67
287
3-Point Field Goals Attempted
207
36.9
3-Point Field Goal Percentage
32.4
27.4
2-Point Field Goals Made per Game
34.3
49.9
2-Point Field Goals Attempted per Game
58.9
Defensive
36.3
Defensive Rebounds Per Game
33.9
6.0
Blocks Per Game
4.6
7.6
Steals Per Game
12.9
254
Defensive Rebounds
237
53
Steals
90
42
Blocks
32