

Clippers vs Grizzlies Live Score (13 Feb, 2027)
Game Information
League
NBA
Season
1
Date
February 12, 2027
Tipoff
8:00 PM EST
Status
Scheduled
Team Stats
 LAC
Game Comparison
MEM
-Points-
-Rebounds-
-Assists-
46Field Goal %47
-3-Point %-
-Free Throw %-
Game Leaders
LACMEM
 —#
Points
—
—#
—#
Rebounds
—
—#
—#
Assists
—
—#
Injury Report
H2H / Season Series
Last 5 Games





NBA Standings
Western Conference — Pacific
| Team | W | L | PCT | GB | STRK |
|---|---|---|---|---|---|
 LA Lakers | 11 | 2 | .846 | - | W7 |
 Golden State | 8 | 5 | .615 | 3 | L2 |
 Phoenix | 5 | 6 | .455 | 5 | W2 |
| LA Clippers | 3 | 8 | .273 | 7 | W1 |
 Sacramento | 1 | 11 | .083 | 9.5 | L5 |
Western Conference — Southwest
| Team | W | L | PCT | GB | STRK |
|---|---|---|---|---|---|
 San Antonio | 11 | 2 | .846 | - | W11 |
 Houston | 10 | 3 | .769 | 1 | W3 |
| Memphis | 8 | 4 | .667 | 2.5 | W1 |
 Dallas | 7 | 5 | .583 | 3.5 | L1 |
 New Orleans | 4 | 9 | .308 | 7 | L5 |
Rosters
Clippers
4th in Pacific Division
VS
Grizzlies
4th in Western Conference Division
Guard
#10

Darius Garland
#1
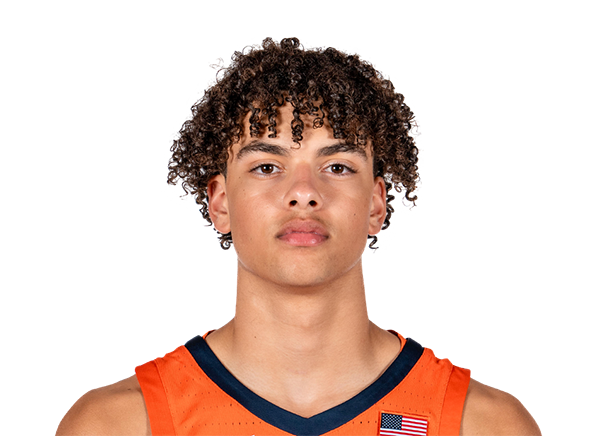
Keaton Wagler
#4
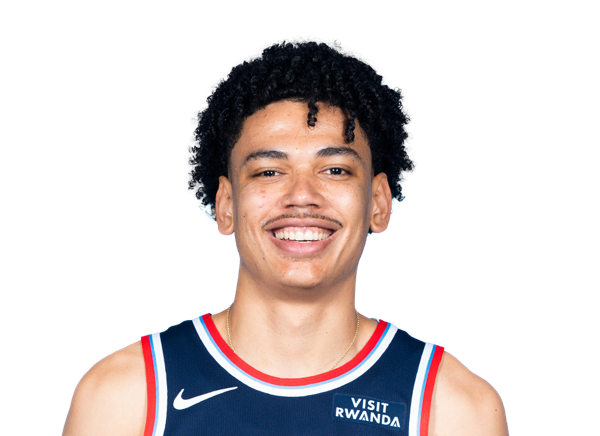
Kobe Sanders
#9
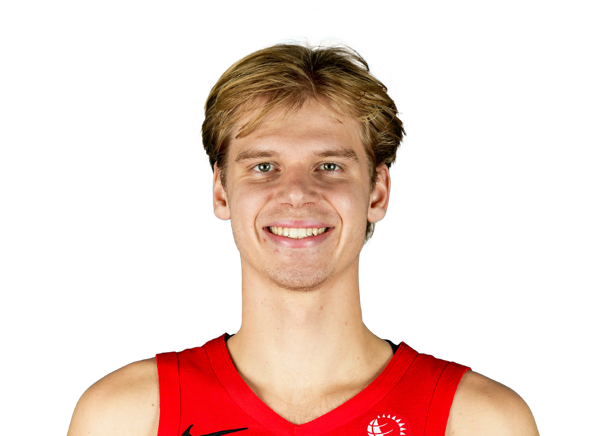
Gradey Dick
#8

Kris Dunn
#31
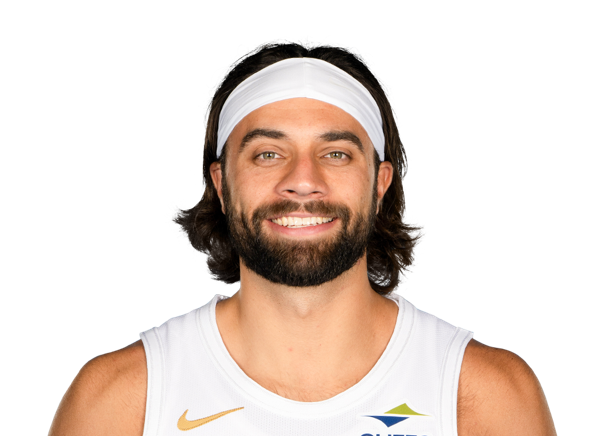
Max Strus
#21
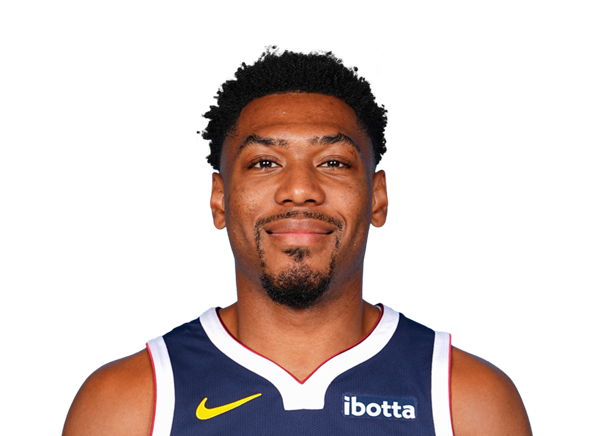
Jalen Pickett
#24

Cam Christie
#20

Blake Wesley
#3
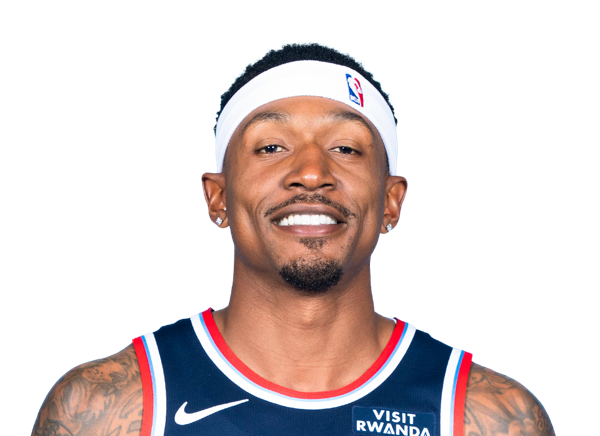
Bradley Beal
#22
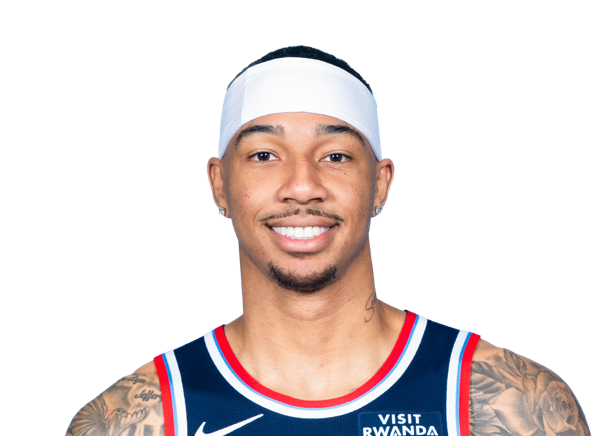
Jordan Miller
Center
#11
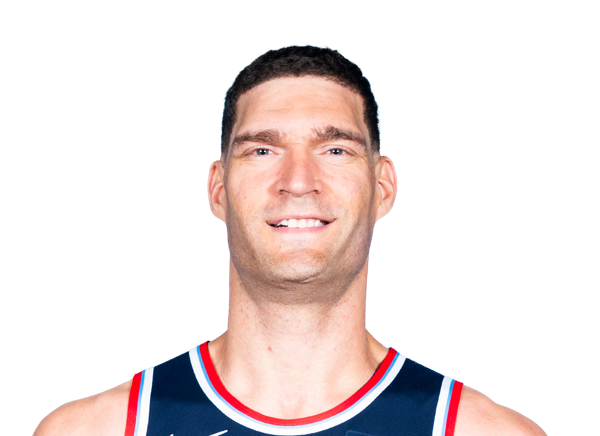
Brook Lopez
#14
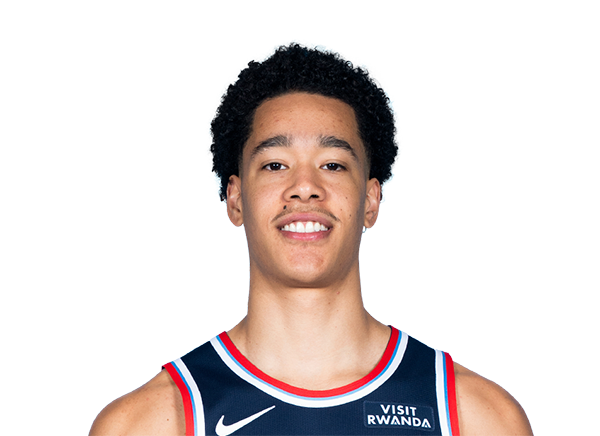
Yanic Konan Niederhauser
Forward
#28
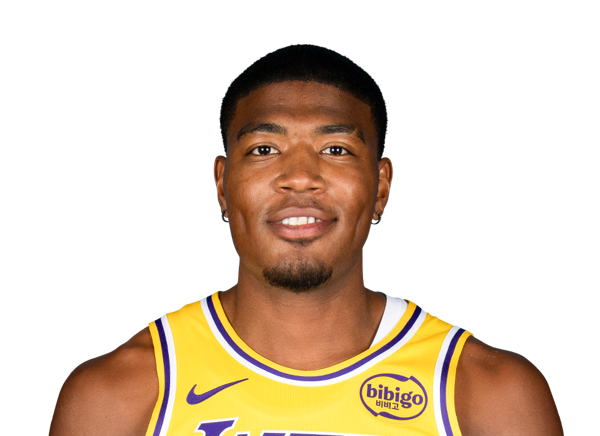
Rui Hachimura
#5
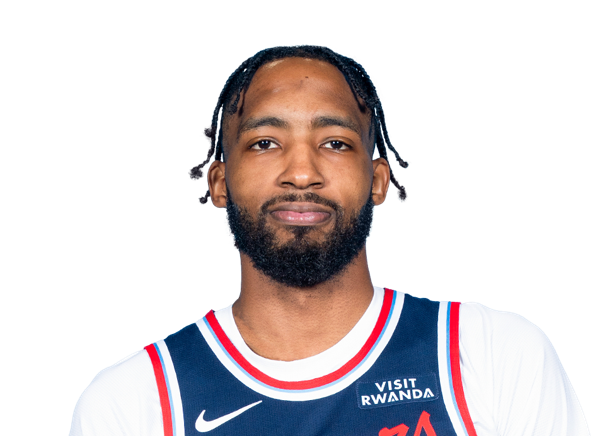
Derrick Jones Jr.
#23
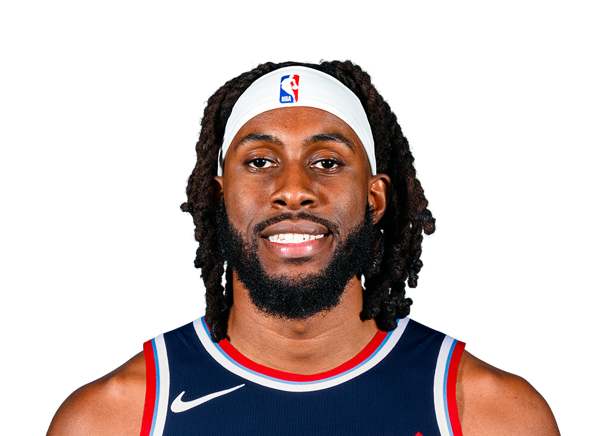
Isaiah Jackson
#18
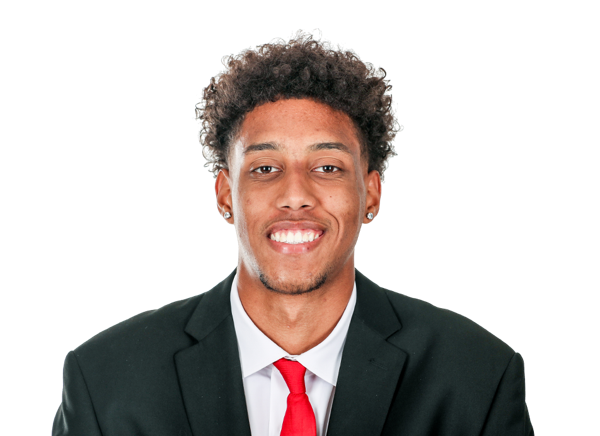
Baba Miller
#12
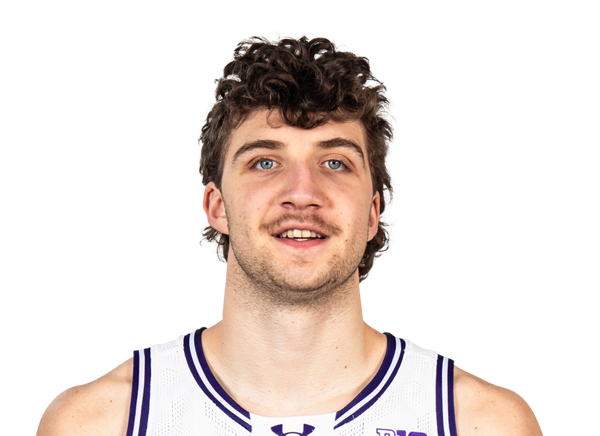
Nick Martinelli
#7
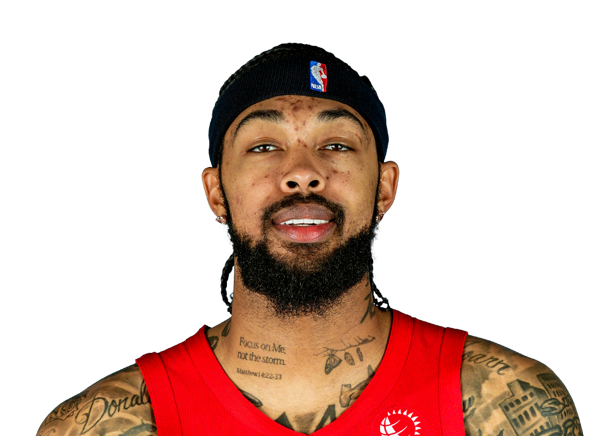
Brandon Ingram
Guard
#2
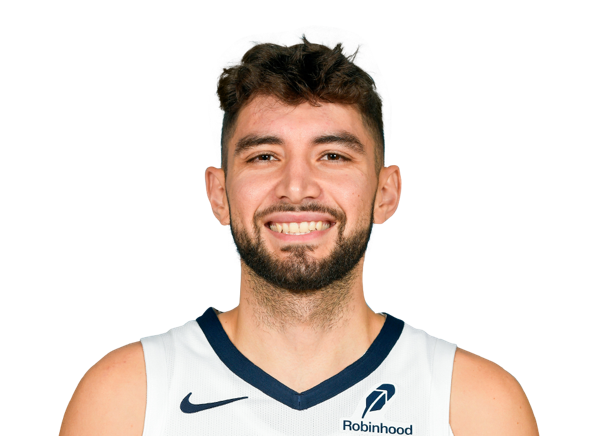
Ty Jerome
#24

Cam Spencer
#10
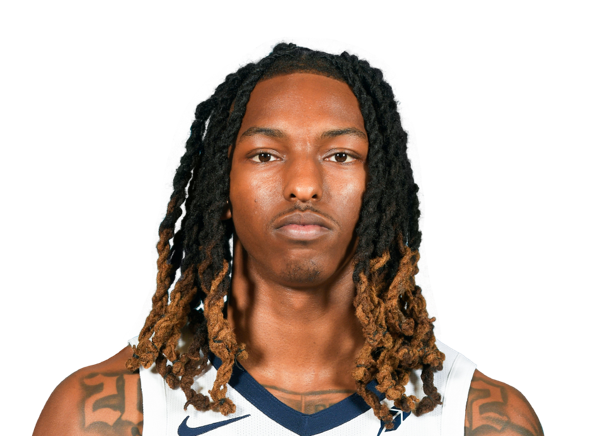
Javon Small
#1
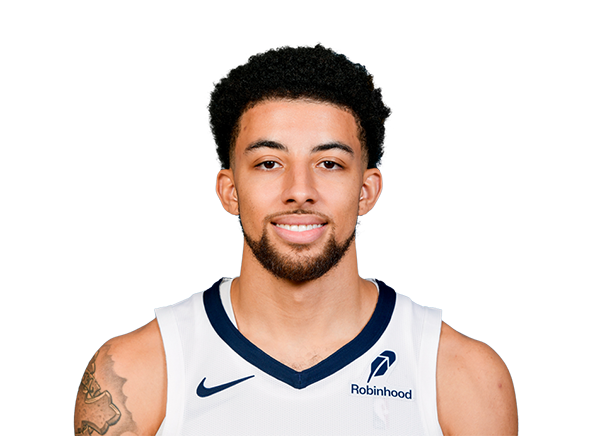
Scotty Pippen Jr.
#21
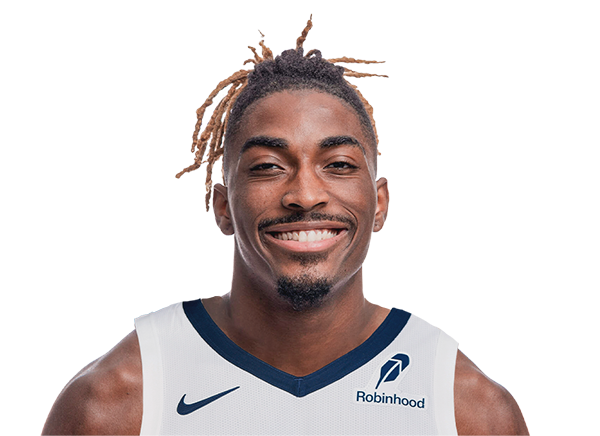
Jahmai Mashack
#5

Richie Saunders
Forward
#27
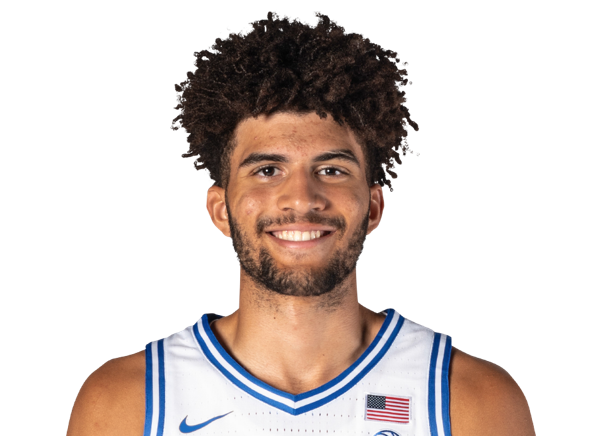
Cameron Boozer
#23
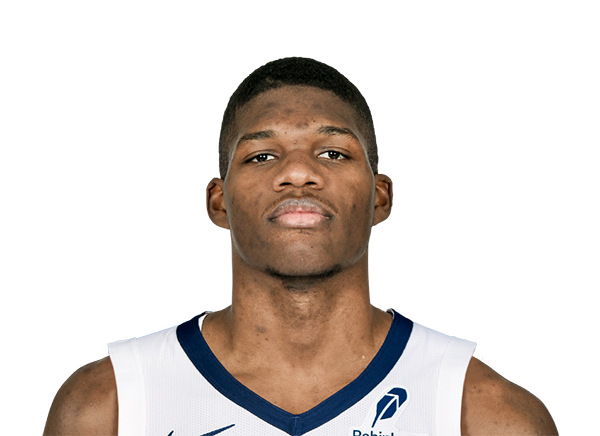
Cedric Coward
#3
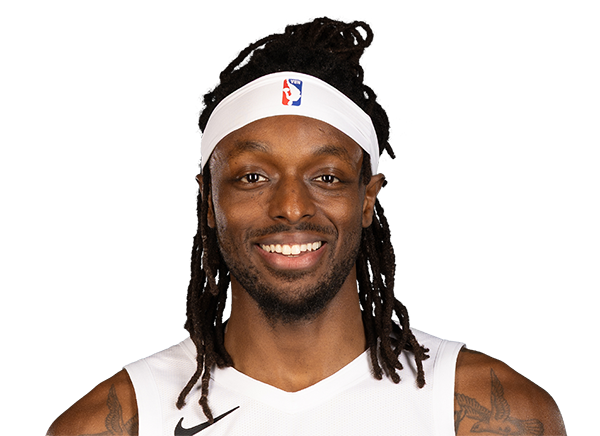
Jerami Grant
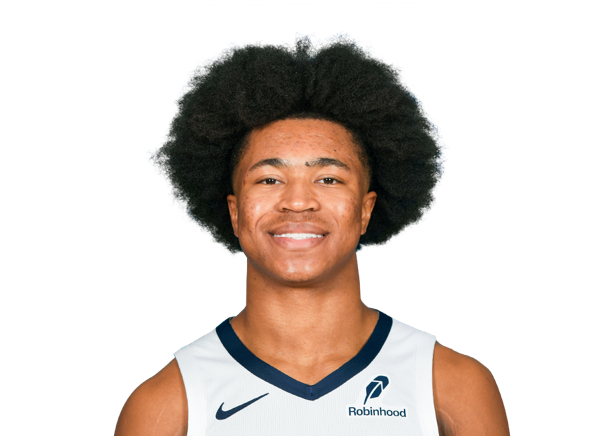
Jaylen Wells
#22

Taylor Hendricks
#45
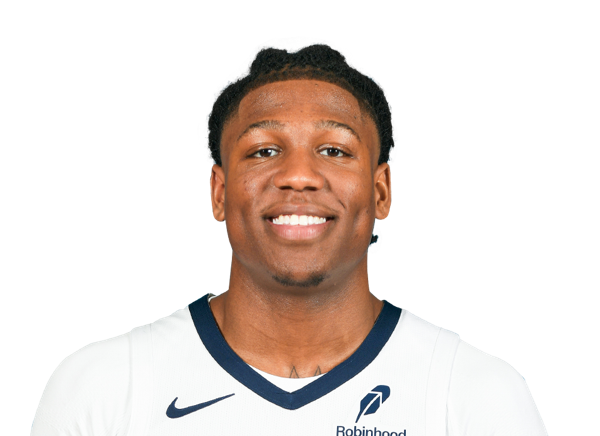
GG Jackson
#17
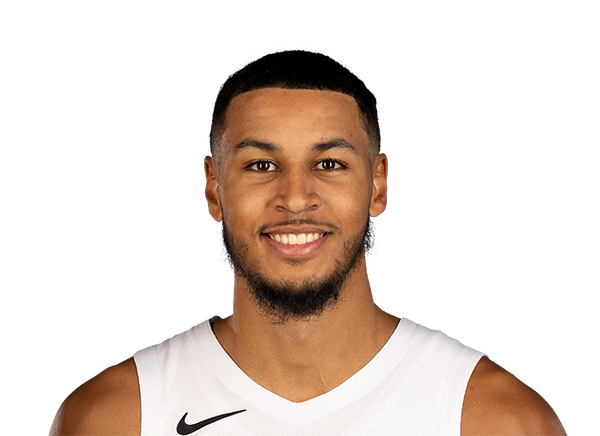
Kris Murray
#18
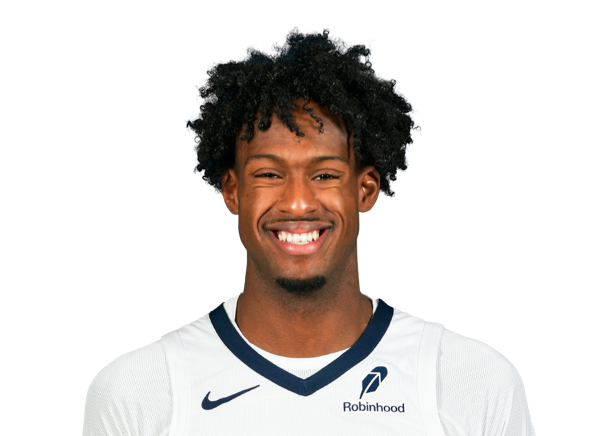
Olivier-Maxence Prosper
#35
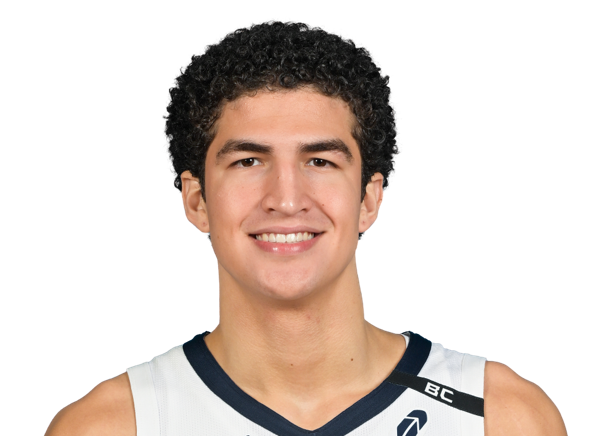
Karim Lopez
Center
#28
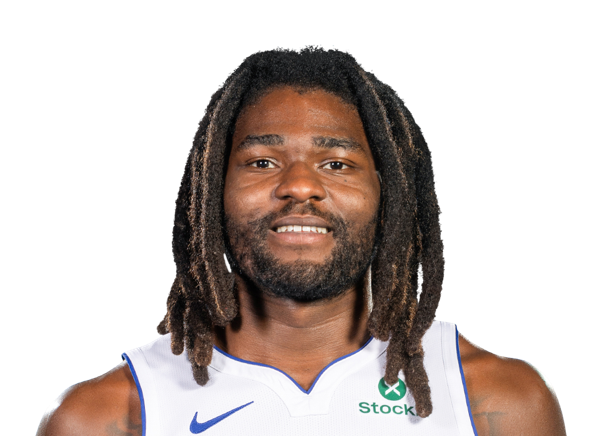
Isaiah Stewart
#14

Zach Edey
#41
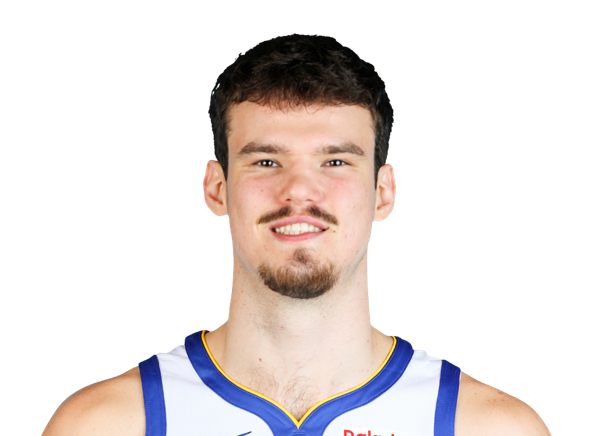
Quinten Post
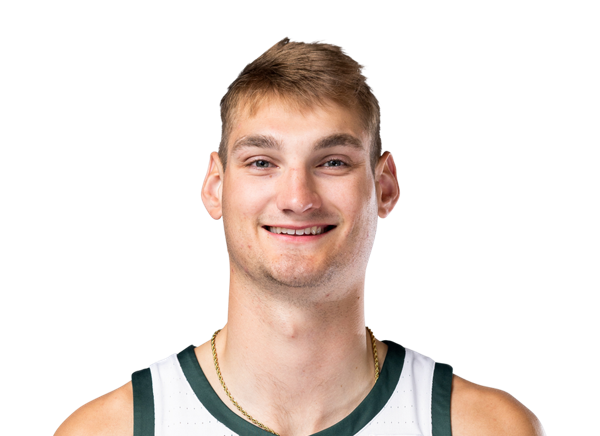
Carson Cooper
Team Statistics
Clippers
4th in Pacific Division
VS
Grizzlies
4th in Western Conference Division
General
40.2
Rebounds Per Game
47.4
1.6
Assist To Turnover Ratio
1.9
21.9
Fouls Per Game
23.7
12
Games Played
14
0
Games Started
0
0
Minutes
0
0.0
Minutes Per Game
0.0
482
Rebounds
664
482
Rebounds
664
Offensive
78.8
Free Throw Percentage
84.6
39.1
3-Point Field Goal Percentage
39.5
39.3
Average Field Goals Made
42.9
84.4
Average Field Goals Attempted
89.8
14.4
Average 3-Point Field Goals Made
15.6
36.8
Average 3-Point Field Goals Attempted
39.4
19.3
Average Free Throws Made
20.4
24.4
Average Free Throws Attempted
24.1
112.3
Points Per Game
121.7
10.1
Offensive Rebounds Per Game
12.7
27.3
Assists Per Game
28.9
17.2
Turnovers Per Game
15.1
52.4
2-Point Field Goal Percentage
54.2
1.331
Scoring Efficiency
1.356
0.55
Shooting Efficiency
0.56
46.6
Field Goal Percentage
47.7
299.0
2-Point Field Goals Made
382.0
571.0
2-Point Field Goals Attempted
705.0
1348
Points
1704
121
Offensive Rebounds
178
327
Assists
404
206
Turnovers
212
472
Field Goals Made
600
1013
Field Goals Attempted
1257
231
Free Throws Made
286
293
Free Throws Attempted
338
173
3-Point Field Goals Made
218
442
3-Point Field Goals Attempted
552
39.1
3-Point Field Goal Percentage
39.5
24.9
2-Point Field Goals Made per Game
27.3
47.6
2-Point Field Goals Attempted per Game
50.4
Defensive
30.1
Defensive Rebounds Per Game
34.7
4.3
Blocks Per Game
5.1
9.3
Steals Per Game
6.5
361
Defensive Rebounds
486
112
Steals
91
52
Blocks
71