

Grizzlies vs Spurs Live Score (9 Jan, 2027)
Game Information
League
NBA
Season
1
Date
January 8, 2027
Tipoff
8:00 PM EST
Status
Scheduled
Team Stats
 MEM
Game Comparison
SA

-Points-
-Rebounds-
-Assists-
-Field Goal %-
-3-Point %-
-Free Throw %-
Injury Report
San Antonio Spurs

H2H / Season Series
Last 5 Games





NBA Standings
Western Conference — Southwest
| Team | W | L | PCT | GB | STRK |
|---|---|---|---|---|---|
 Houston | 1 | 0 | 1.000 | - | W1 |
| Memphis | 2 | 1 | .667 | - | W1 |
 New Orleans | 1 | 1 | .500 | 0.5 | L1 |
| San Antonio | 0 | 1 | .000 | 1 | L1 |
 Dallas | 0 | 1 | .000 | 1 | L1 |
Rosters
Grizzlies
4th in Western Conference Division
VS
Spurs
4th in Western Conference Division
Guard
#2

Ty Jerome
#24

Cam Spencer
#1
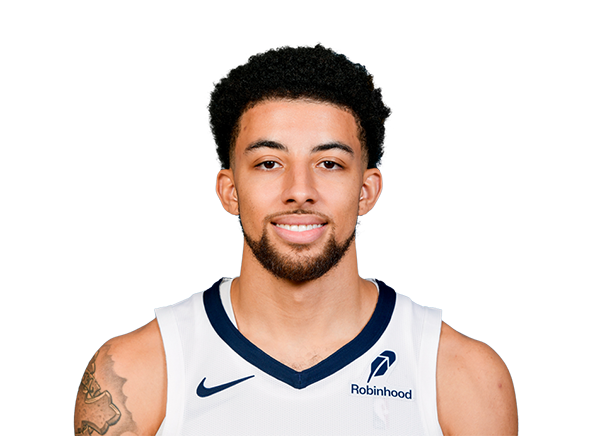
Scotty Pippen Jr.
#10
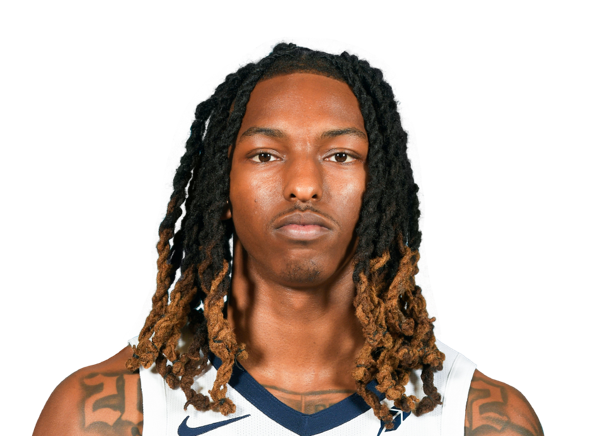
Javon Small
#21

Jahmai Mashack
Forward
#27
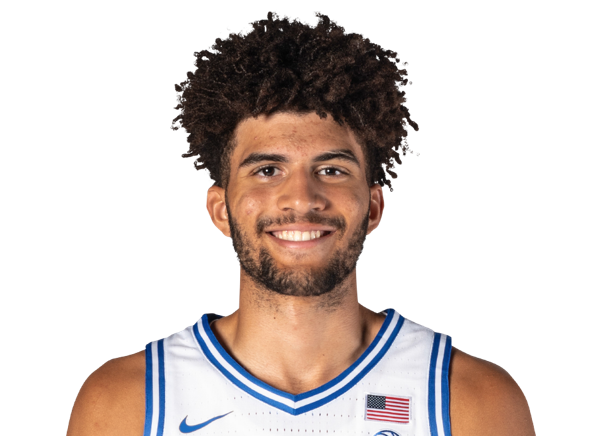
Cameron Boozer
#23
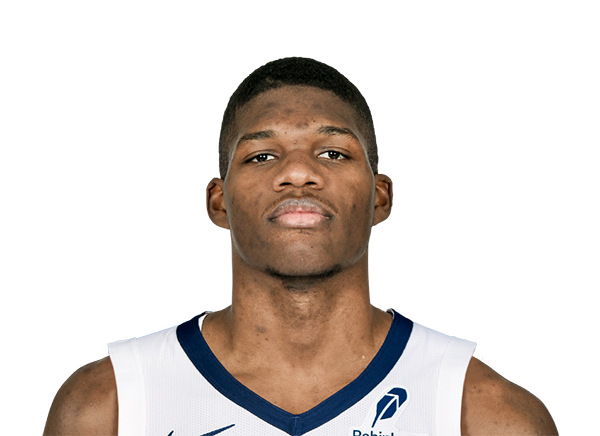
Cedric Coward
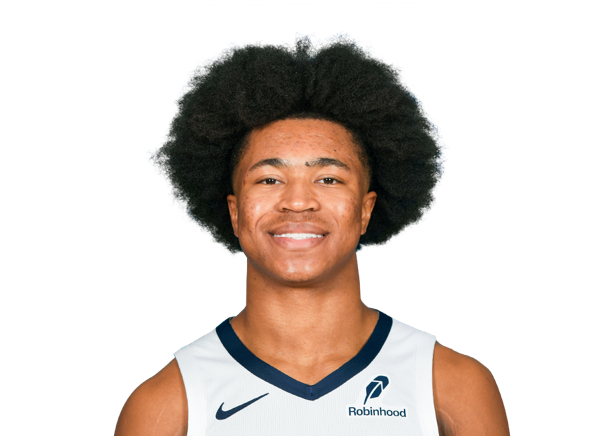
Jaylen Wells
#3

Jerami Grant
#45
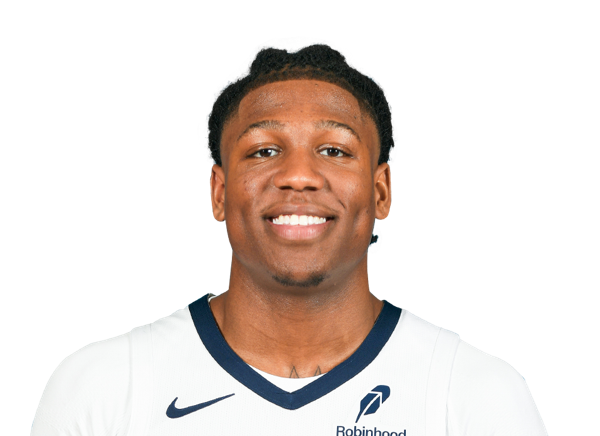
GG Jackson
#17
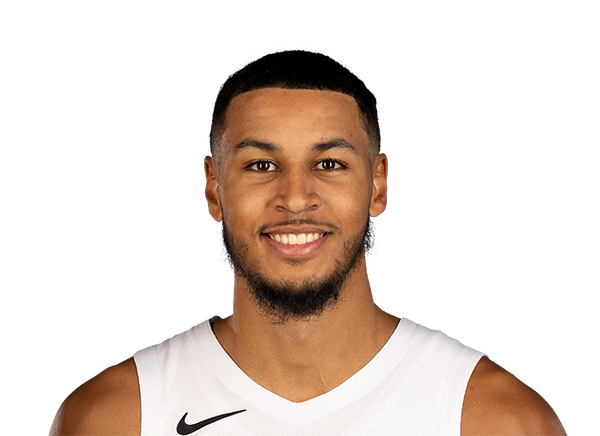
Kris Murray
#18
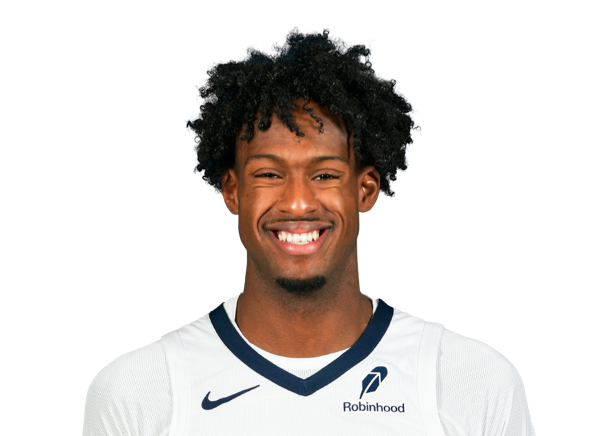
Olivier-Maxence Prosper
#22

Taylor Hendricks
#35
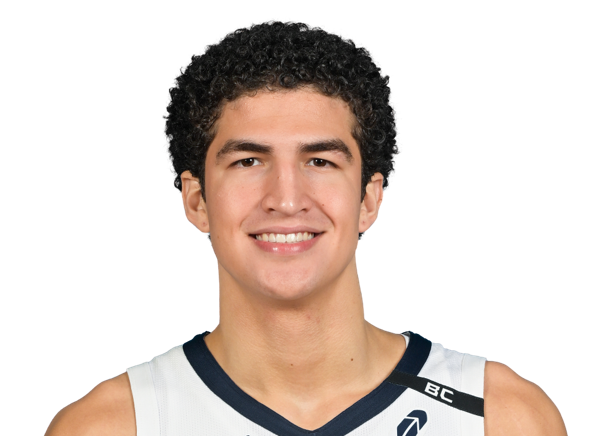
Karim Lopez
Center
#28
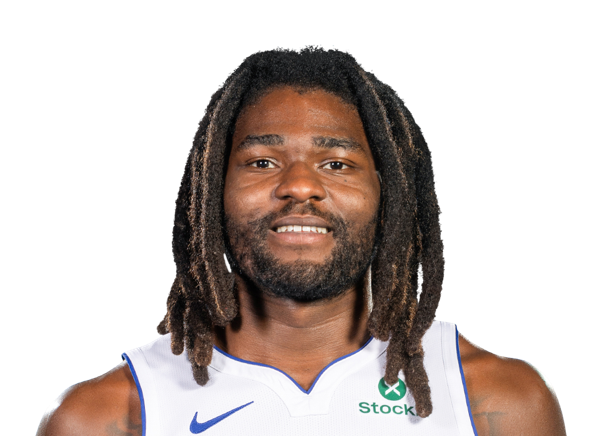
Isaiah Stewart
#14

Zach Edey
#41
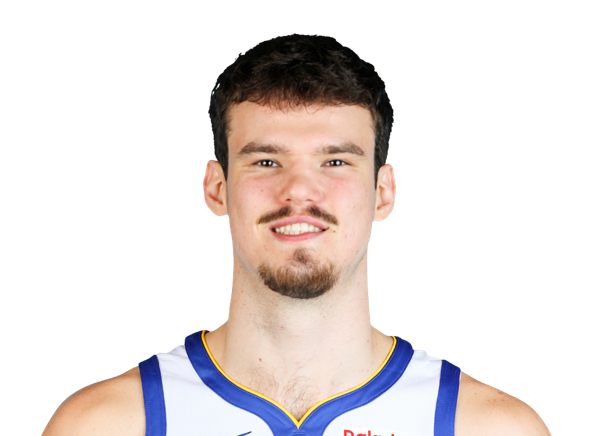
Quinten Post
#20

Carson Cooper
Forward
#1
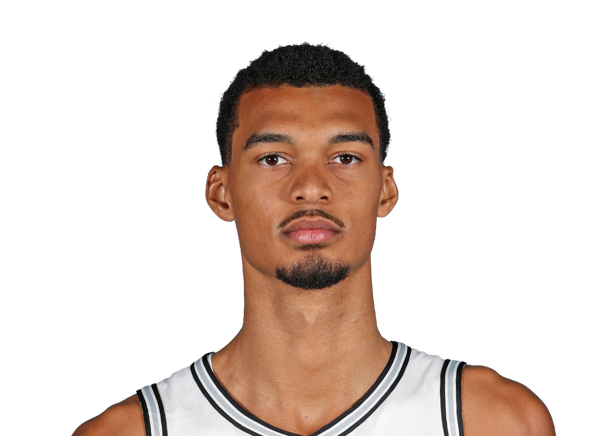
Victor Wembanyama
#30

Julian Champagnie
#3
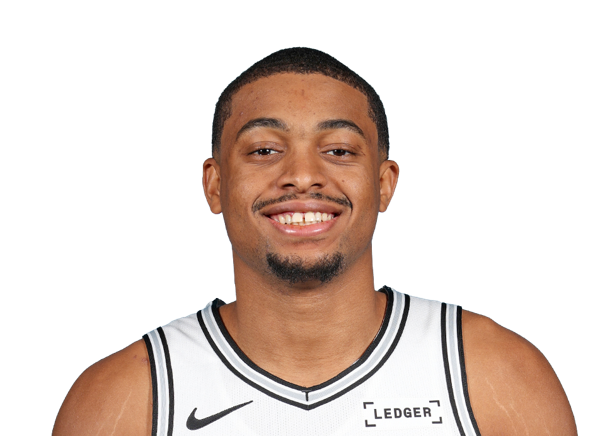
Keldon Johnson
#40
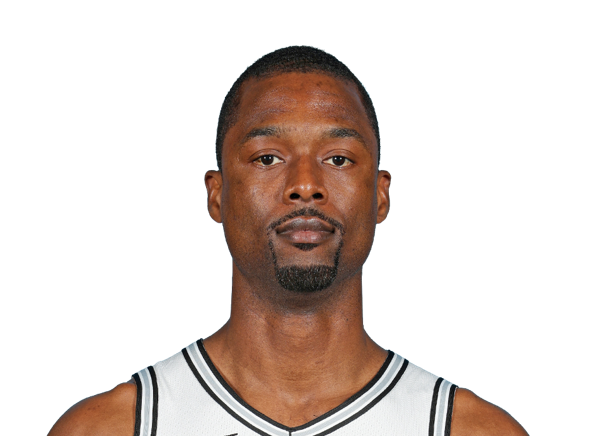
Harrison Barnes
#11
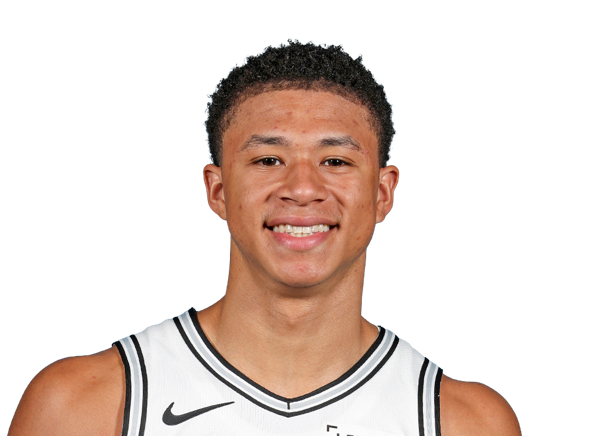
Carter Bryant
#25
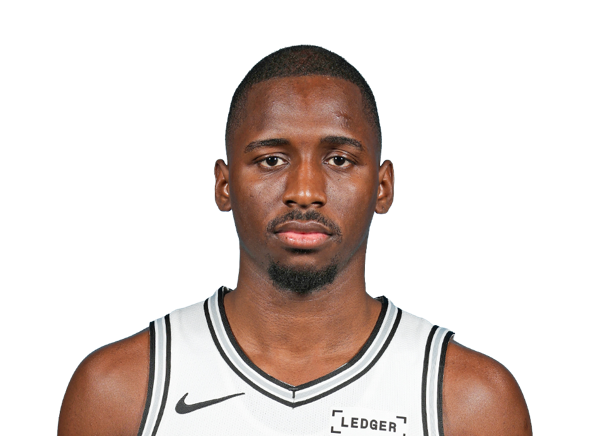
David Jones Garcia
#15
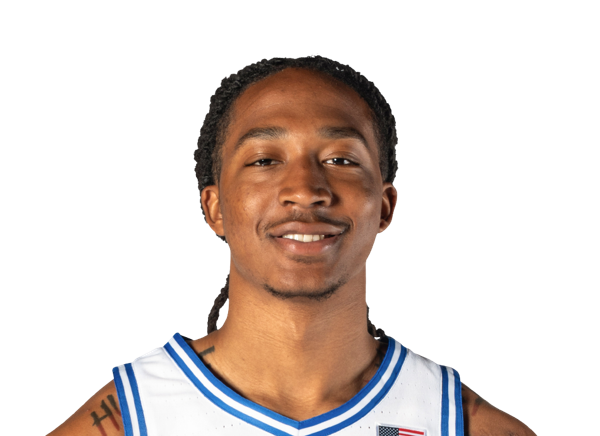
Maliq Brown
#23
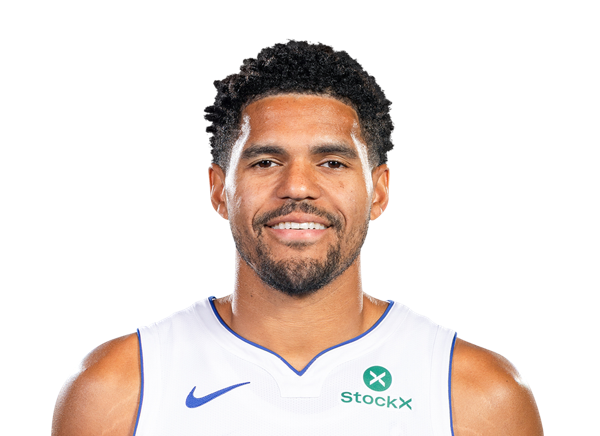
Tobias Harris
#22
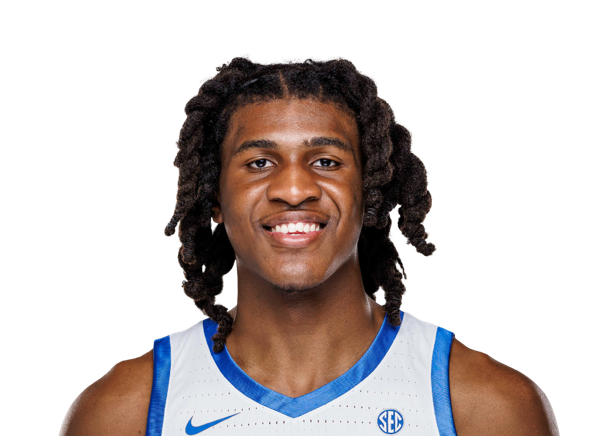
Jayden Quaintance
Guard
#2
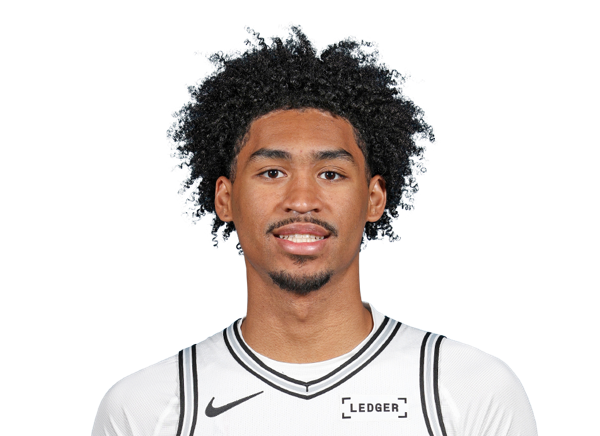
Dylan Harper
#4
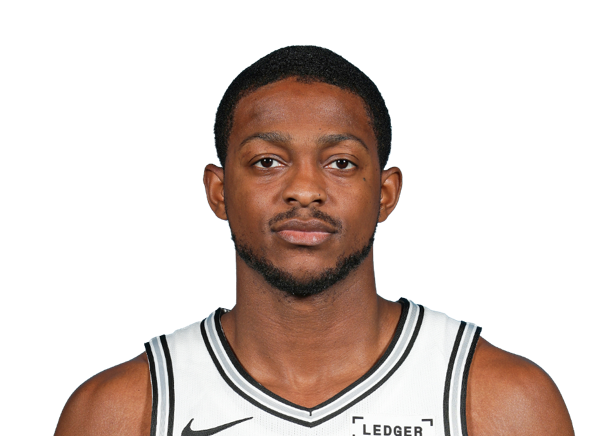
De'Aaron Fox
#5
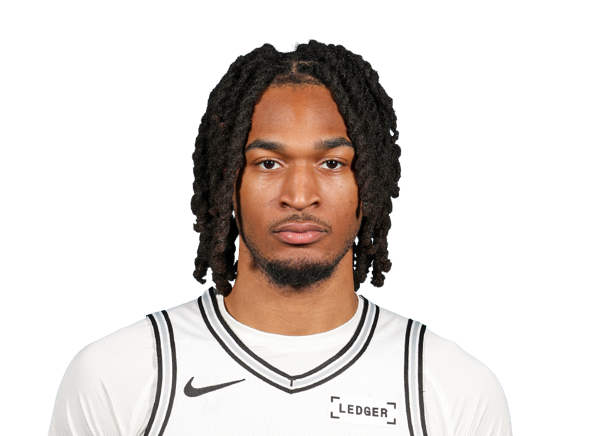
Stephon Castle
#24

Devin Vassell
#17
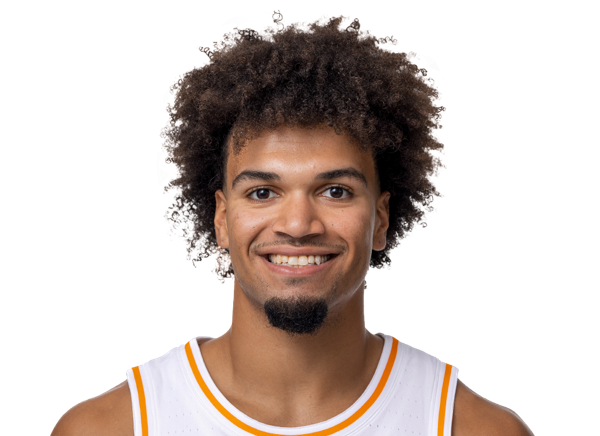
Ja'Kobi Gillespie
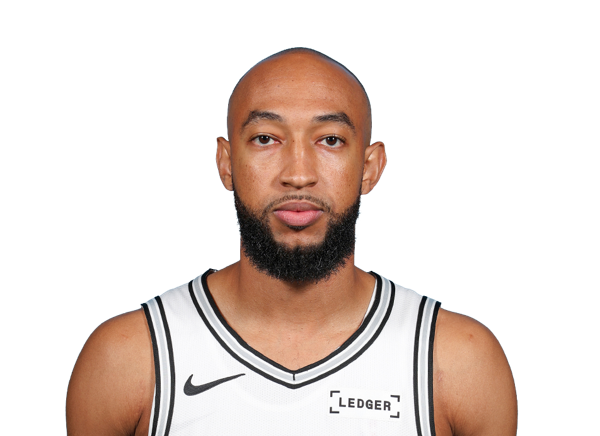
Jordan McLaughlin
Center
#7

Luke Kornet
#10
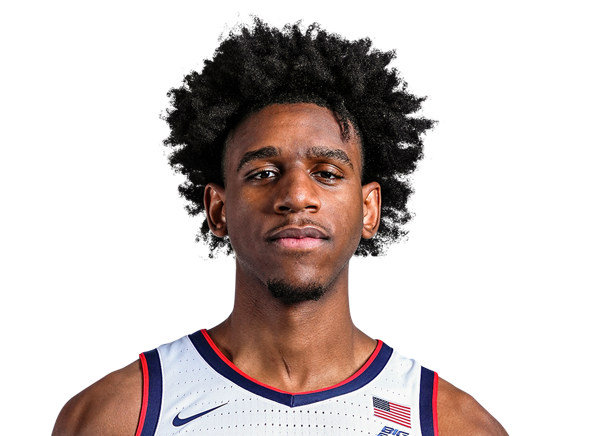
Tarris Reed Jr.
Team Statistics
Grizzlies
4th in Western Conference Division
VS
Spurs
4th in Western Conference Division
General
49.5
Rebounds Per Game
48.5
1.8
Assist To Turnover Ratio
2.1
24.9
Fouls Per Game
20.5
8
Games Played
8
0
Games Started
0
0
Minutes
0
0.0
Minutes Per Game
0.0
396
Rebounds
388
396
Rebounds
388
Offensive
82.2
Free Throw Percentage
80.1
40.0
3-Point Field Goal Percentage
32.2
43.1
Average Field Goals Made
42.4
91.1
Average Field Goals Attempted
93.1
15.8
Average 3-Point Field Goals Made
11.5
39.4
Average 3-Point Field Goals Attempted
35.8
18.5
Average Free Throws Made
20.6
22.5
Average Free Throws Attempted
25.8
120.5
Points Per Game
116.9
12.9
Offensive Rebounds Per Game
13.1
27.5
Assists Per Game
26.5
15.5
Turnovers Per Game
12.6
52.9
2-Point Field Goal Percentage
53.8
1.322
Scoring Efficiency
1.255
0.56
Shooting Efficiency
0.52
47.3
Field Goal Percentage
45.5
219.0
2-Point Field Goals Made
247.0
414.0
2-Point Field Goals Attempted
459.0
964
Points
935
103
Offensive Rebounds
105
220
Assists
212
124
Turnovers
101
345
Field Goals Made
339
729
Field Goals Attempted
745
148
Free Throws Made
165
180
Free Throws Attempted
206
126
3-Point Field Goals Made
92
315
3-Point Field Goals Attempted
286
40.0
3-Point Field Goal Percentage
32.2
27.4
2-Point Field Goals Made per Game
30.9
51.8
2-Point Field Goals Attempted per Game
57.4
Defensive
36.6
Defensive Rebounds Per Game
35.4
5.8
Blocks Per Game
7.4
6.3
Steals Per Game
8.4
293
Defensive Rebounds
283
50
Steals
67
46
Blocks
59