

Mavericks vs Bulls Live Score (26 Jan, 2027)
Game Information
League
NBA
Season
1
Date
January 25, 2027
Tipoff
8:00 PM EST
Status
Scheduled
Team Stats
 DAL
Game Comparison
CHI

-Points-
-Rebounds-
-Assists-
49Field Goal %41
-3-Point %-
-Free Throw %-
Game Leaders
DALCHI
 —#
Points
—
—#
—#Rebounds
—
—#
—#Assists
—
—#
Injury Report
Dallas Mavericks
H2H / Season Series
Last 5 Games








NBA Standings
Western Conference — Southwest
| Team | W | L | PCT | GB | STRK |
|---|---|---|---|---|---|
 Houston | 4 | 0 | 1.000 | - | W4 |
 Memphis | 4 | 0 | 1.000 | - | W4 |
| Dallas | 2 | 2 | .500 | 2 | W1 |
 San Antonio | 1 | 2 | .333 | 2.5 | W1 |
 New Orleans | 0 | 3 | .000 | 3.5 | L3 |


Rosters
Mavericks
10th in Western Conference Division
VS
Bulls
4th in Central Division
Forward
#32

Cooper Flagg
#25
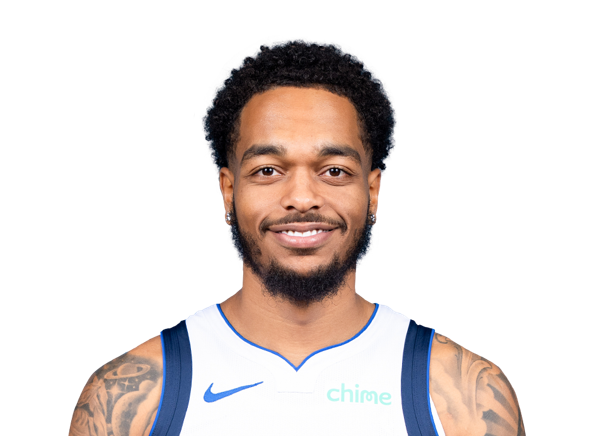
P.J. Washington
#3
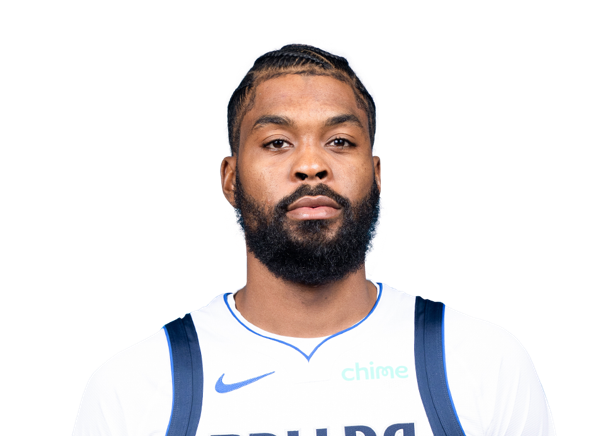
Naji Marshall
#21
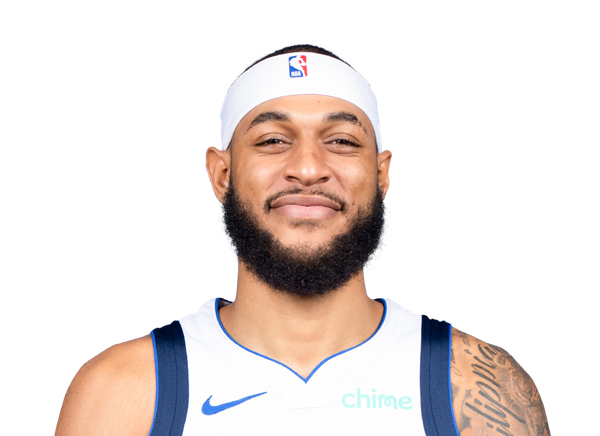
Daniel Gafford
#14
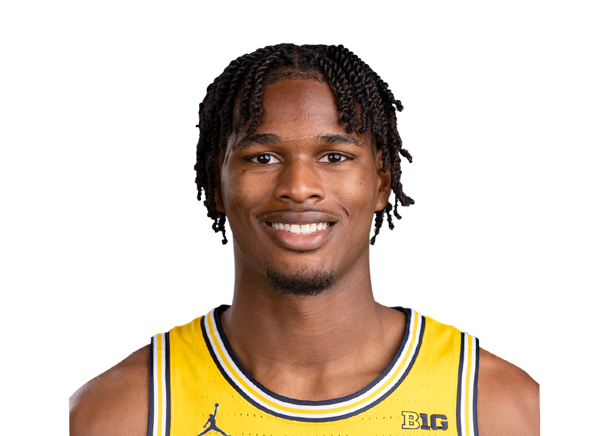
Morez Johnson Jr.
#10

Zaccharie Risacher
#16

Caleb Martin
#55

Sergio de Larrea
#33

Tobi Lawal
#34

Santi Aldama
#13
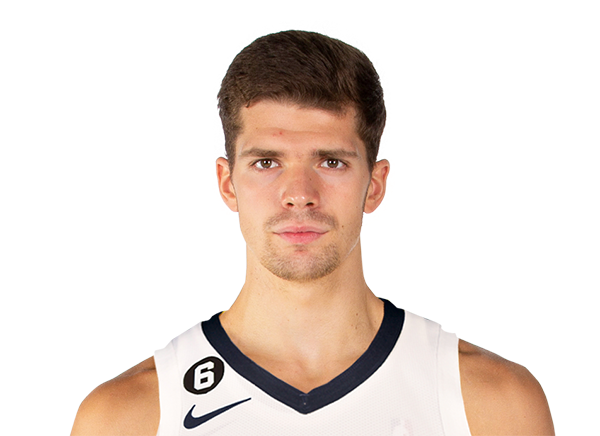
Tarik Biberovic
Guard
#11
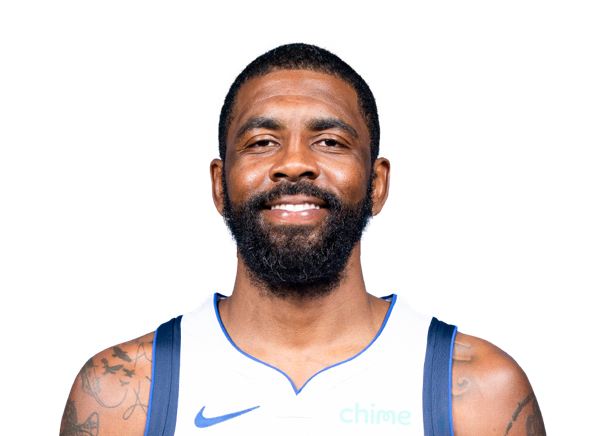
Kyrie Irving

Max Christie
#1
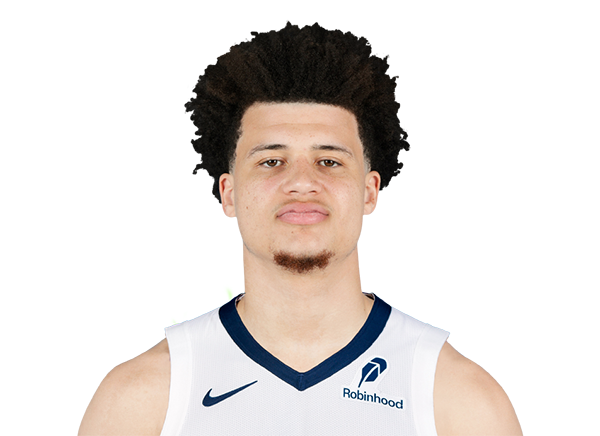
Walter Clayton Jr.
#8

Marcus Sasser
#9

Jett Howard
Center
#30

Moussa Cisse
#2
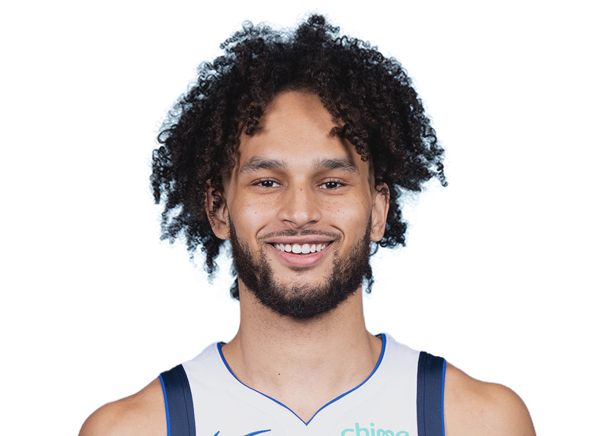
Dereck Lively II
Forward
#8

Caleb Wilson
#14

Matas Buzelis
#25
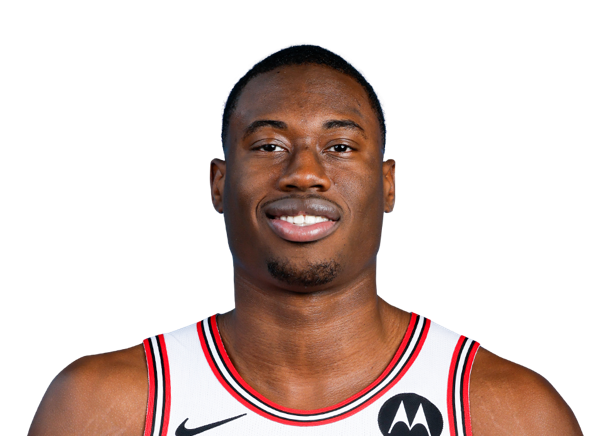
Jalen Smith
#11

Leonard Miller
#35

Isaac Okoro
#2
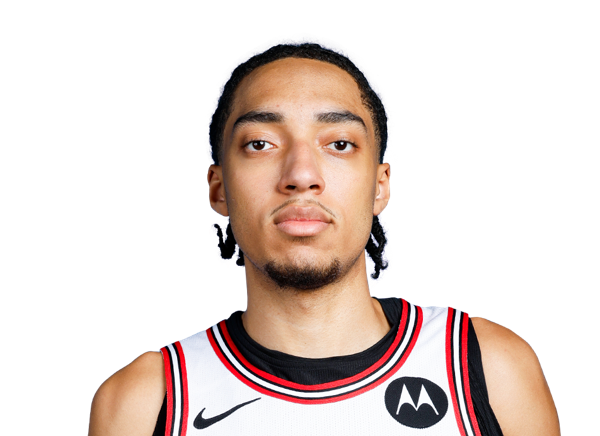
Noa Essengue
#12

Zach Collins
#19
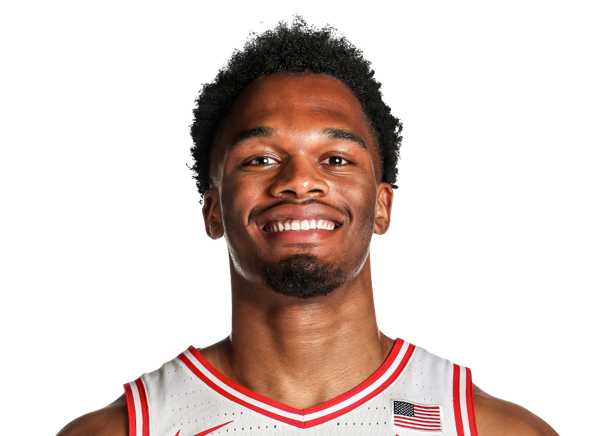
Tobe Awaka
Guard
#24

Norman Powell
#30

Tre Jones
#3

Josh Giddey
#7
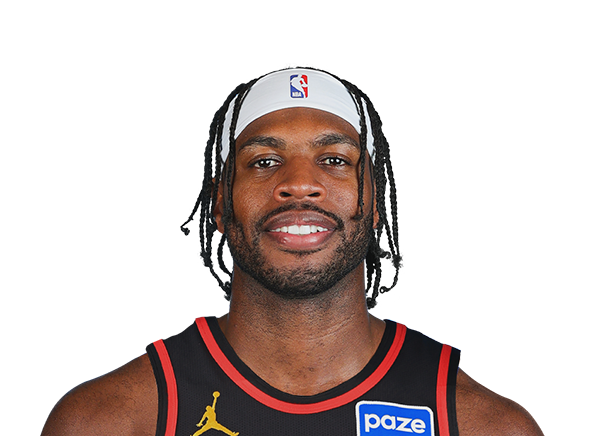
Buddy Hield
#22
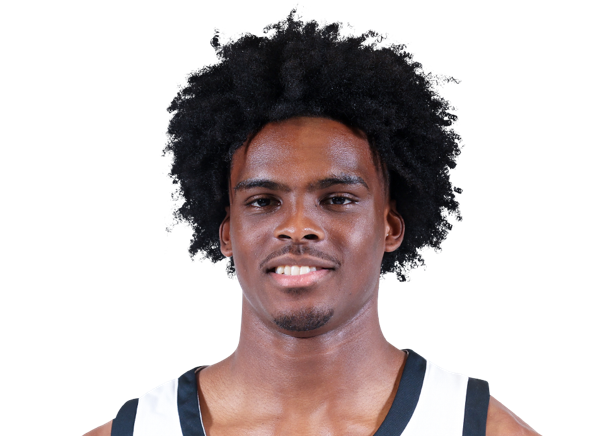
Jaylin Sellers
#5
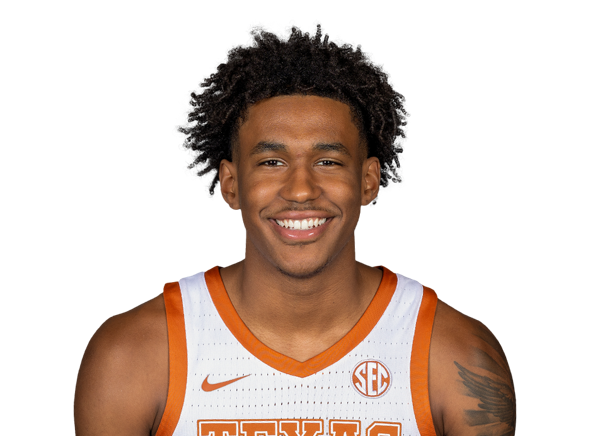
Dailyn Swain
#15

Jordan Hawkins
Center
#9

Nic Claxton
Team Statistics
Mavericks
10th in Western Conference Division
VS
Bulls
4th in Central Division
General
42.4
Rebounds Per Game
45.3
1.6
Assist To Turnover Ratio
1.5
21.9
Fouls Per Game
25.4
7
Games Played
7
0
Games Started
0
0
Minutes
0
0.0
Minutes Per Game
0.0
297
Rebounds
317
297
Rebounds
317
Offensive
77.7
Free Throw Percentage
74.6
33.1
3-Point Field Goal Percentage
27.9
41.7
Average Field Goals Made
37.6
86.3
Average Field Goals Attempted
90.3
12.1
Average 3-Point Field Goals Made
11.9
36.7
Average 3-Point Field Goals Attempted
42.6
16.4
Average Free Throws Made
25.6
21.1
Average Free Throws Attempted
34.3
112.0
Points Per Game
112.6
11.0
Offensive Rebounds Per Game
14.0
25.9
Assists Per Game
24.6
15.9
Turnovers Per Game
16.9
59.7
2-Point Field Goal Percentage
53.9
1.298
Scoring Efficiency
1.247
0.55
Shooting Efficiency
0.48
48.3
Field Goal Percentage
41.6
207.0
2-Point Field Goals Made
180.0
347.0
2-Point Field Goals Attempted
334.0
784
Points
788
77
Offensive Rebounds
98
181
Assists
172
111
Turnovers
118
292
Field Goals Made
263
604
Field Goals Attempted
632
115
Free Throws Made
179
148
Free Throws Attempted
240
85
3-Point Field Goals Made
83
257
3-Point Field Goals Attempted
298
33.1
3-Point Field Goal Percentage
27.9
29.6
2-Point Field Goals Made per Game
25.7
49.6
2-Point Field Goals Attempted per Game
47.7
Defensive
31.4
Defensive Rebounds Per Game
31.3
6.0
Blocks Per Game
5.3
9.1
Steals Per Game
8.7
220
Defensive Rebounds
219
64
Steals
61
42
Blocks
37