

Mavericks vs Knicks Live Score (17 Jan, 2027)
Game Information
League
NBA
Season
1
Date
January 16, 2027
Tipoff
7:30 PM EST
Status
Scheduled
Team Stats
 DAL
Game Comparison
NY

-Points-
-Rebounds-
-Assists-
-Field Goal %-
-3-Point %-
-Free Throw %-
Injury Report
New York Knicks
H2H / Season Series
Last 5 Games




NBA Standings
Western Conference — Southwest
| Team | W | L | PCT | GB | STRK |
|---|---|---|---|---|---|
 Memphis | 3 | 1 | .750 | - | W2 |
 New Orleans | 3 | 1 | .750 | - | W2 |
 Houston | 2 | 1 | .667 | 0.5 | W1 |
 San Antonio | 2 | 3 | .400 | 1.5 | W2 |
| Dallas | 1 | 3 | .250 | 2 | L2 |
Eastern Conference — Atlantic
| Team | W | L | PCT | GB | STRK |
|---|---|---|---|---|---|
 Boston | 4 | 0 | 1.000 | - | W4 |
 Brooklyn | 3 | 1 | .750 | 1 | L1 |
 Toronto | 2 | 3 | .400 | 2.5 | L2 |
 Philadelphia | 1 | 3 | .250 | 3 | L3 |
| New York | 1 | 4 | .200 | 3.5 | W1 |
Rosters
Mavericks
10th in Western Conference Division
VS
Knicks
3rd in Atlantic Division
Forward
#32

Cooper Flagg
#25
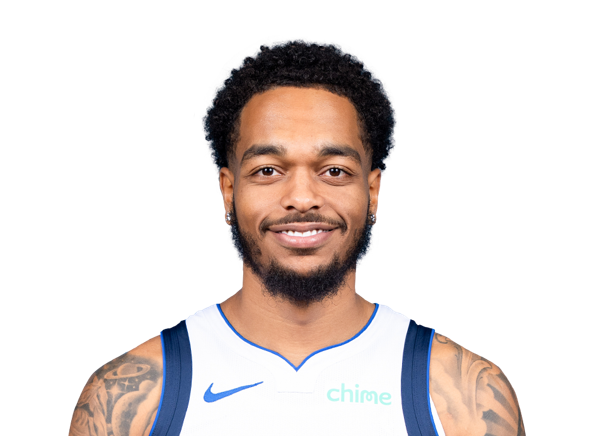
P.J. Washington
#3
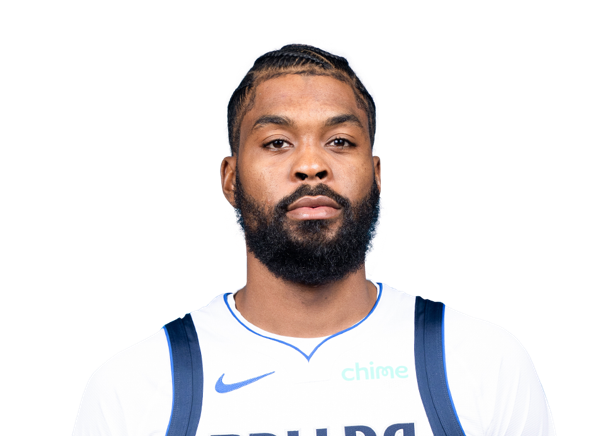
Naji Marshall
#21
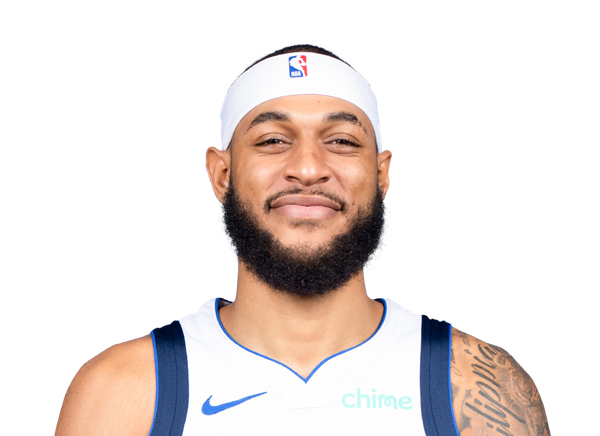
Daniel Gafford
#14
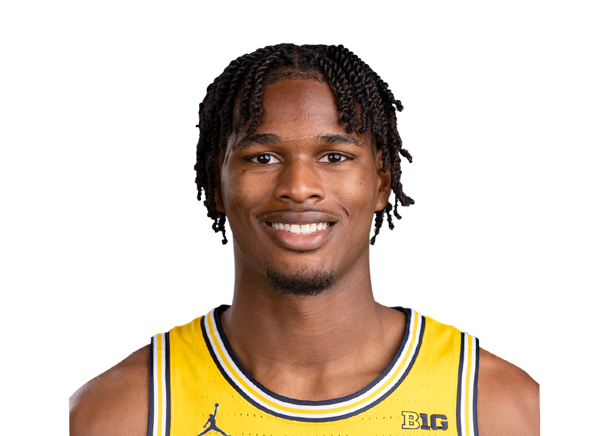
Morez Johnson Jr.
#10

Zaccharie Risacher
#16

Caleb Martin
#55

Sergio de Larrea
#33

Tobi Lawal
#34

Santi Aldama
#13
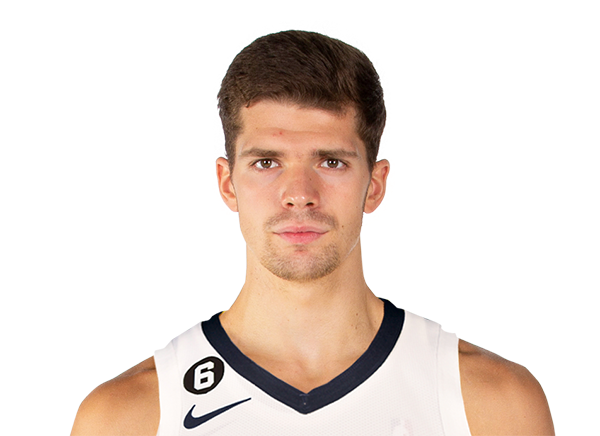
Tarik Biberovic
Guard
#11
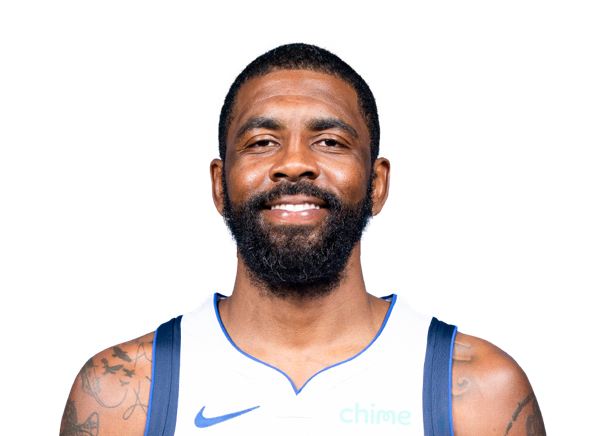
Kyrie Irving

Max Christie
#1
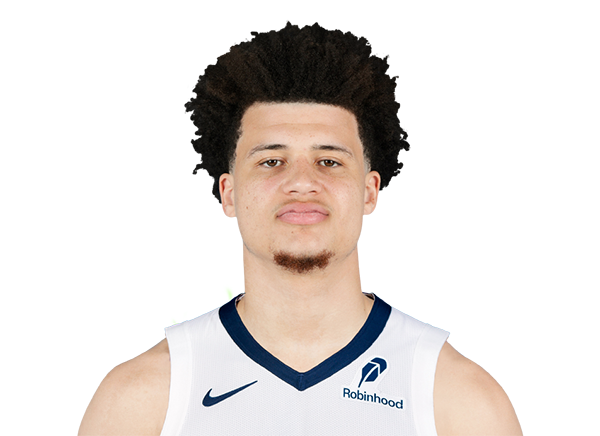
Walter Clayton Jr.
#8

Marcus Sasser
#9

Jett Howard
Center
#30
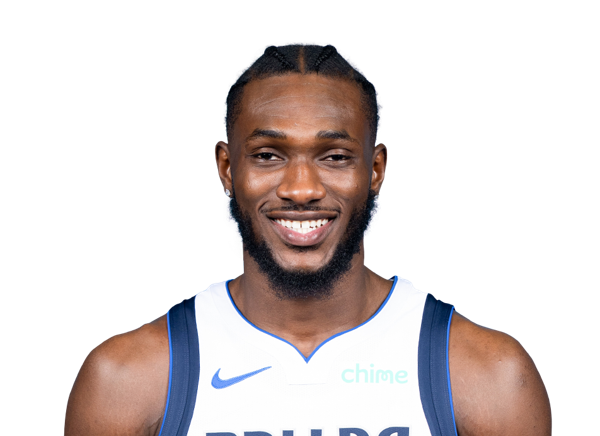
Moussa Cisse
#2
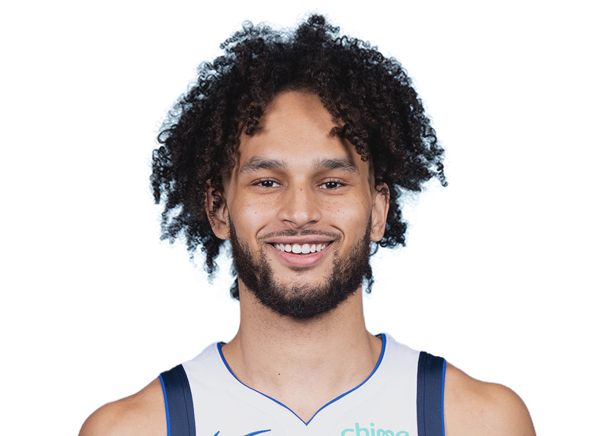
Dereck Lively II
Guard
#5

Jose Alvarado
#25

Mikal Bridges
#11

Jalen Brunson
#00

Jordan Clarkson
#3
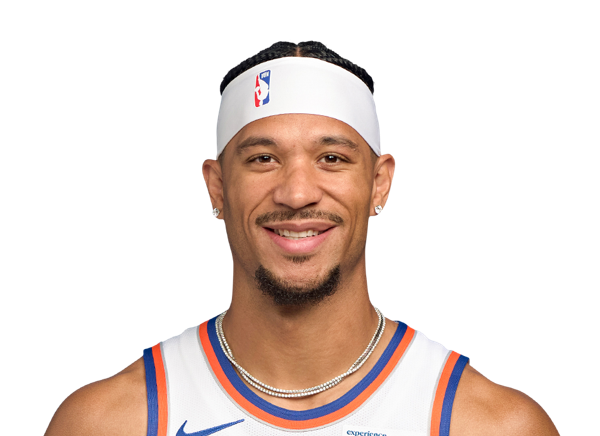
Josh Hart

Jack Kayil
#13
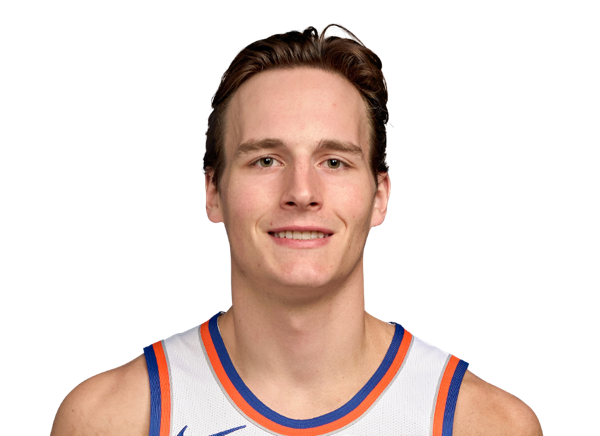
Tyler Kolek
#2

Miles McBride
#9
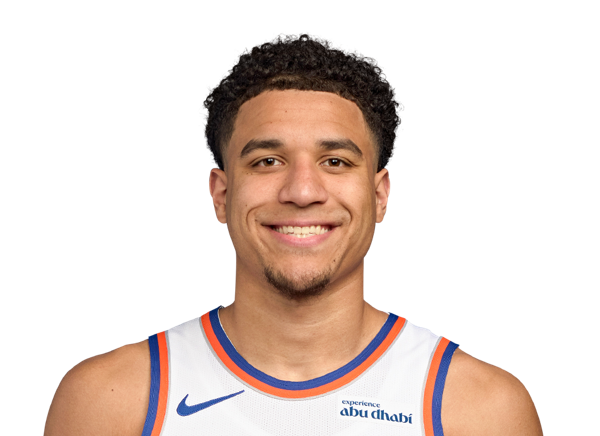
Kevin McCullar Jr.
#44

Landry Shamet
Forward
#8
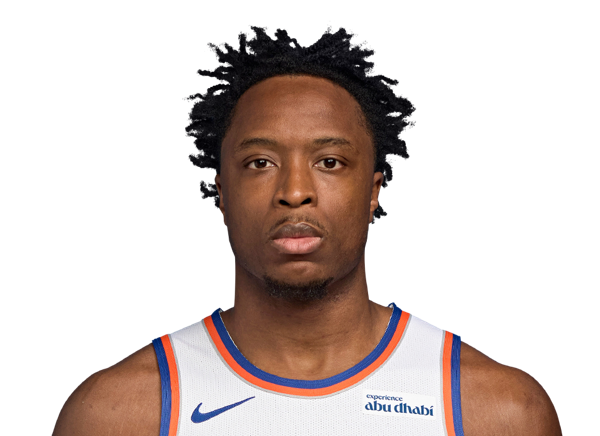
OG Anunoby
#4
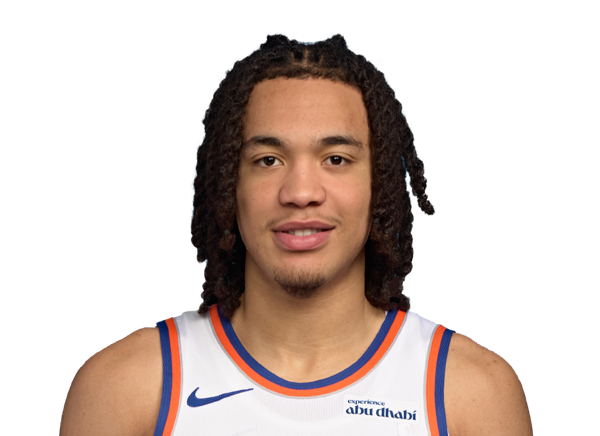
Pacome Dadiet
#51
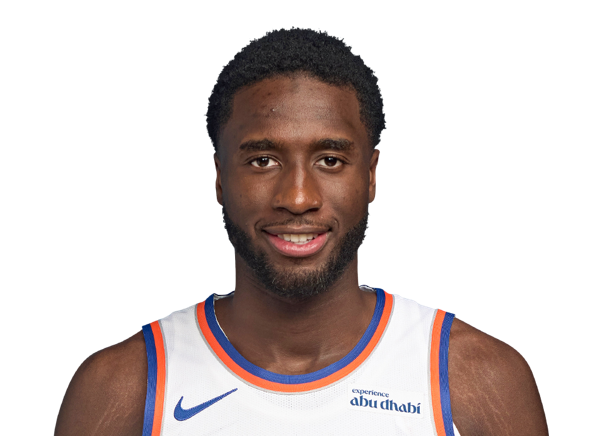
Mohamed Diawara
#50

Trey Jemison III

Tyler Nickel
Center

Andre Drummond
#32
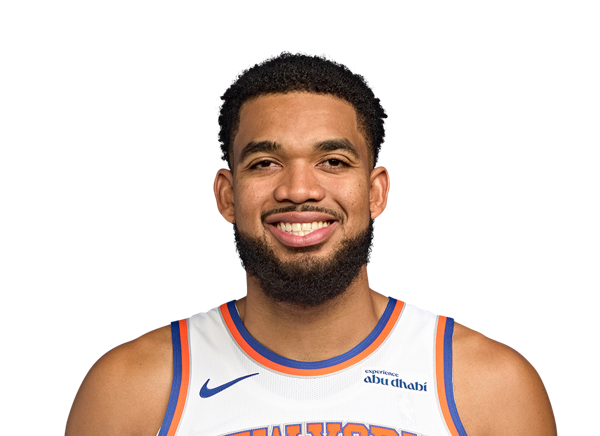
Karl-Anthony Towns
Team Statistics
Mavericks
10th in Western Conference Division
VS
Knicks
3rd in Atlantic Division
General
43.3
Rebounds Per Game
48.3
1.8
Assist To Turnover Ratio
1.8
22.5
Fouls Per Game
21.9
8
Games Played
8
0
Games Started
0
0
Minutes
0
0.0
Minutes Per Game
0.0
346
Rebounds
386
346
Rebounds
386
Offensive
77.0
Free Throw Percentage
77.5
33.7
3-Point Field Goal Percentage
36.6
41.4
Average Field Goals Made
38.0
88.3
Average Field Goals Attempted
88.5
12.4
Average 3-Point Field Goals Made
14.6
36.8
Average 3-Point Field Goals Attempted
40.0
16.8
Average Free Throws Made
19.4
21.8
Average Free Throws Attempted
25.0
111.9
Points Per Game
110.0
11.9
Offensive Rebounds Per Game
14.4
26.3
Assists Per Game
26.0
14.9
Turnovers Per Game
14.4
56.3
2-Point Field Goal Percentage
48.2
1.268
Scoring Efficiency
1.243
0.54
Shooting Efficiency
0.51
46.9
Field Goal Percentage
42.9
232.0
2-Point Field Goals Made
187.0
412.0
2-Point Field Goals Attempted
388.0
895
Points
880
95
Offensive Rebounds
115
210
Assists
208
119
Turnovers
115
331
Field Goals Made
304
706
Field Goals Attempted
708
134
Free Throws Made
155
174
Free Throws Attempted
200
99
3-Point Field Goals Made
117
294
3-Point Field Goals Attempted
320
33.7
3-Point Field Goal Percentage
36.6
29.0
2-Point Field Goals Made per Game
23.4
51.5
2-Point Field Goals Attempted per Game
48.5
Defensive
31.4
Defensive Rebounds Per Game
33.9
5.8
Blocks Per Game
4.4
8.6
Steals Per Game
7.4
251
Defensive Rebounds
271
69
Steals
59
46
Blocks
35