

Mavericks vs Nets Live Score (17 Dec, 2026)
Game Information
League
NBA
Season
1
Date
December 16, 2026
Tipoff
7:30 PM EST
Status
Scheduled
Team Stats
 DAL
Game Comparison
BKN
-Points-
-Rebounds-
-Assists-
46Field Goal %45
-3-Point %-
-Free Throw %-
Game Leaders
DALBKN
 —#
Points
—
—#
—#
Rebounds
—
—#
—#
Assists
—
—#
Injury Report
Brooklyn Nets
H2H / Season Series
Last 5 Games





NBA Standings
Western Conference — Southwest
| Team | W | L | PCT | GB | STRK |
|---|---|---|---|---|---|
 San Antonio | 13 | 3 | .813 | - | W1 |
 Houston | 12 | 4 | .750 | 1 | W1 |
 Memphis | 12 | 4 | .750 | 1 | W5 |
| Dallas | 8 | 7 | .533 | 4.5 | W1 |
 New Orleans | 5 | 11 | .313 | 8 | L1 |
Eastern Conference — Atlantic
| Team | W | L | PCT | GB | STRK |
|---|---|---|---|---|---|
 Philadelphia | 13 | 3 | .813 | - | W4 |
 Boston | 11 | 4 | .733 | 1.5 | L2 |
 New York | 9 | 6 | .600 | 3.5 | W3 |
 Toronto | 5 | 10 | .333 | 7.5 | L6 |
| Brooklyn | 3 | 11 | .214 | 9 | L3 |
Rosters
Mavericks
9th in Western Conference Division
VS
Nets
5th in Atlantic Division
Forward
#32
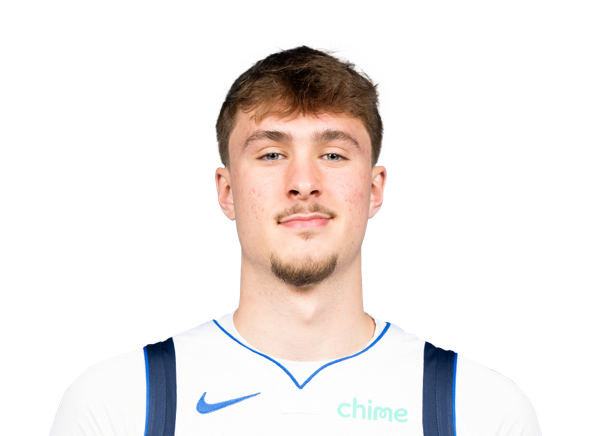
Cooper Flagg
#25
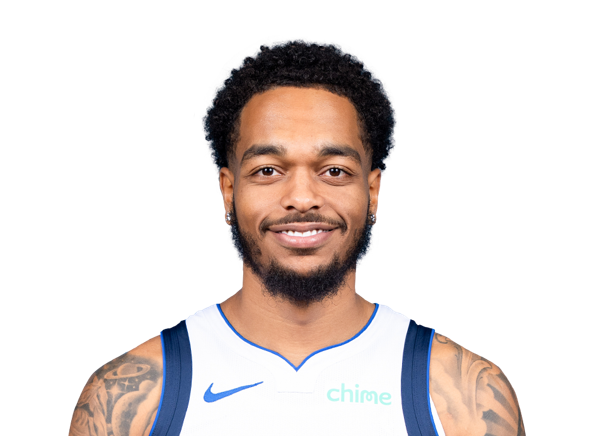
P.J. Washington
#3
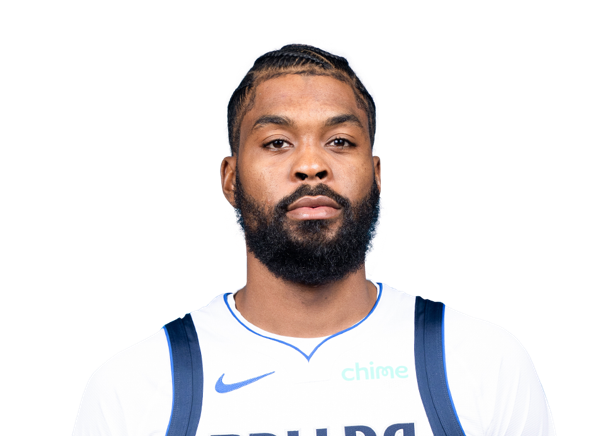
Naji Marshall
#21
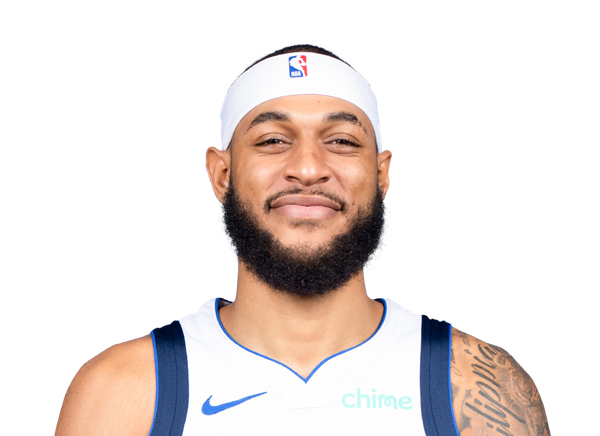
Daniel Gafford
#10

Zaccharie Risacher
#14
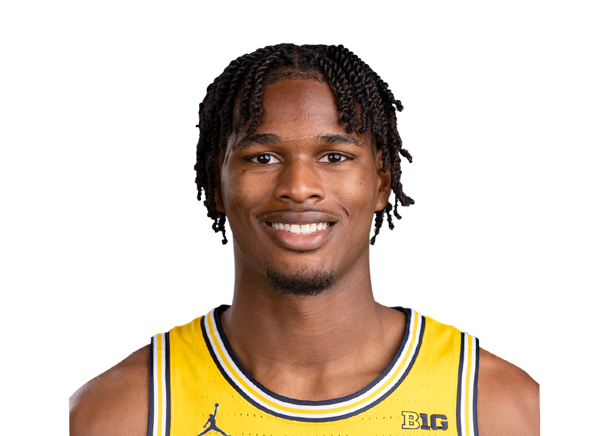
Morez Johnson Jr.
#16

Caleb Martin
#34

Santi Aldama
#55

Sergio de Larrea
#33

Tobi Lawal
#13
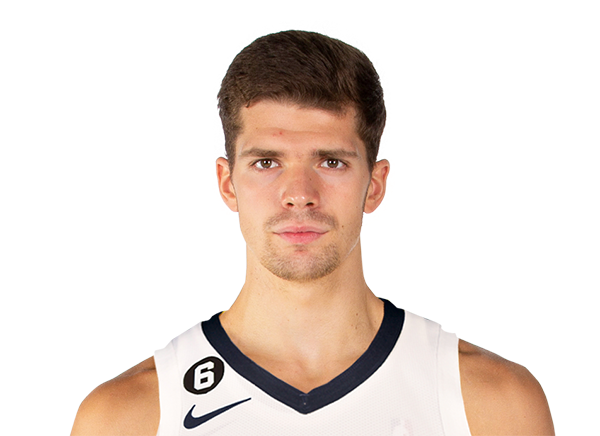
Tarik Biberovic
Guard
#11
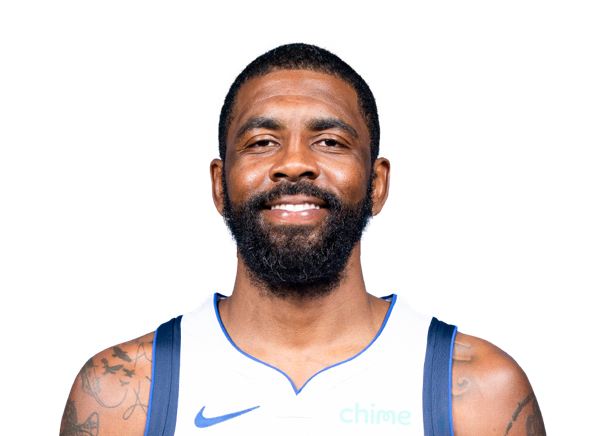
Kyrie Irving
#1
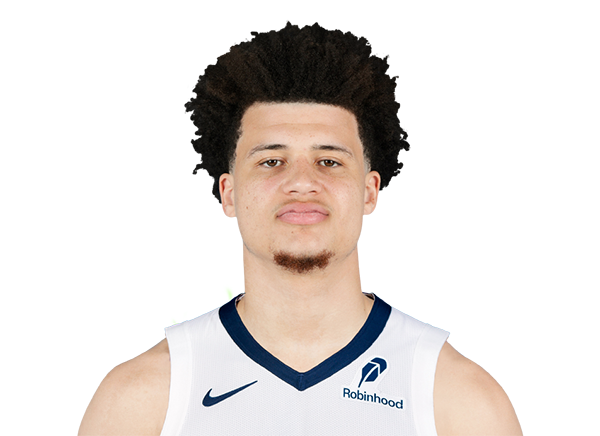
Walter Clayton Jr.

Max Christie
#8

Marcus Sasser
#9

Jett Howard
Center
#30
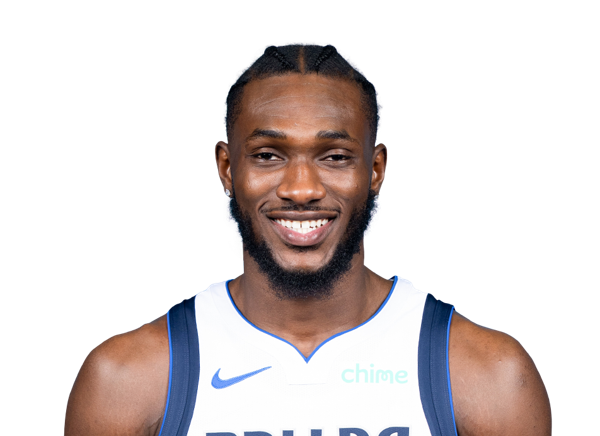
Moussa Cisse
#2
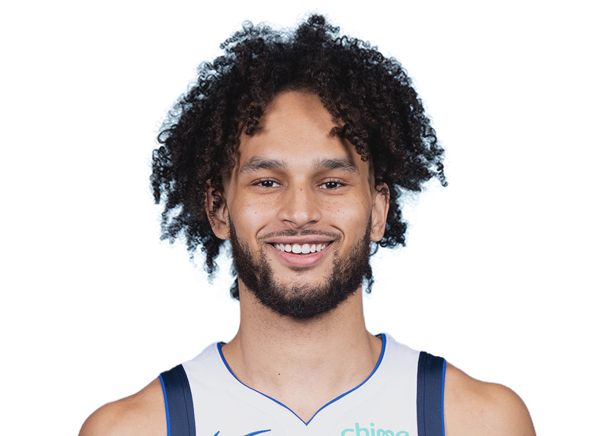
Dereck Lively II
Forward
#30
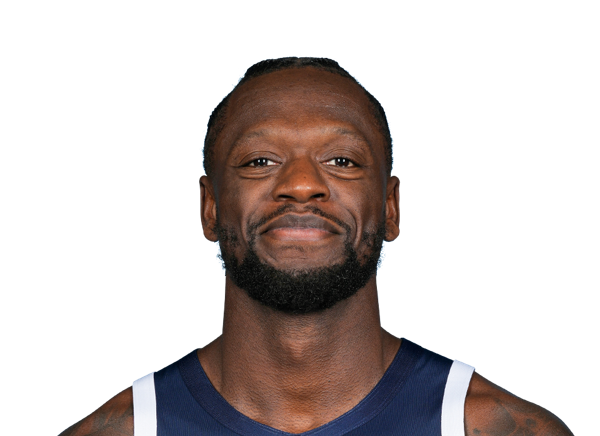
Julius Randle
#17
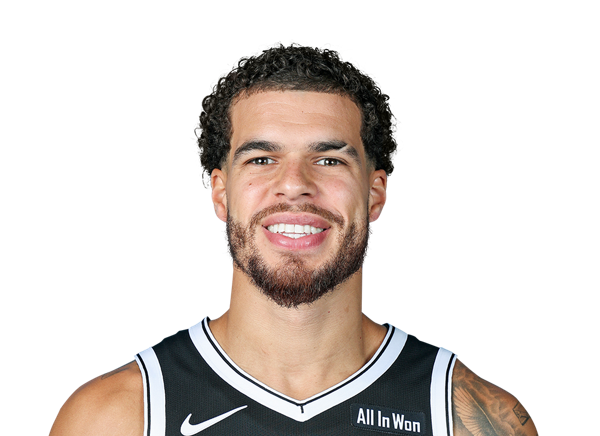
Michael Porter Jr.
#2
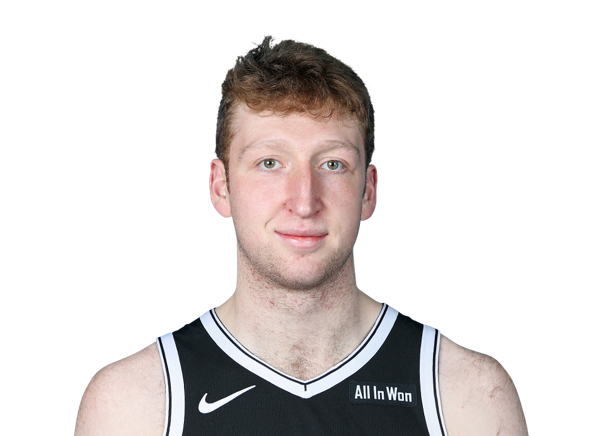
Danny Wolf
#21
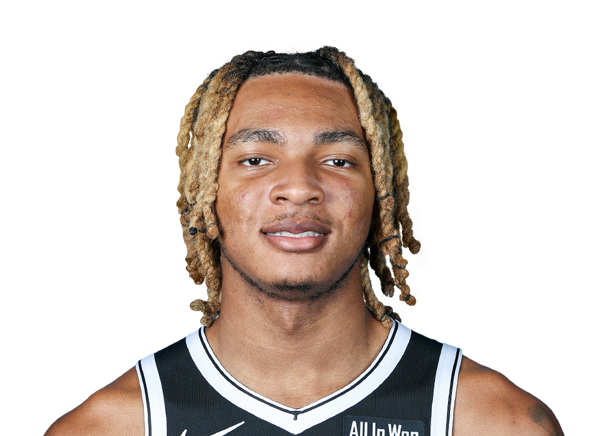
Noah Clowney
#31

Chaney Johnson
#00

Josh Minott
#9

Joshua Jefferson
#16

Grant Nelson
Guard
#10
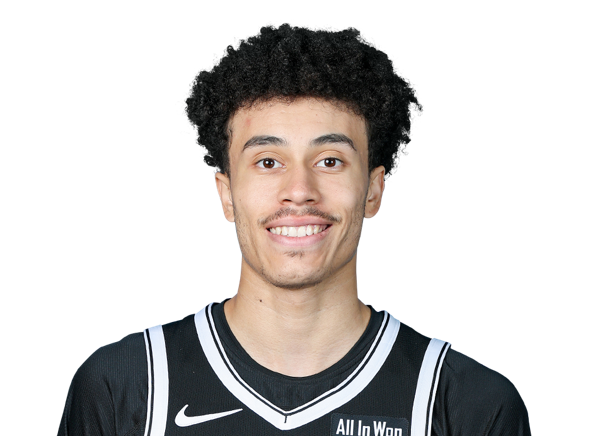
Nolan Traore
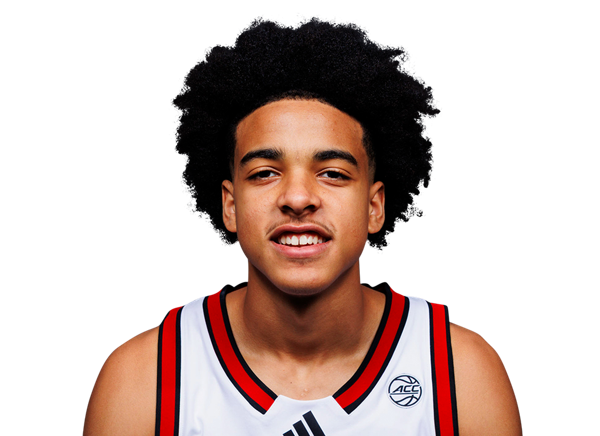
Mikel Brown Jr.
#8
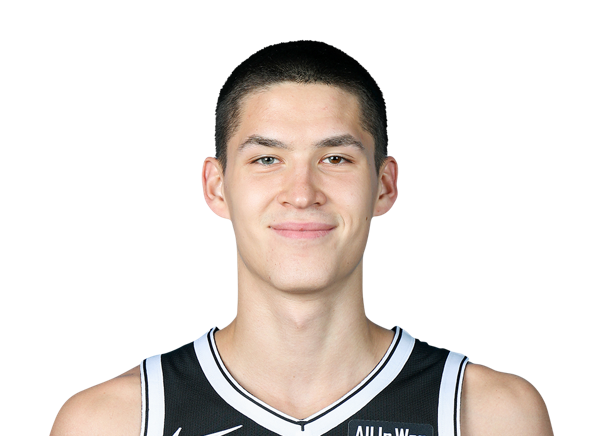
Egor Demin
#1

Keon Ellis
#4

Drake Powell
#77

Ben Saraf
#14

Terance Mann
Center
#13
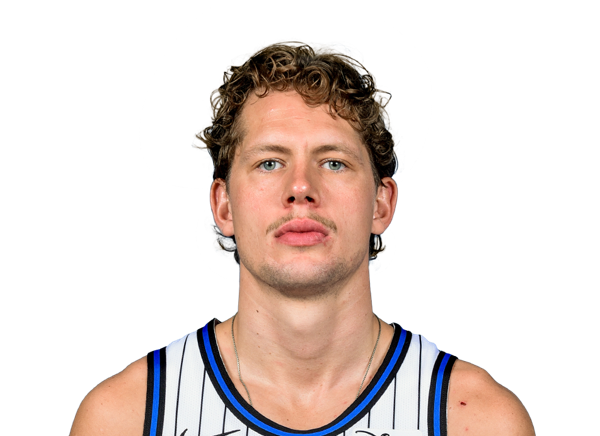
Moritz Wagner
#20
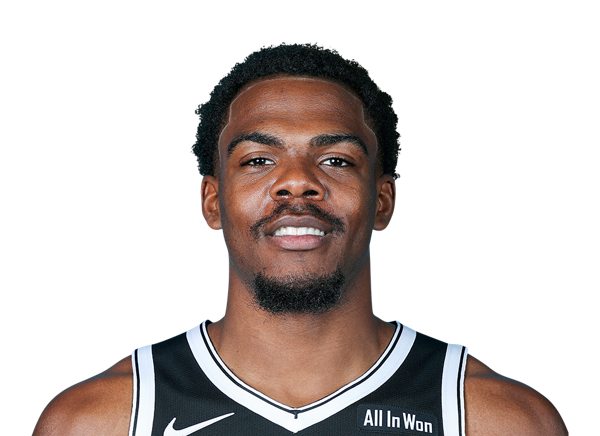
Day'Ron Sharpe
Team Statistics
Mavericks
9th in Western Conference Division
VS
Nets
5th in Atlantic Division
General
43.8
Rebounds Per Game
41.3
1.8
Assist To Turnover Ratio
1.5
21.6
Fouls Per Game
25.5
16
Games Played
15
0
Games Started
0
0
Minutes
0
0.0
Minutes Per Game
0.0
701
Rebounds
619
701
Rebounds
619
Offensive
77.7
Free Throw Percentage
75.4
34.4
3-Point Field Goal Percentage
36.0
40.5
Average Field Goals Made
37.7
88.1
Average Field Goals Attempted
84.1
12.9
Average 3-Point Field Goals Made
14.3
37.6
Average 3-Point Field Goals Attempted
39.9
18.3
Average Free Throws Made
21.1
23.5
Average Free Throws Attempted
27.9
112.2
Points Per Game
110.9
12.8
Offensive Rebounds Per Game
11.5
26.4
Assists Per Game
24.3
15.0
Turnovers Per Game
16.5
54.6
2-Point Field Goal Percentage
52.9
1.273
Scoring Efficiency
1.318
0.53
Shooting Efficiency
0.53
46.0
Field Goal Percentage
44.8
441.0
2-Point Field Goals Made
351.0
808.0
2-Point Field Goals Attempted
664.0
1795
Points
1663
205
Offensive Rebounds
172
423
Assists
365
240
Turnovers
247
648
Field Goals Made
566
1410
Field Goals Attempted
1262
292
Free Throws Made
316
376
Free Throws Attempted
419
207
3-Point Field Goals Made
215
602
3-Point Field Goals Attempted
598
34.4
3-Point Field Goal Percentage
36.0
27.6
2-Point Field Goals Made per Game
23.4
50.5
2-Point Field Goals Attempted per Game
44.3
Defensive
31.0
Defensive Rebounds Per Game
29.8
5.5
Blocks Per Game
4.7
8.8
Steals Per Game
8.4
496
Defensive Rebounds
447
141
Steals
126
88
Blocks
71