

Mavericks vs Pistons Live Score (15 Jan, 2027)
Game Information
League
NBA
Season
1
Date
January 14, 2027
Tipoff
7:00 PM EST
Status
Scheduled
Team Stats
 DAL
Game Comparison
DET

-Points-
-Rebounds-
-Assists-
-Field Goal %-
-3-Point %-
-Free Throw %-
Injury Report
Dallas Mavericks
H2H / Season Series
Last 5 Games





NBA Standings
Western Conference — Southwest
| Team | W | L | PCT | GB | STRK |
|---|---|---|---|---|---|
 Memphis | 2 | 1 | .667 | - | W1 |
 Houston | 2 | 1 | .667 | - | W1 |
 New Orleans | 2 | 1 | .667 | - | W1 |
| Dallas | 1 | 2 | .333 | 1 | L1 |
 San Antonio | 1 | 3 | .250 | 1.5 | W1 |


Rosters
Mavericks
10th in Western Conference Division
VS
Pistons
1st in Central Division
Forward
#32

Cooper Flagg
#25
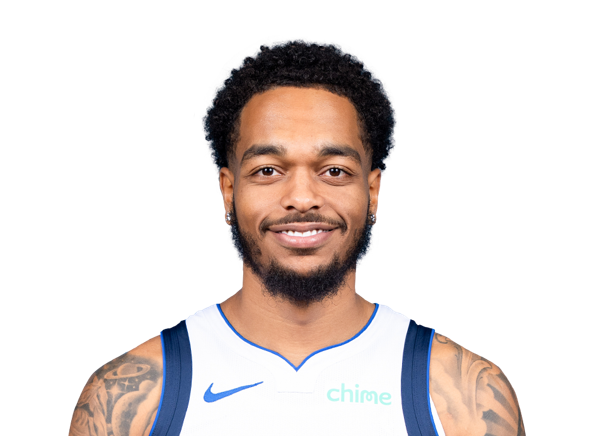
P.J. Washington
#3

Naji Marshall
#21
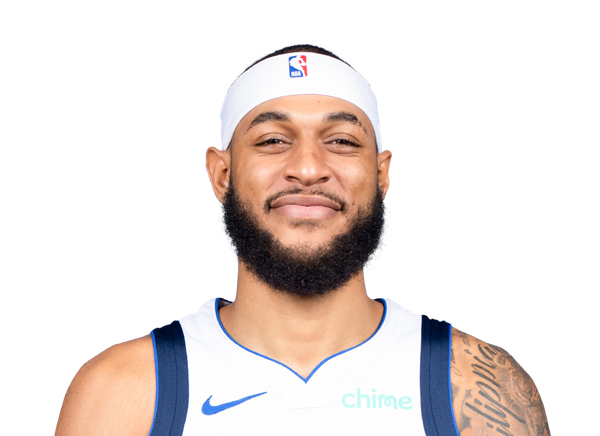
Daniel Gafford
#14
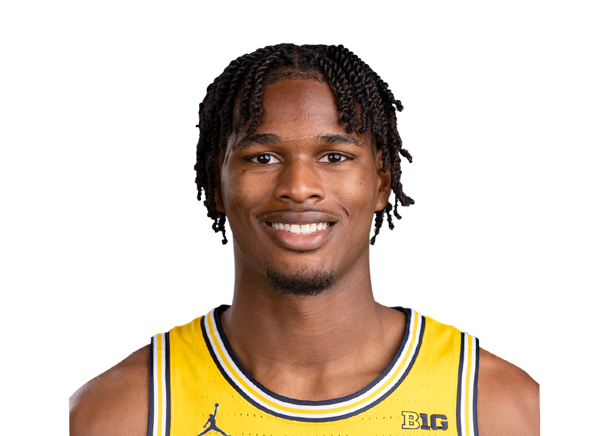
Morez Johnson Jr.
#10

Zaccharie Risacher
#16

Caleb Martin
#55

Sergio de Larrea
#33

Tobi Lawal
#34

Santi Aldama
#13
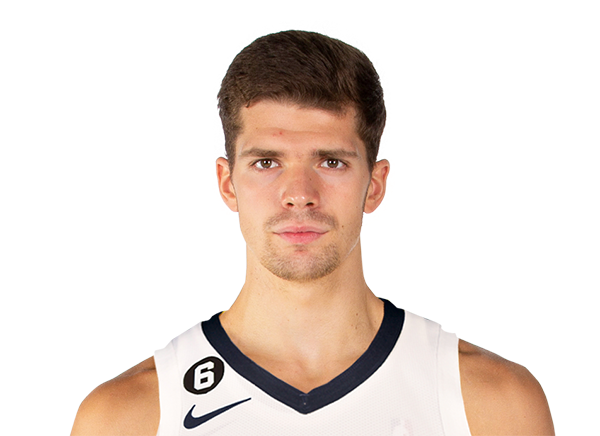
Tarik Biberovic
Guard
#11

Kyrie Irving

Max Christie
#1
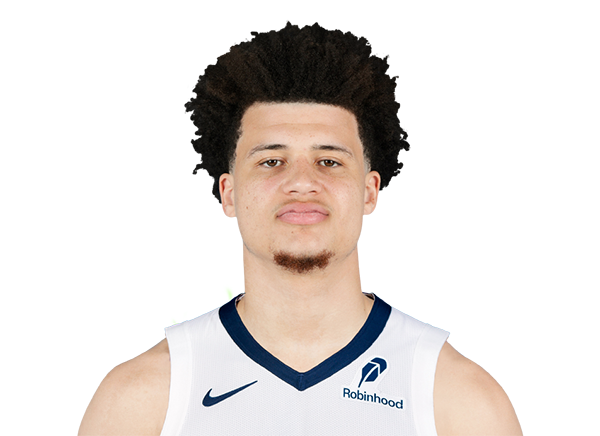
Walter Clayton Jr.
#8

Marcus Sasser
#9

Jett Howard
Center
#30

Moussa Cisse
#2

Dereck Lively II
Guard
#2

Cade Cunningham
#9
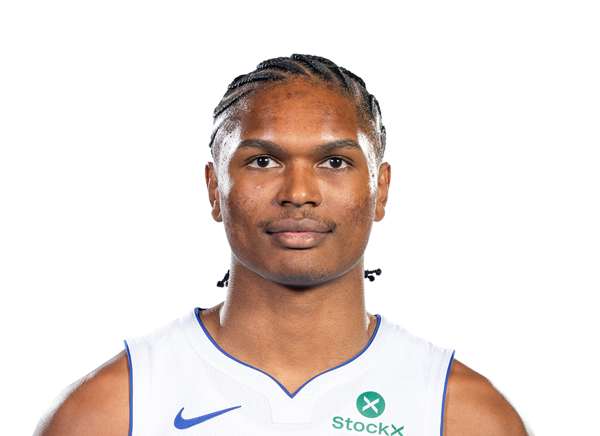
Ausar Thompson
#24

Daniss Jenkins
#27

Kevin Huerter
#31

Javonte Green
#17

Isaiah Joe
#8

Chaz Lanier
#23
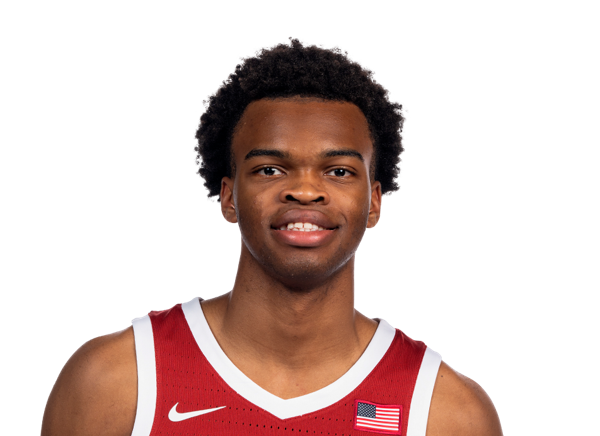
Ebuka Okorie
#94

Elijah Harkless
Forward
#55

Duncan Robinson
#7

Paul Reed
#20
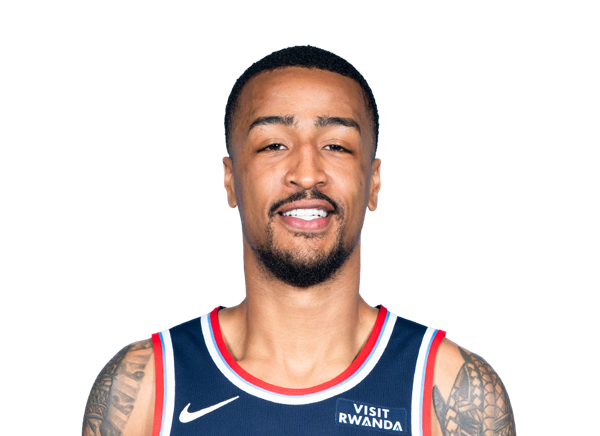
John Collins
#5
Ronald Holland II
#35

Tolu Smith
#12

Taurean Prince
Center

Jalen Duren
#13

Isaac Jones
Team Statistics
Mavericks
10th in Western Conference Division
VS
Pistons
1st in Central Division
General
43.3
Rebounds Per Game
44.0
1.8
Assist To Turnover Ratio
1.9
22.5
Fouls Per Game
22.4
8
Games Played
8
0
Games Started
0
0
Minutes
0
0.0
Minutes Per Game
0.0
346
Rebounds
352
346
Rebounds
352
Offensive
77.0
Free Throw Percentage
75.9
33.7
3-Point Field Goal Percentage
37.8
41.4
Average Field Goals Made
39.8
88.3
Average Field Goals Attempted
85.0
12.4
Average 3-Point Field Goals Made
13.9
36.8
Average 3-Point Field Goals Attempted
36.8
16.8
Average Free Throws Made
17.8
21.8
Average Free Throws Attempted
23.4
111.9
Points Per Game
111.1
11.9
Offensive Rebounds Per Game
10.3
26.3
Assists Per Game
26.9
14.9
Turnovers Per Game
14.5
56.3
2-Point Field Goal Percentage
53.6
1.268
Scoring Efficiency
1.307
0.54
Shooting Efficiency
0.55
46.9
Field Goal Percentage
46.8
232.0
2-Point Field Goals Made
207.0
412.0
2-Point Field Goals Attempted
386.0
895
Points
889
95
Offensive Rebounds
82
210
Assists
215
119
Turnovers
116
331
Field Goals Made
318
706
Field Goals Attempted
680
134
Free Throws Made
142
174
Free Throws Attempted
187
99
3-Point Field Goals Made
111
294
3-Point Field Goals Attempted
294
33.7
3-Point Field Goal Percentage
37.8
29.0
2-Point Field Goals Made per Game
25.9
51.5
2-Point Field Goals Attempted per Game
48.3
Defensive
31.4
Defensive Rebounds Per Game
33.8
5.8
Blocks Per Game
6.5
8.6
Steals Per Game
9.3
251
Defensive Rebounds
270
69
Steals
74
46
Blocks
52