

Mavericks vs Spurs Live Score (5 Nov, 2026)
Game Information
League
NBA
Season
2027
Date
November 4, 2026
Tipoff
9:30 PM EST
Status
Scheduled
DAL Record
4-3
SA Record
5-2
Venue
Frost Bank Center
Location
San Antonio, TX
Arena Type
Indoor
Broadcast
ESPN
Team Stats
 DAL
Game Comparison
SA

-Points-
-Rebounds-
-Assists-
48Field Goal %46
-3-Point %-
-Free Throw %-
Game Leaders
DALSA
 —#
Points
—
—#
—#Rebounds
—
—#
—#Assists
—
—#
Injury Report
Dallas Mavericks
H2H / Season Series
Last 5 Games





NBA Standings
Western Conference — Southwest
| Team | W | L | PCT | GB | STRK |
|---|---|---|---|---|---|
 Houston | 7 | 1 | .875 | - | W2 |
 Memphis | 6 | 1 | .857 | 0.5 | L1 |
| San Antonio | 5 | 2 | .714 | 1.5 | W5 |
| Dallas | 4 | 3 | .571 | 2.5 | L1 |
 New Orleans | 3 | 4 | .429 | 3.5 | W3 |
Rosters
Mavericks
9th in Western Conference Division
VS
Spurs
5th in Western Conference Division
Forward
#32

Cooper Flagg
#25
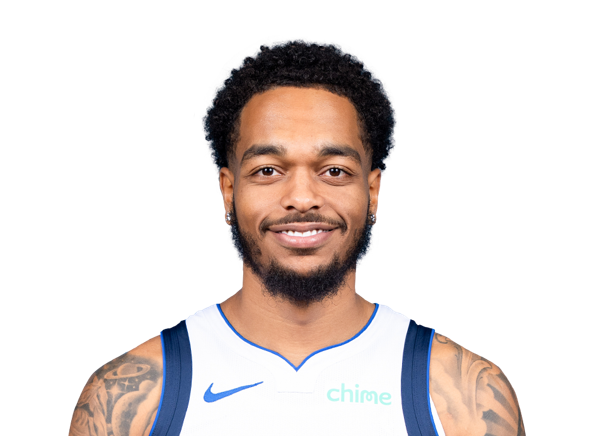
P.J. Washington
#21

Daniel Gafford
#10

Zaccharie Risacher
#14
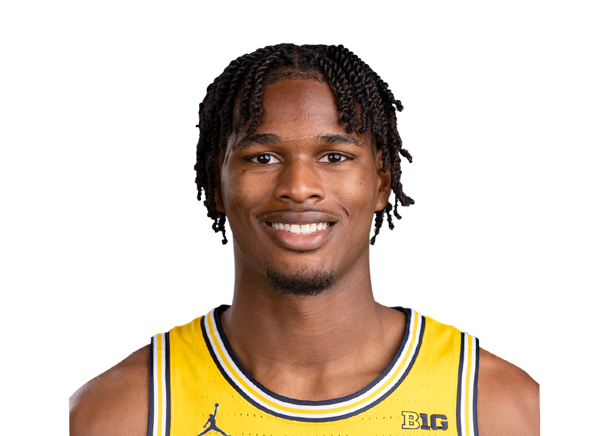
Morez Johnson Jr.
#3
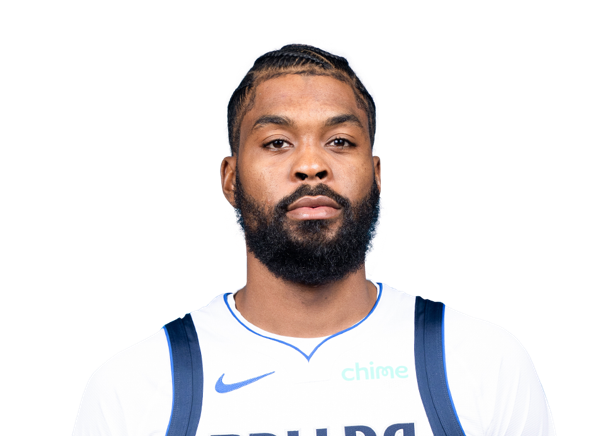
Naji Marshall
#16

Caleb Martin
#55

Sergio de Larrea
#33

Tobi Lawal
#34

Santi Aldama
#13
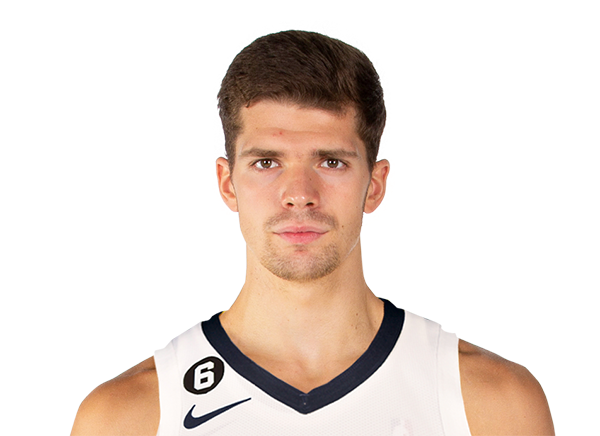
Tarik Biberovic
Guard
#11

Kyrie Irving

Max Christie
#8

Marcus Sasser
#1
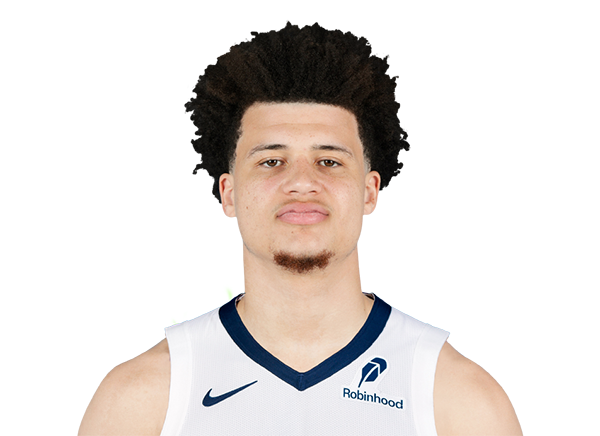
Walter Clayton Jr.
#9

Jett Howard
Center
#30

Moussa Cisse
#2

Dereck Lively II
Forward
#1
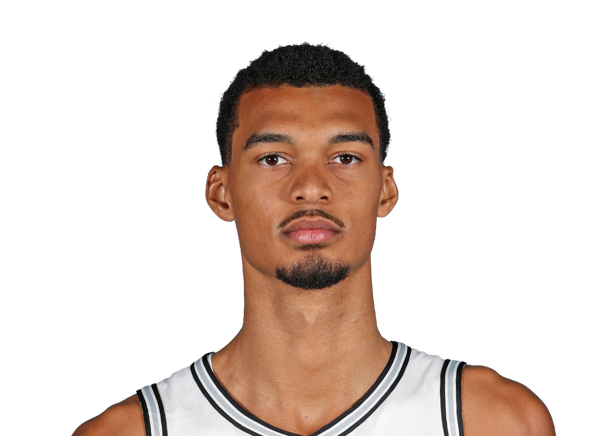
Victor Wembanyama
#30

Julian Champagnie
#3
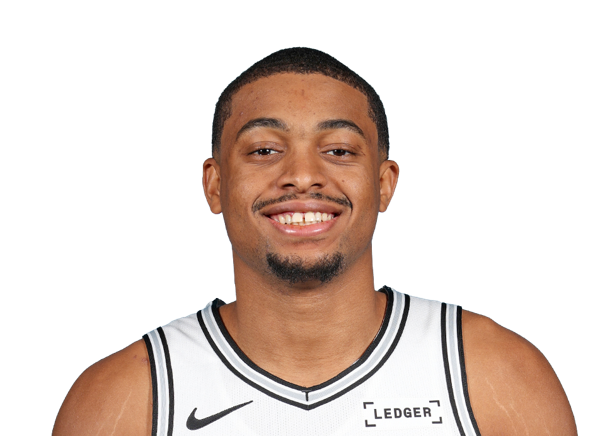
Keldon Johnson
#40
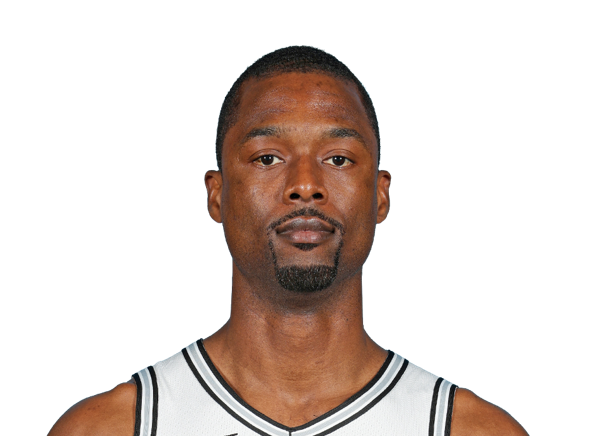
Harrison Barnes
#11
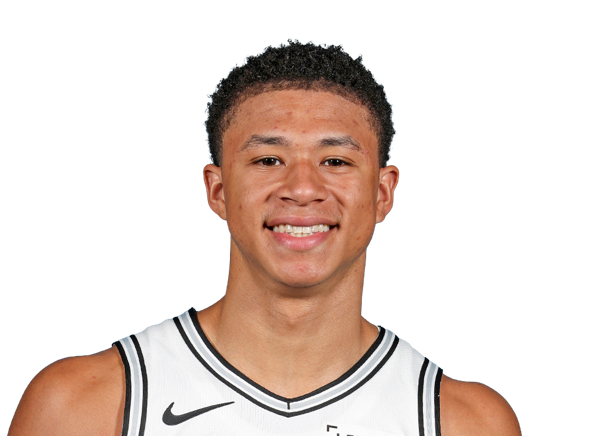
Carter Bryant
#25
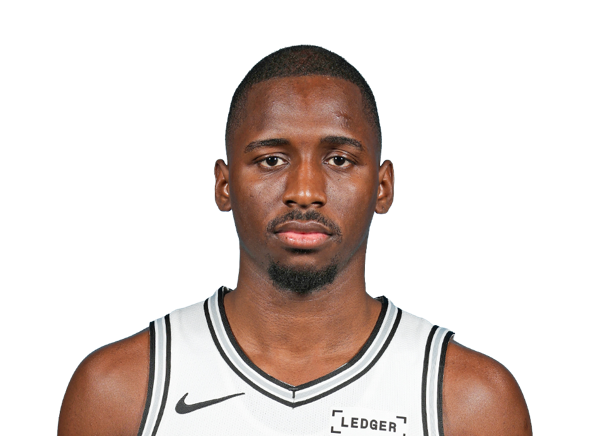
David Jones Garcia
#15
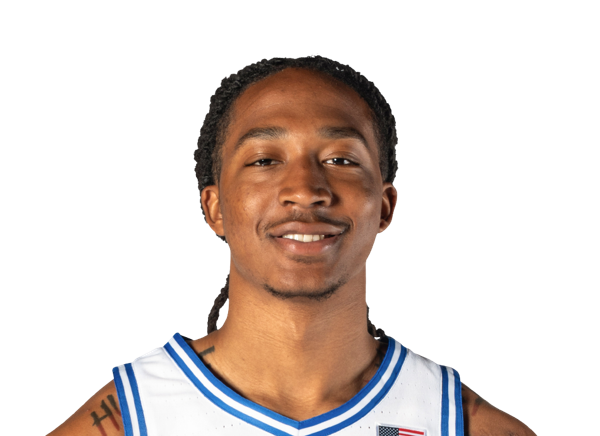
Maliq Brown
#23
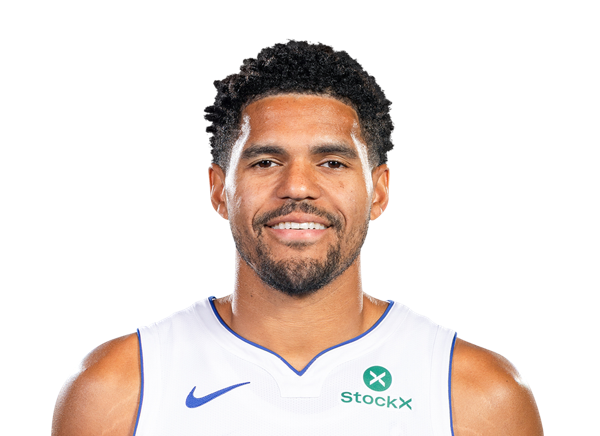
Tobias Harris
#22
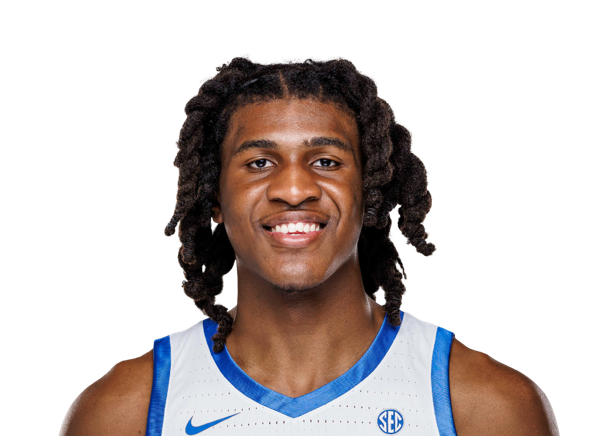
Jayden Quaintance
Guard
#2
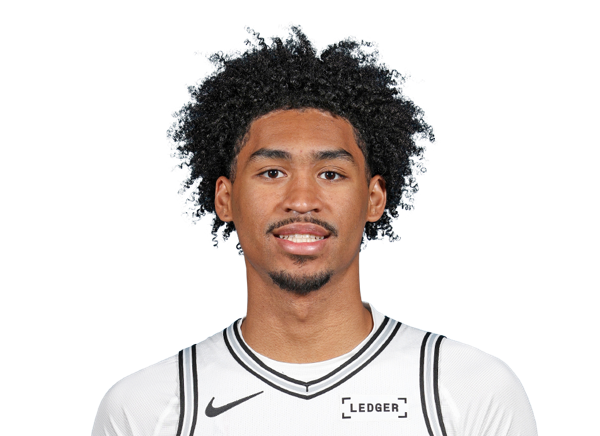
Dylan Harper
#4
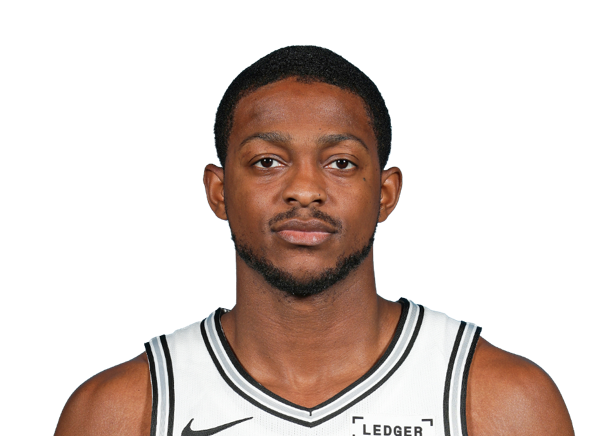
De'Aaron Fox
#5
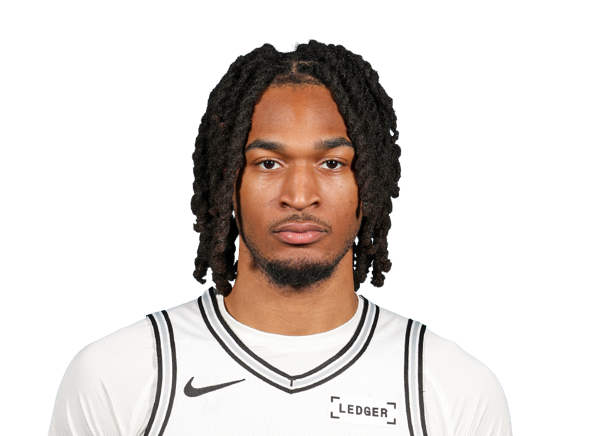
Stephon Castle
#24

Devin Vassell
#17
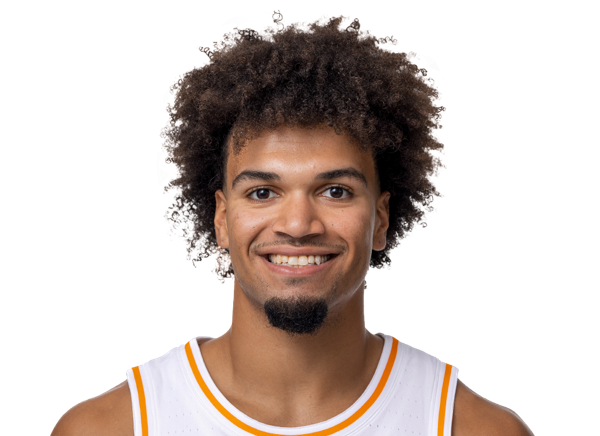
Ja'Kobi Gillespie
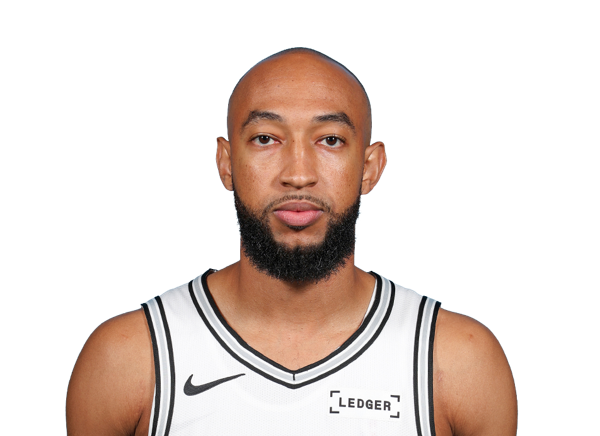
Jordan McLaughlin
Center
#7

Luke Kornet
#10
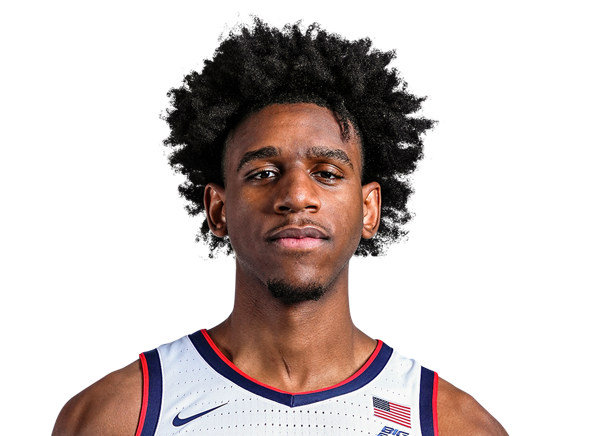
Tarris Reed Jr.
Team Statistics
Mavericks
9th in Western Conference Division
VS
Spurs
5th in Western Conference Division
General
42.4
Rebounds Per Game
46.7
1.6
Assist To Turnover Ratio
2.1
21.9
Fouls Per Game
20.6
7
Games Played
7
0
Games Started
0
0
Minutes
0
0.0
Minutes Per Game
0.0
297
Rebounds
327
297
Rebounds
327
Offensive
77.7
Free Throw Percentage
79.0
33.1
3-Point Field Goal Percentage
34.8
41.7
Average Field Goals Made
43.1
86.3
Average Field Goals Attempted
92.9
12.1
Average 3-Point Field Goals Made
12.4
36.7
Average 3-Point Field Goals Attempted
35.7
16.4
Average Free Throws Made
18.9
21.1
Average Free Throws Attempted
23.9
112.0
Points Per Game
117.6
11.0
Offensive Rebounds Per Game
11.9
25.9
Assists Per Game
27.4
15.9
Turnovers Per Game
13.0
59.7
2-Point Field Goal Percentage
53.8
1.298
Scoring Efficiency
1.266
0.55
Shooting Efficiency
0.53
48.3
Field Goal Percentage
46.5
207.0
2-Point Field Goals Made
215.0
347.0
2-Point Field Goals Attempted
400.0
784
Points
823
77
Offensive Rebounds
83
181
Assists
192
111
Turnovers
91
292
Field Goals Made
302
604
Field Goals Attempted
650
115
Free Throws Made
132
148
Free Throws Attempted
167
85
3-Point Field Goals Made
87
257
3-Point Field Goals Attempted
250
33.1
3-Point Field Goal Percentage
34.8
29.6
2-Point Field Goals Made per Game
30.7
49.6
2-Point Field Goals Attempted per Game
57.1
Defensive
31.4
Defensive Rebounds Per Game
34.9
6.0
Blocks Per Game
7.0
9.1
Steals Per Game
8.7
220
Defensive Rebounds
244
64
Steals
61
42
Blocks
49