

Pacers vs Lakers Live Score (22 Dec, 2026)
Game Information
League
NBA
Season
1
Date
December 21, 2026
Tipoff
10:00 PM EST
Status
Scheduled
Team Stats
 IND
Game Comparison
LAL
-Points-
-Rebounds-
-Assists-
47Field Goal %49
-3-Point %-
-Free Throw %-
Game Leaders
INDLAL
 —#
Points
—
—#
—#
Rebounds
—
—#
—#
Assists
—
—#
Injury Report
Indiana Pacers
Los Angeles Lakers
H2H / Season Series
Last 5 Games









NBA Standings
Eastern Conference — Central



Western Conference — Pacific
| Team | W | L | PCT | GB | STRK |
|---|---|---|---|---|---|
| LA Lakers | 13 | 3 | .813 | - | L1 |
 Golden State | 8 | 8 | .500 | 5 | L5 |
 Phoenix | 7 | 7 | .500 | 5 | W2 |
 LA Clippers | 4 | 10 | .286 | 8 | L2 |
 Sacramento | 1 | 13 | .071 | 11 | L7 |
Rosters
Pacers
3rd in Central Division
VS
Lakers
1st in Pacific Division
Forward
#43

Pascal Siakam
#1
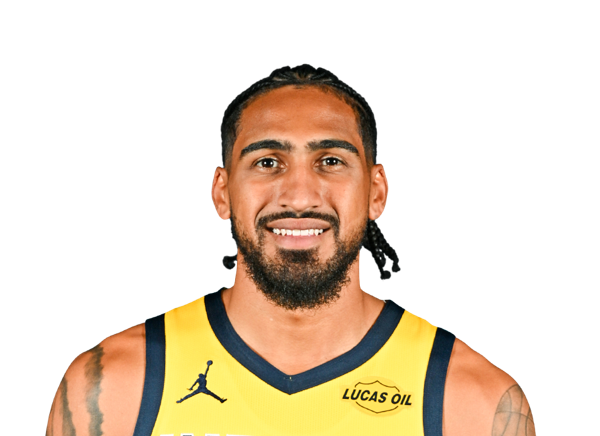
Obi Toppin
#5
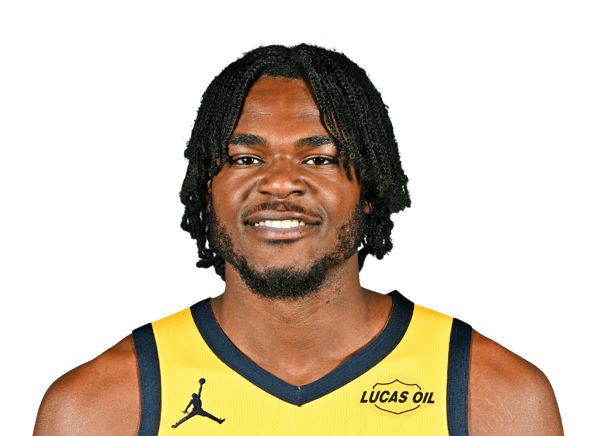
Jarace Walker
#22
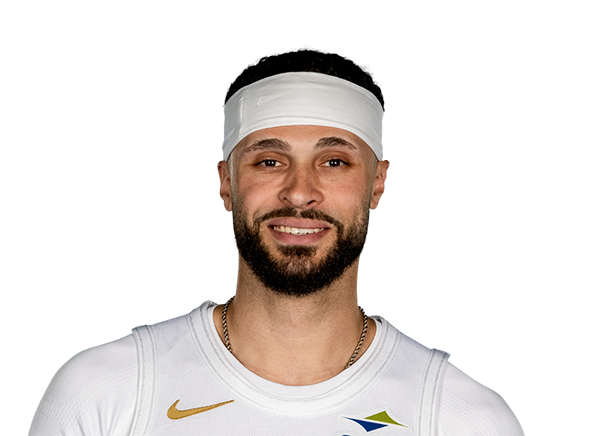
Larry Nance Jr.
#18

Jalen Slawson
Guard
#2

Andrew Nembhard
#10

Kelly Oubre Jr.
#23

Aaron Nesmith
#29
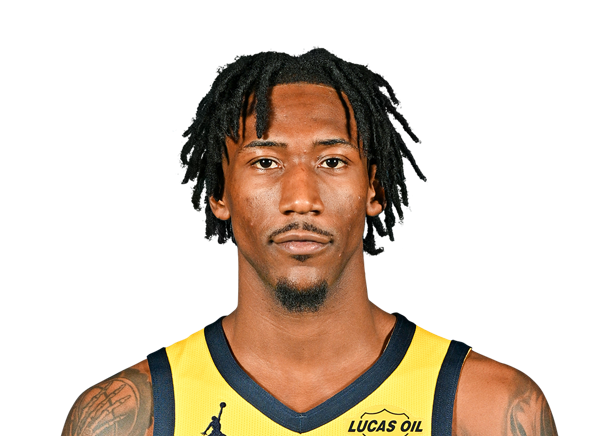
Quenton Jackson
#3

Braden Smith
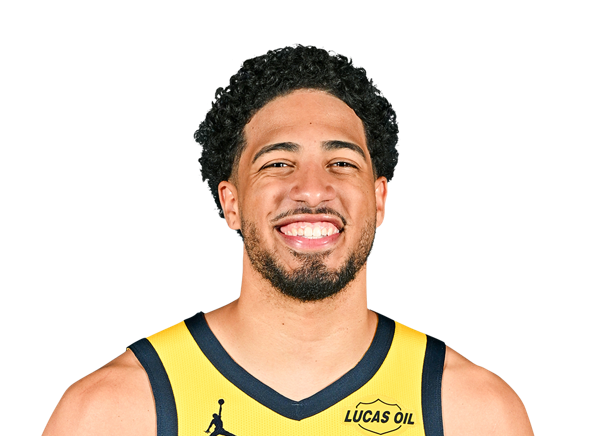
Tyrese Haliburton
#9

T.J. McConnell
#24

Kobe Brown
#26
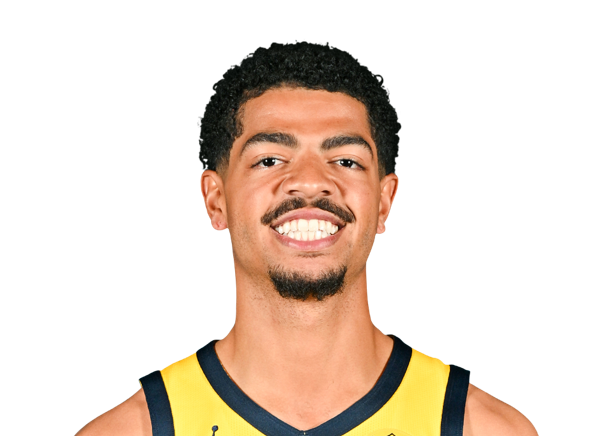
Ben Sheppard
#12

Johnny Furphy
Center
#40
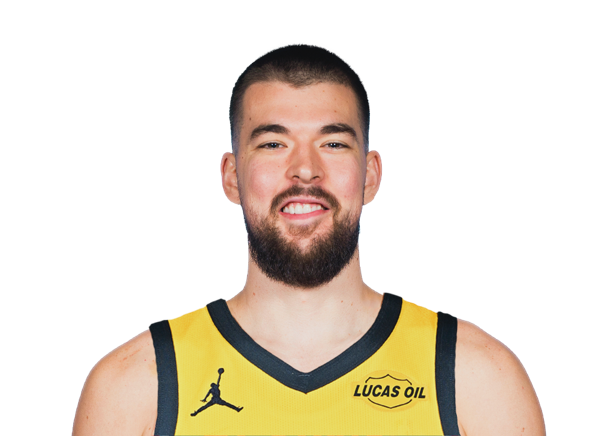
Ivica Zubac
#32

Jay Huff
Guard
#77

Luka Doncic
#15

Austin Reaves
#5

Quentin Grimes
#10
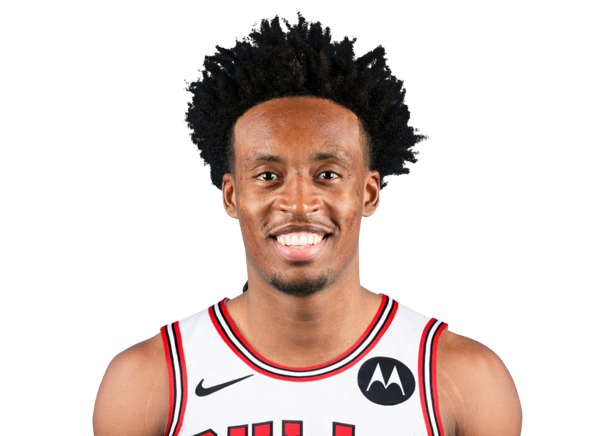
Collin Sexton
#4
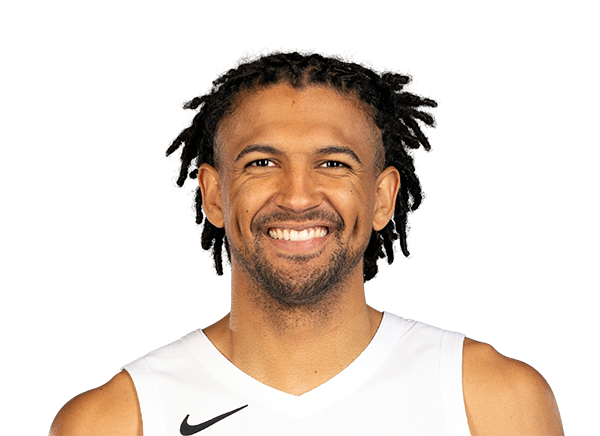
Matisse Thybulle
#43
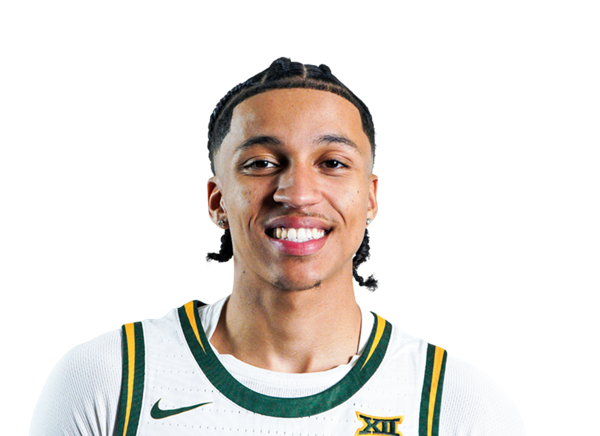
Cameron Carr
#7

Jaden Hardy
#9

Bronny James
#30
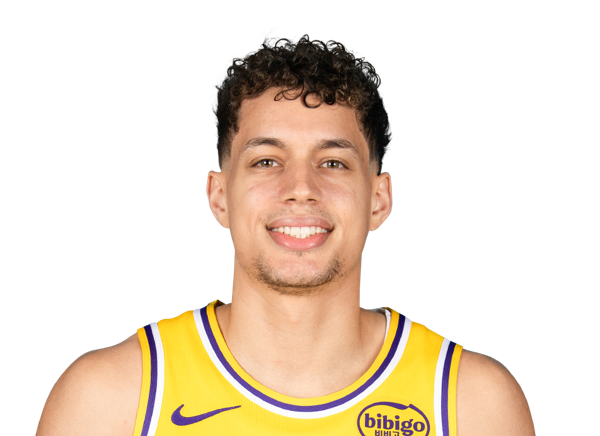
Chris Manon
Center
#14
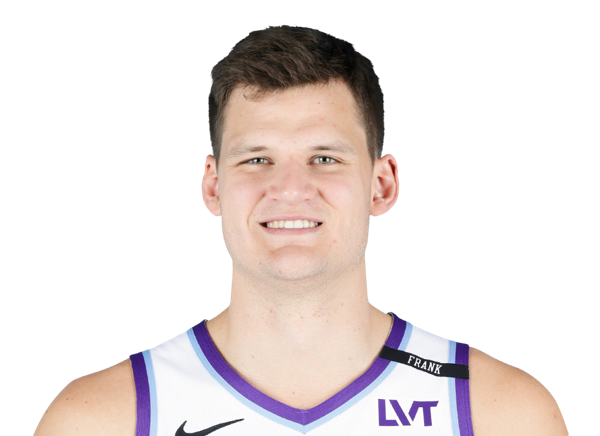
Walker Kessler

Carson Cooper

Lawson Lovering
Forward
#54

Sandro Mamukelashvili
#11
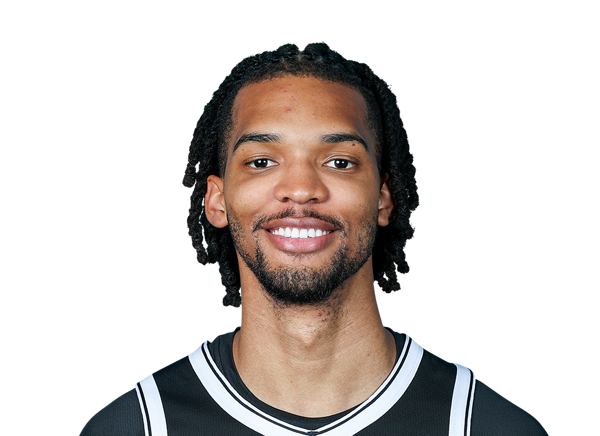
Ziaire Williams
#12

Jake LaRavia
#2

Jarred Vanderbilt
#55
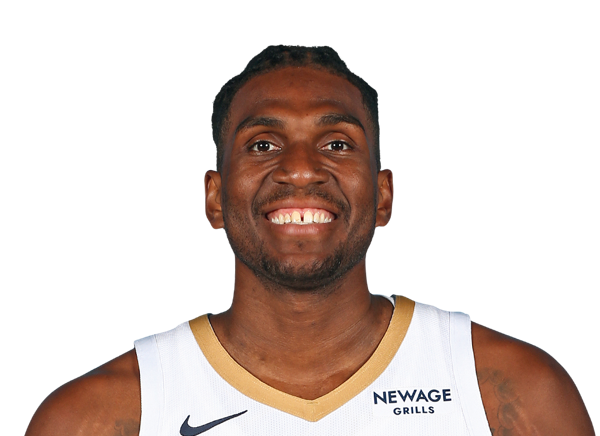
Kevon Looney
#1

Adou Thiero
Team Statistics
Pacers
3rd in Central Division
VS
Lakers
1st in Pacific Division
General
41.8
Rebounds Per Game
41.1
2.1
Assist To Turnover Ratio
1.6
20.1
Fouls Per Game
22.5
16
Games Played
17
0
Games Started
0
0
Minutes
0
0.0
Minutes Per Game
0.0
668
Rebounds
698
668
Rebounds
698
Offensive
76.1
Free Throw Percentage
78.7
33.1
3-Point Field Goal Percentage
37.1
41.2
Average Field Goals Made
41.4
87.2
Average Field Goals Attempted
84.6
11.9
Average 3-Point Field Goals Made
13.9
35.9
Average 3-Point Field Goals Attempted
37.5
17.8
Average Free Throws Made
23.2
23.3
Average Free Throws Attempted
29.5
112.0
Points Per Game
120.0
9.4
Offensive Rebounds Per Game
11.8
28.1
Assists Per Game
24.6
13.6
Turnovers Per Game
15.8
57.1
2-Point Field Goal Percentage
58.3
1.285
Scoring Efficiency
1.418
0.54
Shooting Efficiency
0.57
47.2
Field Goal Percentage
48.9
469.0
2-Point Field Goals Made
467.0
821.0
2-Point Field Goals Attempted
801.0
1792
Points
2040
151
Offensive Rebounds
201
449
Assists
418
218
Turnovers
268
659
Field Goals Made
704
1395
Field Goals Attempted
1439
284
Free Throws Made
395
373
Free Throws Attempted
502
190
3-Point Field Goals Made
237
574
3-Point Field Goals Attempted
638
33.1
3-Point Field Goal Percentage
37.1
29.3
2-Point Field Goals Made per Game
27.5
51.3
2-Point Field Goals Attempted per Game
47.1
Defensive
32.3
Defensive Rebounds Per Game
29.2
4.7
Blocks Per Game
5.8
7.5
Steals Per Game
10.6
517
Defensive Rebounds
497
120
Steals
181
75
Blocks
98