

Pelicans vs Nets Live Score (26 Dec, 2026)
Game Information
League
NBA
Season
1
Date
December 26, 2026
Tipoff
6:00 PM EST
Status
Scheduled
Team Stats
 NO
Game Comparison
BKN
-Points-
-Rebounds-
-Assists-
46Field Goal %45
-3-Point %-
-Free Throw %-
Game Leaders
NOBKN
 —#
Points
—
—#
—#
Rebounds
—
—#
—#
Assists
—
—#
Injury Report
New Orleans Pelicans
Brooklyn Nets
H2H / Season Series
Last 5 Games




NBA Standings
Western Conference — Southwest
| Team | W | L | PCT | GB | STRK |
|---|---|---|---|---|---|
 San Antonio | 13 | 3 | .813 | - | W1 |
 Houston | 12 | 4 | .750 | 1 | W1 |
 Memphis | 12 | 4 | .750 | 1 | W5 |
 Dallas | 8 | 7 | .533 | 4.5 | W1 |
| New Orleans | 5 | 11 | .313 | 8 | L1 |
Eastern Conference — Atlantic
| Team | W | L | PCT | GB | STRK |
|---|---|---|---|---|---|
 Philadelphia | 13 | 3 | .813 | - | W4 |
 Boston | 11 | 4 | .733 | 1.5 | L2 |
 New York | 9 | 6 | .600 | 3.5 | W3 |
 Toronto | 5 | 10 | .333 | 7.5 | L6 |
| Brooklyn | 3 | 11 | .214 | 9 | L3 |
Rosters
Pelicans
12th in Western Conference Division
VS
Nets
5th in Atlantic Division
Forward
#1

Zion Williamson
#41
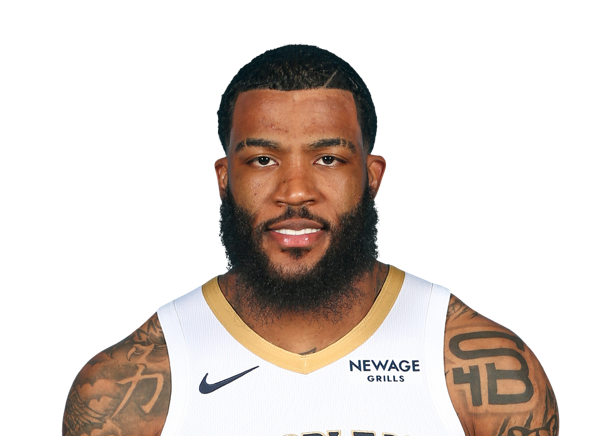
Saddiq Bey
#2

Herbert Jones
#17

Karlo Matkovic
#25

Trey Murphy III
#9
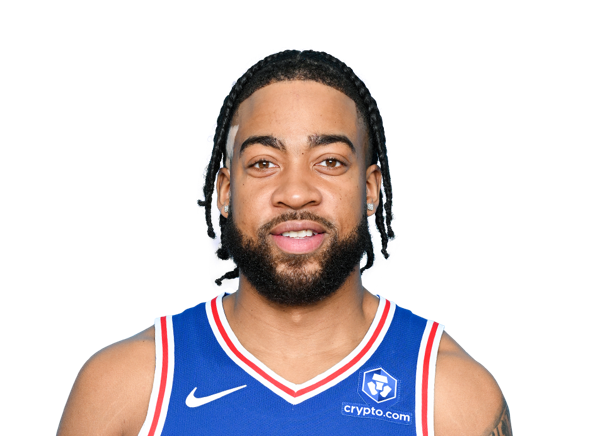
Trendon Watford
#8
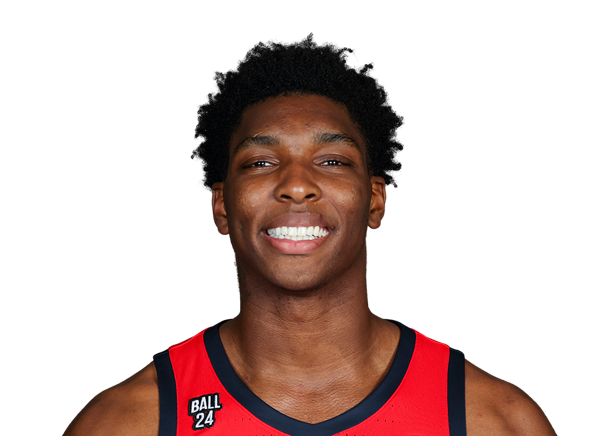
Malik Dia
#13

Julian Reese
Guard

Jeremiah Fears
#3

Jordan Poole
#24
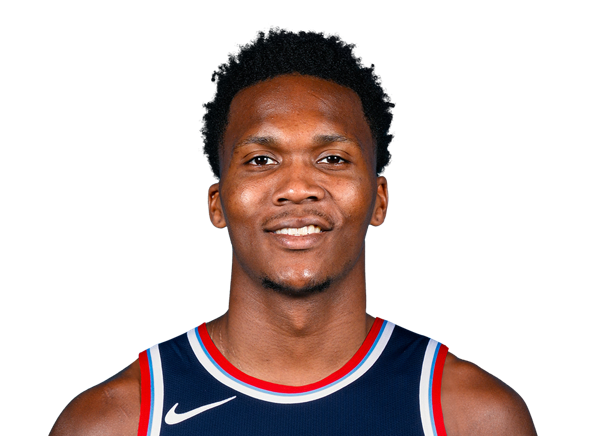
Bennedict Mathurin
#5

Dejounte Murray
#10

Jaron Pierre Jr.
#11

Bryce McGowens
#14
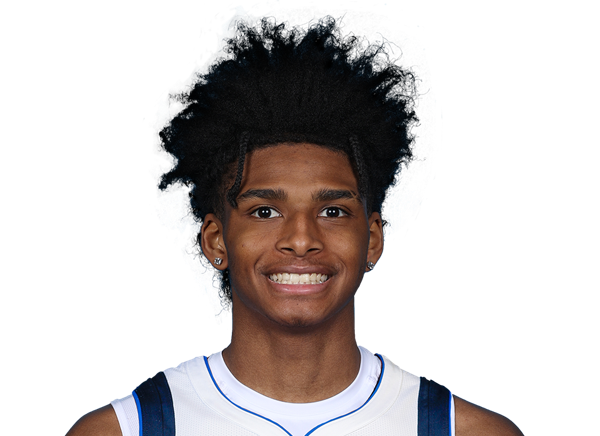
AJ Johnson
Center
#22
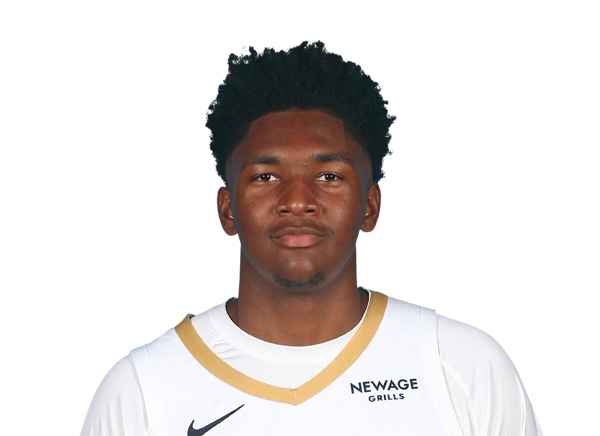
Derik Queen
#21
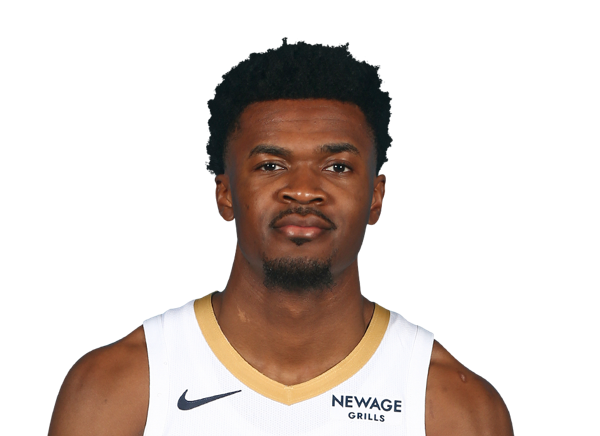
Yves Missi
#6

DeAndre Jordan
Forward
#30
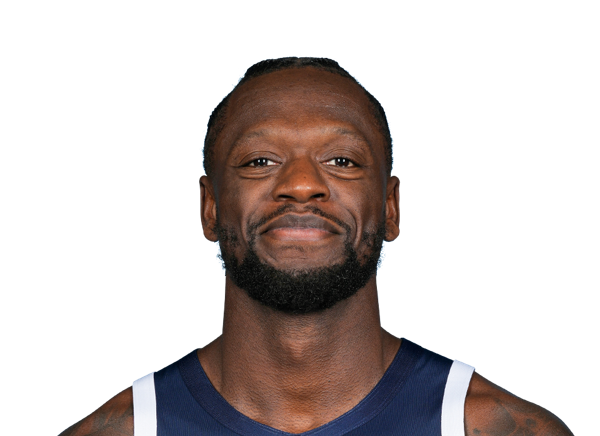
Julius Randle
#17
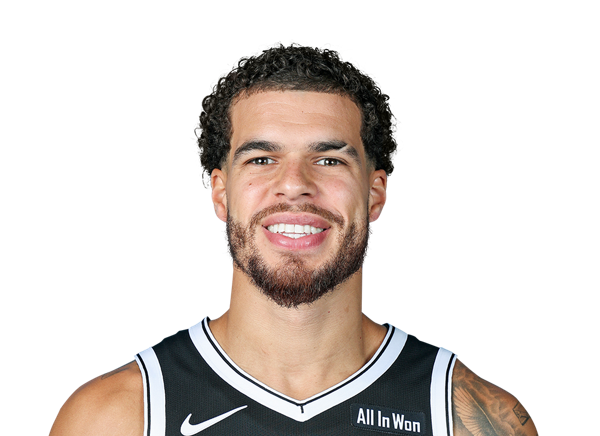
Michael Porter Jr.
#2
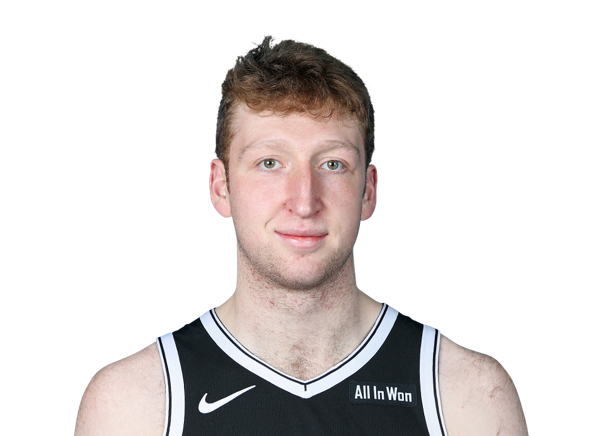
Danny Wolf
#21
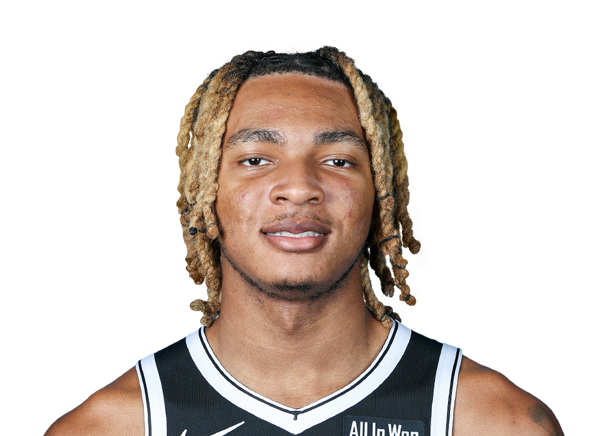
Noah Clowney
#31

Chaney Johnson
#00

Josh Minott
#9

Joshua Jefferson
#16

Grant Nelson
Guard
#10
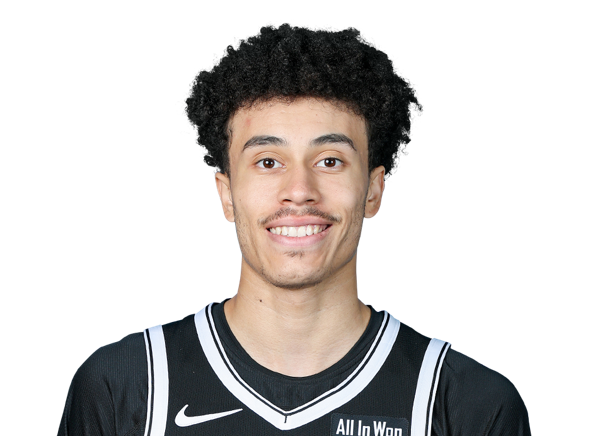
Nolan Traore
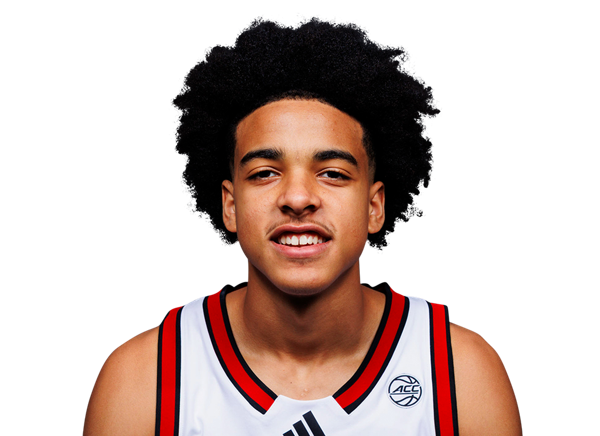
Mikel Brown Jr.
#8
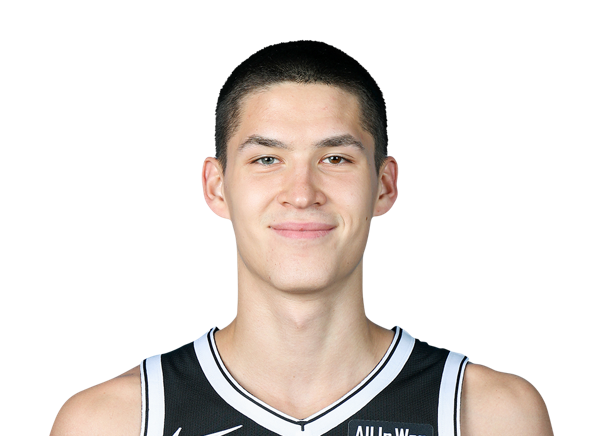
Egor Demin
#1

Keon Ellis
#4

Drake Powell
#77

Ben Saraf
#14

Terance Mann
Center
#13
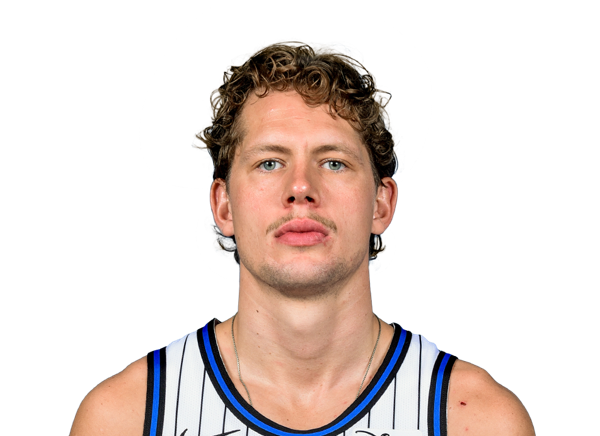
Moritz Wagner
#20
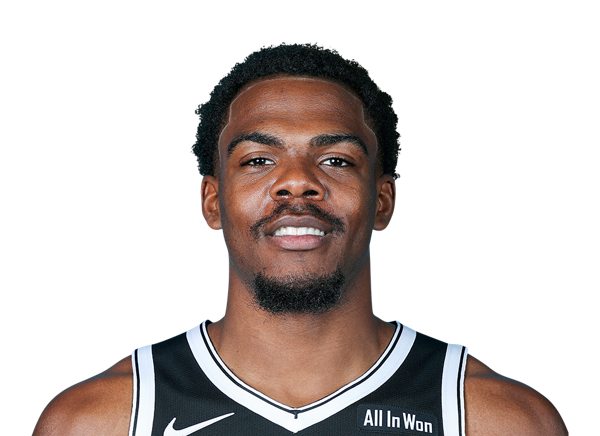
Day'Ron Sharpe
Team Statistics
Pelicans
12th in Western Conference Division
VS
Nets
5th in Atlantic Division
General
42.5
Rebounds Per Game
41.3
1.6
Assist To Turnover Ratio
1.5
23.7
Fouls Per Game
25.5
18
Games Played
15
0
Games Started
0
0
Minutes
0
0.0
Minutes Per Game
0.0
765
Rebounds
619
765
Rebounds
619
Offensive
81.1
Free Throw Percentage
75.4
33.6
3-Point Field Goal Percentage
36.0
39.7
Average Field Goals Made
37.7
87.1
Average Field Goals Attempted
84.1
10.2
Average 3-Point Field Goals Made
14.3
30.2
Average 3-Point Field Goals Attempted
39.9
24.8
Average Free Throws Made
21.1
30.6
Average Free Throws Attempted
27.9
114.3
Points Per Game
110.9
11.4
Offensive Rebounds Per Game
11.5
23.4
Assists Per Game
24.3
14.9
Turnovers Per Game
16.5
51.9
2-Point Field Goal Percentage
52.9
1.312
Scoring Efficiency
1.318
0.51
Shooting Efficiency
0.53
45.5
Field Goal Percentage
44.8
531.0
2-Point Field Goals Made
351.0
1024.0
2-Point Field Goals Attempted
664.0
2057
Points
1663
206
Offensive Rebounds
172
422
Assists
365
269
Turnovers
247
714
Field Goals Made
566
1568
Field Goals Attempted
1262
446
Free Throws Made
316
550
Free Throws Attempted
419
183
3-Point Field Goals Made
215
544
3-Point Field Goals Attempted
598
33.6
3-Point Field Goal Percentage
36.0
29.5
2-Point Field Goals Made per Game
23.4
56.9
2-Point Field Goals Attempted per Game
44.3
Defensive
31.1
Defensive Rebounds Per Game
29.8
4.8
Blocks Per Game
4.7
9.3
Steals Per Game
8.4
559
Defensive Rebounds
447
168
Steals
126
87
Blocks
71