

Pelicans vs Pacers Live Score (9 Feb, 2027)
Game Information
League
NBA
Season
1
Date
February 8, 2027
Tipoff
7:00 PM EST
Status
Scheduled
Team Stats
 NO
Game Comparison
IND
-Points-
-Rebounds-
-Assists-
48Field Goal %47
-3-Point %-
-Free Throw %-
Game Leaders
NOIND
 —#
Points
—
—#
—#
Rebounds
—
—#
—#
Assists
—
—#
Injury Report
H2H / Season Series
Last 5 Games







NBA Standings
Western Conference — Southwest
| Team | W | L | PCT | GB | STRK |
|---|---|---|---|---|---|
 San Antonio | 9 | 2 | .818 | - | W9 |
 Houston | 8 | 3 | .727 | 1 | W1 |
 Memphis | 7 | 3 | .700 | 1.5 | W1 |
 Dallas | 7 | 4 | .636 | 2 | W3 |
| New Orleans | 4 | 7 | .364 | 5 | L3 |




Rosters
Pelicans
13th in Western Conference Division
VS
Pacers
3rd in Central Division
Forward
#1

Zion Williamson
#41
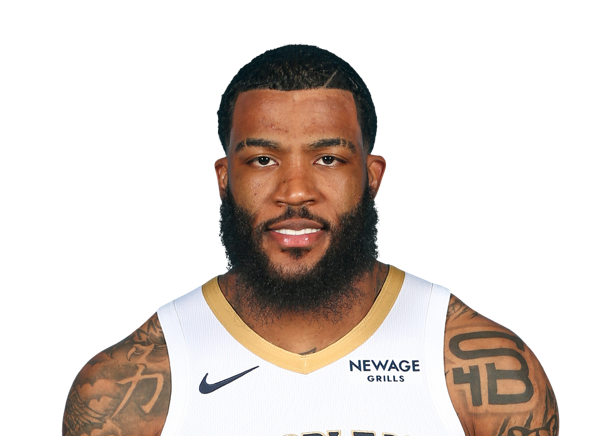
Saddiq Bey
#25

Trey Murphy III
#17

Karlo Matkovic
#2

Herbert Jones
#9
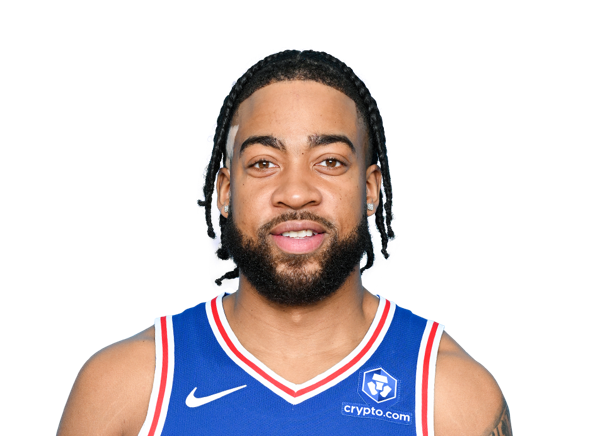
Trendon Watford
#8
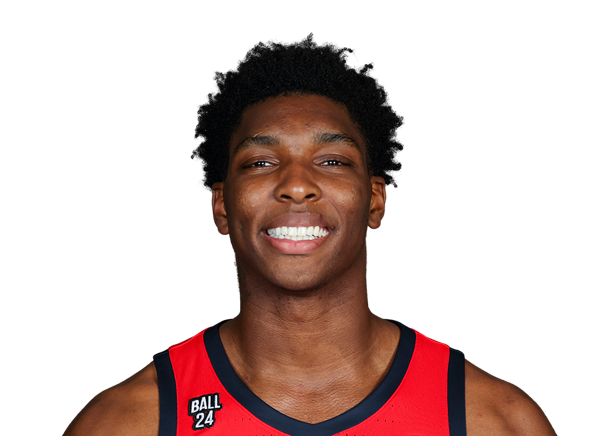
Malik Dia
#13
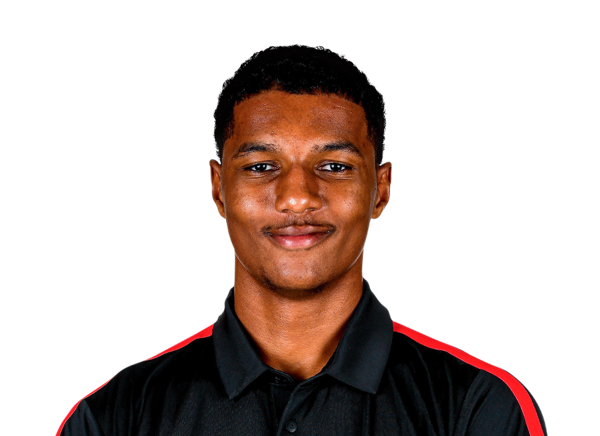
Julian Reese
Guard

Jeremiah Fears
#5

Dejounte Murray
#24
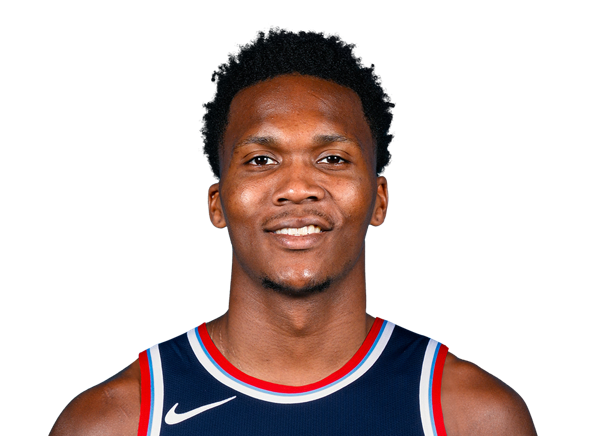
Bennedict Mathurin
#3

Jordan Poole
#10

Jaron Pierre Jr.
#11

Bryce McGowens
#14
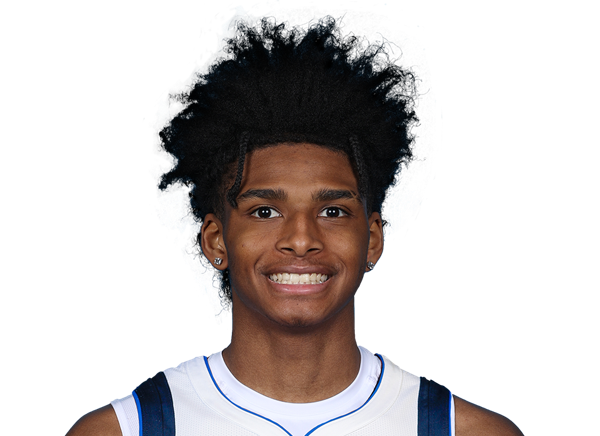
AJ Johnson
Center
#22
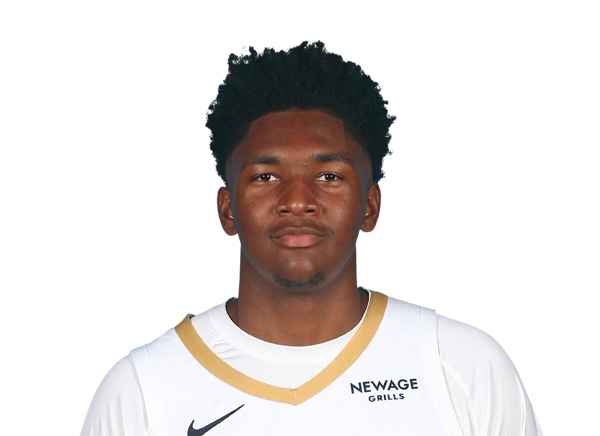
Derik Queen
#21
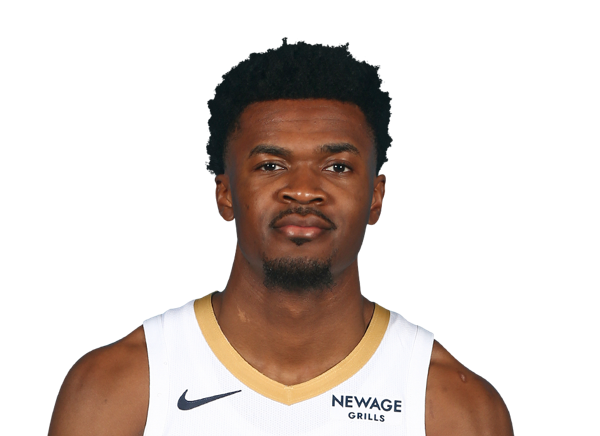
Yves Missi
#6

DeAndre Jordan
Forward
#43

Pascal Siakam
#1
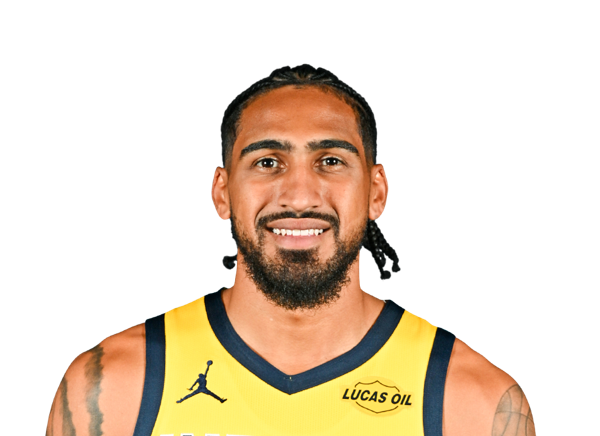
Obi Toppin
#5
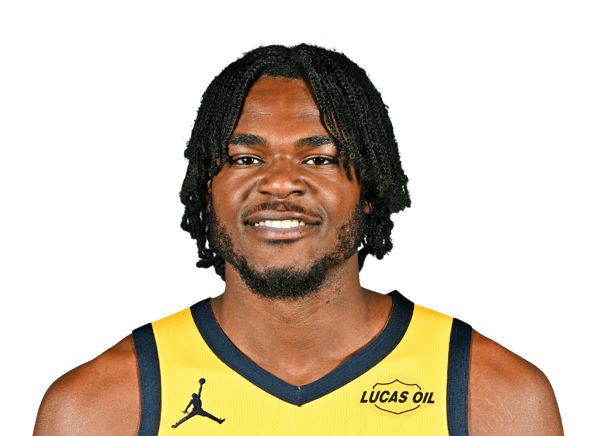
Jarace Walker
#22
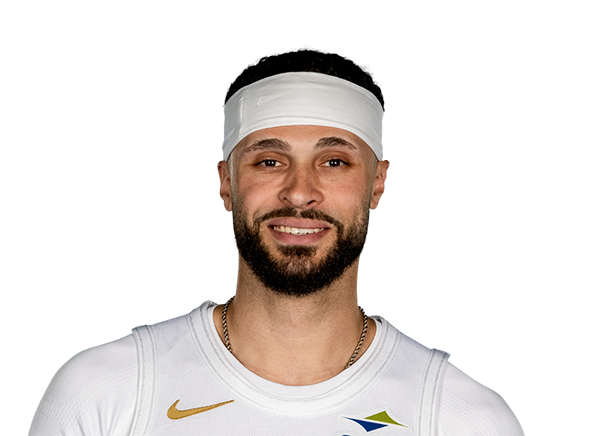
Larry Nance Jr.
#18

Jalen Slawson
Guard
#2

Andrew Nembhard
#23

Aaron Nesmith
#10

Kelly Oubre Jr.
#29
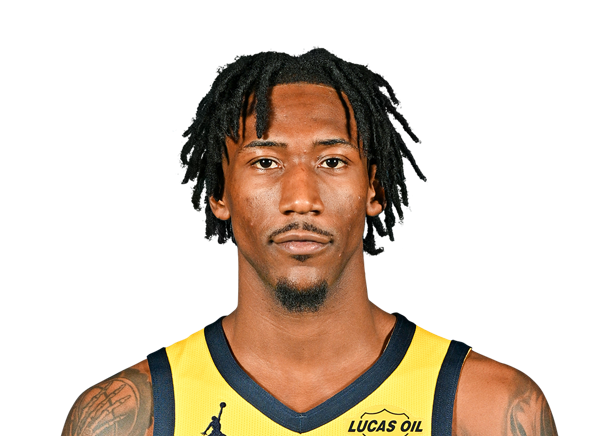
Quenton Jackson
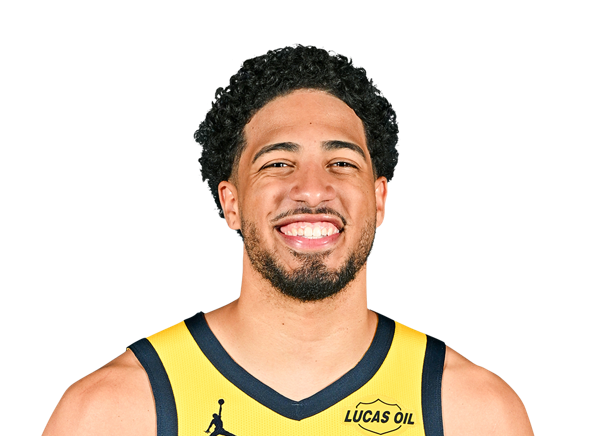
Tyrese Haliburton
#9

T.J. McConnell
#24

Kobe Brown
#3

Braden Smith
#26
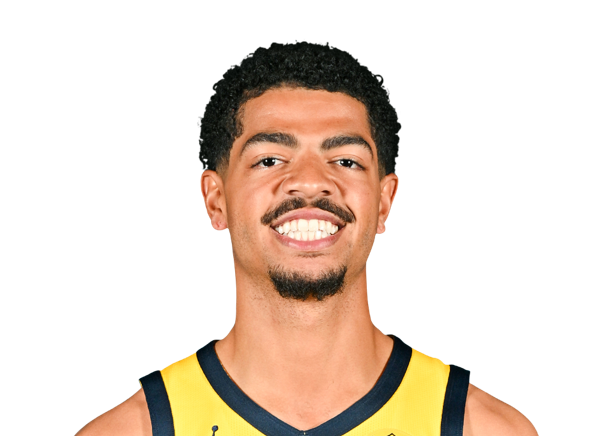
Ben Sheppard
#12

Johnny Furphy
Center
#40
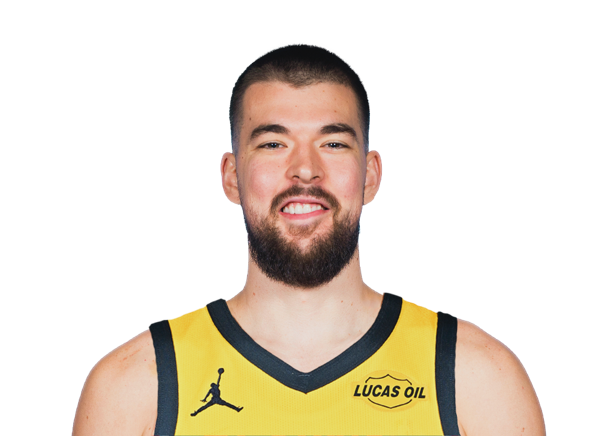
Ivica Zubac
#32

Jay Huff
Team Statistics
Pelicans
13th in Western Conference Division
VS
Pacers
3rd in Central Division
General
41.1
Rebounds Per Game
41.6
1.6
Assist To Turnover Ratio
2.0
24.6
Fouls Per Game
20.4
14
Games Played
14
0
Games Started
0
0
Minutes
0
0.0
Minutes Per Game
0.0
575
Rebounds
583
575
Rebounds
583
Offensive
82.0
Free Throw Percentage
76.5
32.8
3-Point Field Goal Percentage
32.8
40.1
Average Field Goals Made
40.9
86.2
Average Field Goals Attempted
87.1
9.4
Average 3-Point Field Goals Made
11.9
28.7
Average 3-Point Field Goals Attempted
36.1
26.3
Average Free Throws Made
18.4
32.1
Average Free Throws Attempted
24.0
115.9
Points Per Game
112.1
10.6
Offensive Rebounds Per Game
9.6
24.3
Assists Per Game
27.8
15.5
Turnovers Per Game
13.8
53.3
2-Point Field Goal Percentage
57.1
1.344
Scoring Efficiency
1.287
0.52
Shooting Efficiency
0.54
46.5
Field Goal Percentage
47.0
429.0
2-Point Field Goals Made
407.0
805.0
2-Point Field Goals Attempted
713.0
1622
Points
1569
148
Offensive Rebounds
135
340
Assists
389
217
Turnovers
193
561
Field Goals Made
573
1207
Field Goals Attempted
1219
368
Free Throws Made
257
449
Free Throws Attempted
336
132
3-Point Field Goals Made
166
402
3-Point Field Goals Attempted
506
32.8
3-Point Field Goal Percentage
32.8
30.6
2-Point Field Goals Made per Game
29.1
57.5
2-Point Field Goals Attempted per Game
50.9
Defensive
30.5
Defensive Rebounds Per Game
32.0
5.3
Blocks Per Game
4.2
9.9
Steals Per Game
7.2
427
Defensive Rebounds
448
138
Steals
101
74
Blocks
59