

Pelicans vs Pistons Live Score (31 Dec, 2026)
Game Information
League
NBA
Season
1
Date
December 30, 2026
Tipoff
7:00 PM EST
Status
Scheduled
Team Stats
 NO
Game Comparison
DET
-Points-
-Rebounds-
-Assists-
46Field Goal %47
-3-Point %-
-Free Throw %-
Game Leaders
NODET
 —#
Points
—
—#
—#
Rebounds
—
—#
—#
Assists
—
—#
Injury Report
New Orleans Pelicans
Detroit Pistons

H2H / Season Series
Last 5 Games





NBA Standings
Western Conference — Southwest
| Team | W | L | PCT | GB | STRK |
|---|---|---|---|---|---|
 San Antonio | 13 | 3 | .813 | - | W1 |
 Houston | 12 | 4 | .750 | 1 | W1 |
 Memphis | 12 | 4 | .750 | 1 | W5 |
 Dallas | 8 | 7 | .533 | 4.5 | W1 |
| New Orleans | 5 | 11 | .313 | 8 | L1 |




Rosters
Pelicans
12th in Western Conference Division
VS
Pistons
1st in Central Division
Forward
#1

Zion Williamson
#41
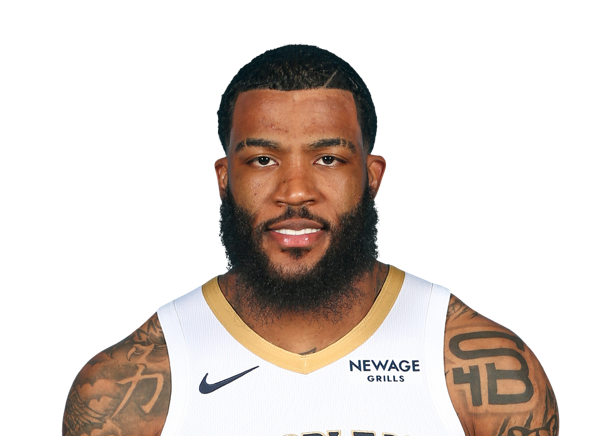
Saddiq Bey
#2

Herbert Jones
#17

Karlo Matkovic
#25

Trey Murphy III
#9
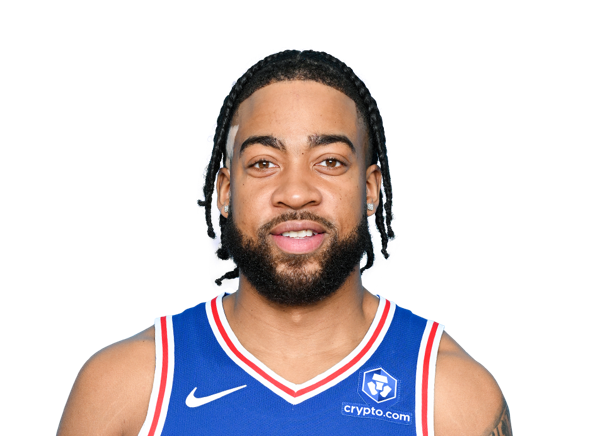
Trendon Watford
#8
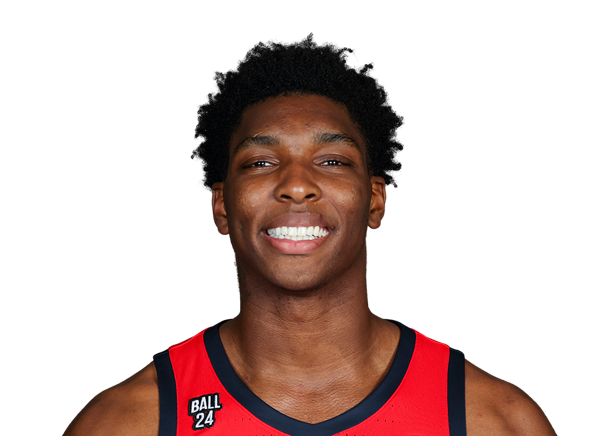
Malik Dia
#13

Julian Reese
Guard

Jeremiah Fears
#3

Jordan Poole
#24
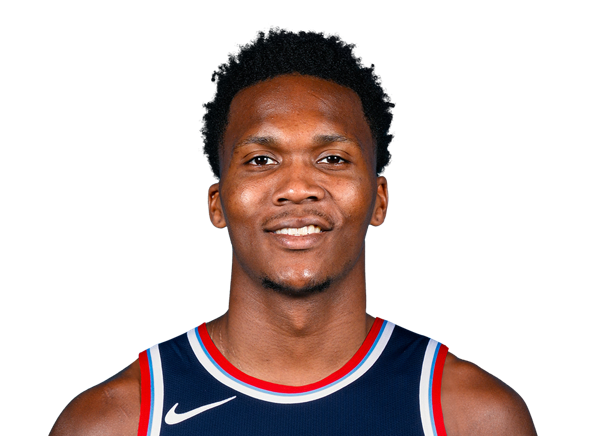
Bennedict Mathurin
#5

Dejounte Murray
#10

Jaron Pierre Jr.
#11

Bryce McGowens
#14
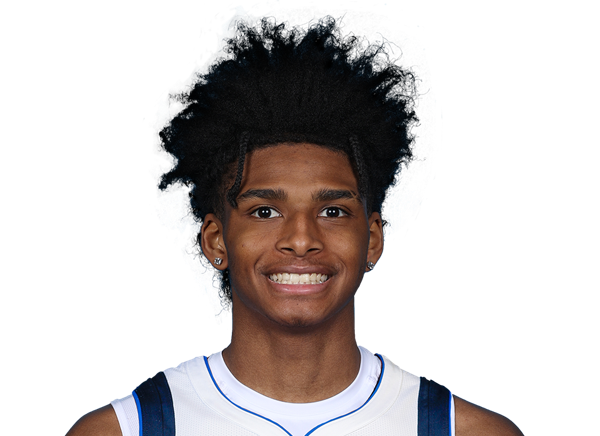
AJ Johnson
Center
#22
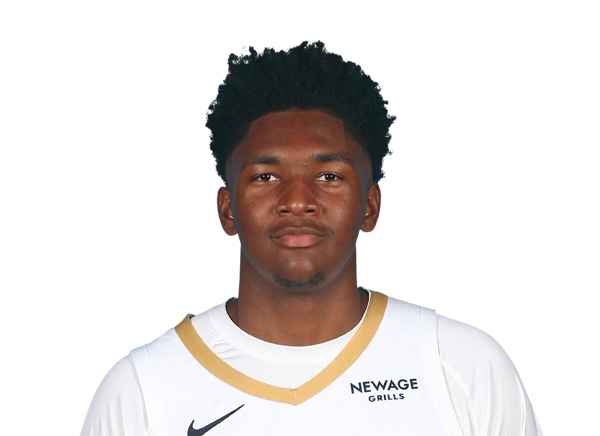
Derik Queen
#21
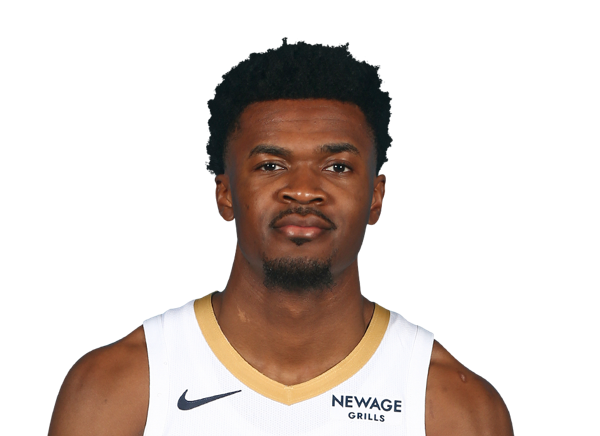
Yves Missi
#6

DeAndre Jordan
Guard
#2

Cade Cunningham
#24

Daniss Jenkins
#27

Kevin Huerter
#9
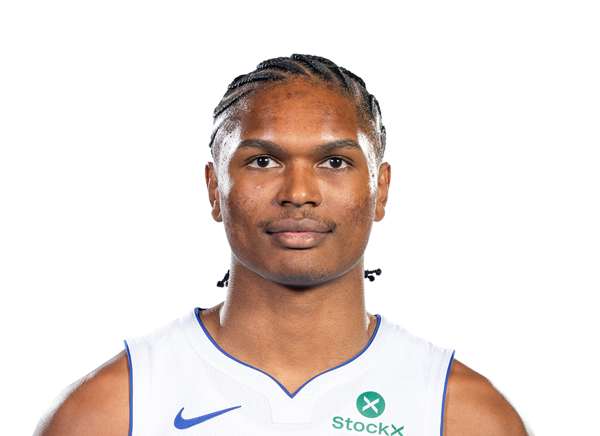
Ausar Thompson
#31

Javonte Green
#17

Isaiah Joe
#8

Chaz Lanier
#23
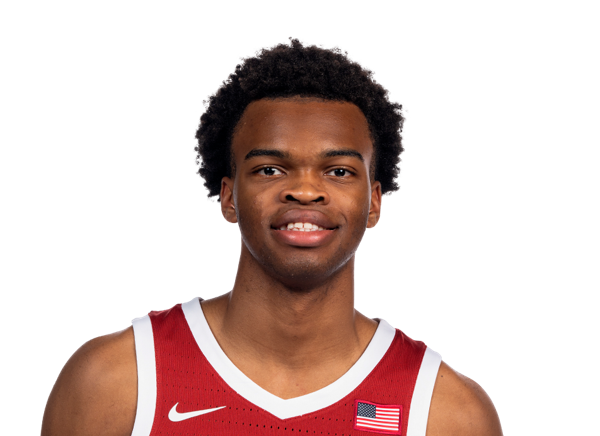
Ebuka Okorie
#94

Elijah Harkless
Forward
#55

Duncan Robinson
#7

Paul Reed
#20
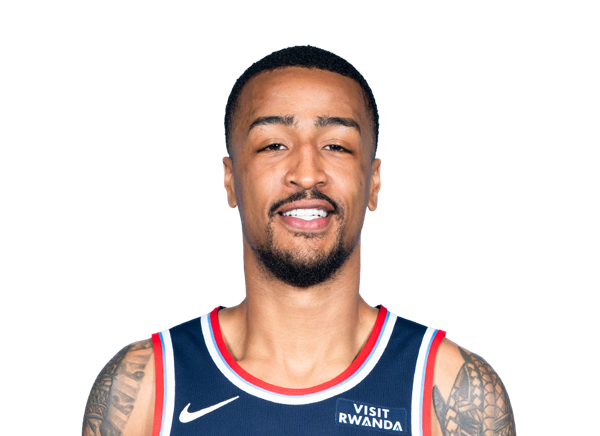
John Collins
#5
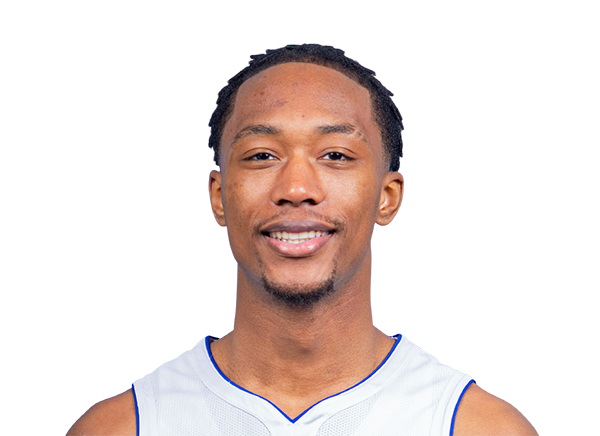
Ronald Holland II
#35

Tolu Smith
#12

Taurean Prince
Center

Jalen Duren
#13

Isaac Jones
Team Statistics
Pelicans
12th in Western Conference Division
VS
Pistons
1st in Central Division
General
42.5
Rebounds Per Game
43.1
1.6
Assist To Turnover Ratio
2.1
23.7
Fouls Per Game
22.9
18
Games Played
15
0
Games Started
0
0
Minutes
0
0.0
Minutes Per Game
0.0
765
Rebounds
647
765
Rebounds
647
Offensive
81.1
Free Throw Percentage
79.1
33.6
3-Point Field Goal Percentage
37.0
39.7
Average Field Goals Made
40.9
87.1
Average Field Goals Attempted
87.3
10.2
Average 3-Point Field Goals Made
13.1
30.2
Average 3-Point Field Goals Attempted
35.5
24.8
Average Free Throws Made
19.5
30.6
Average Free Throws Attempted
24.6
114.3
Points Per Game
114.5
11.4
Offensive Rebounds Per Game
11.9
23.4
Assists Per Game
27.5
14.9
Turnovers Per Game
13.2
51.9
2-Point Field Goal Percentage
53.6
1.312
Scoring Efficiency
1.311
0.51
Shooting Efficiency
0.54
45.5
Field Goal Percentage
46.9
531.0
2-Point Field Goals Made
417.0
1024.0
2-Point Field Goals Attempted
778.0
2057
Points
1717
206
Offensive Rebounds
178
422
Assists
412
269
Turnovers
198
714
Field Goals Made
614
1568
Field Goals Attempted
1310
446
Free Throws Made
292
550
Free Throws Attempted
369
183
3-Point Field Goals Made
197
544
3-Point Field Goals Attempted
532
33.6
3-Point Field Goal Percentage
37.0
29.5
2-Point Field Goals Made per Game
27.8
56.9
2-Point Field Goals Attempted per Game
51.9
Defensive
31.1
Defensive Rebounds Per Game
31.3
4.8
Blocks Per Game
5.7
9.3
Steals Per Game
9.3
559
Defensive Rebounds
469
168
Steals
139
87
Blocks
86