

Pelicans vs Rockets Live Score (28 Jan, 2027)
Game Information
League
NBA
Season
1
Date
January 27, 2027
Tipoff
8:30 PM EST
Status
Scheduled
Team Stats
 NO
Game Comparison
HOU

-Points-
-Rebounds-
-Assists-
46Field Goal %52
-3-Point %-
-Free Throw %-
Game Leaders
NOHOU
 —#
Points
—
—#
—#Rebounds
—
—#
—#Assists
—
—#
Injury Report
H2H / Season Series
Last 5 Games






NBA Standings
Western Conference — Southwest
| Team | W | L | PCT | GB | STRK |
|---|---|---|---|---|---|
| Houston | 5 | 0 | 1.000 | - | W5 |
 Memphis | 4 | 0 | 1.000 | 0.5 | W4 |
 San Antonio | 3 | 2 | .600 | 2 | W3 |
 Dallas | 3 | 2 | .600 | 2 | W2 |
| New Orleans | 0 | 4 | .000 | 4.5 | L4 |
Rosters
Pelicans
10th in Western Conference Division
VS
Rockets
1st in Western Conference Division
Forward
#1

Zion Williamson
#41
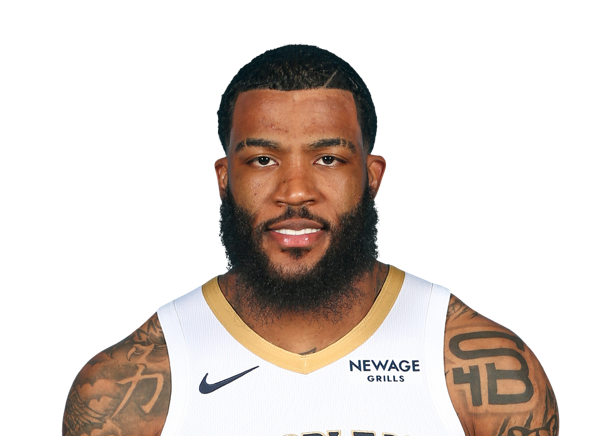
Saddiq Bey
#25

Trey Murphy III
#17

Karlo Matkovic
#2

Herbert Jones
#9
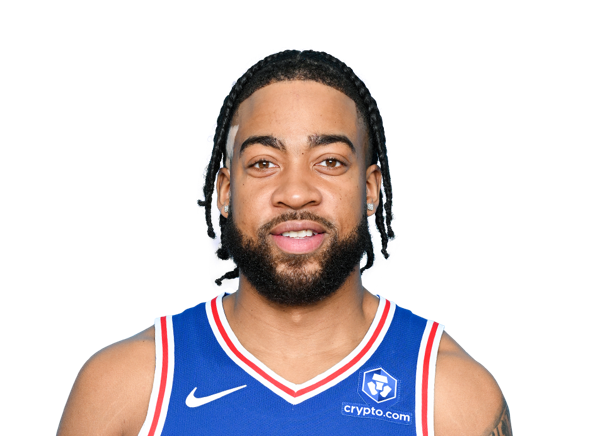
Trendon Watford
#13

Julian Reese
Guard
#5

Dejounte Murray

Jeremiah Fears
#24
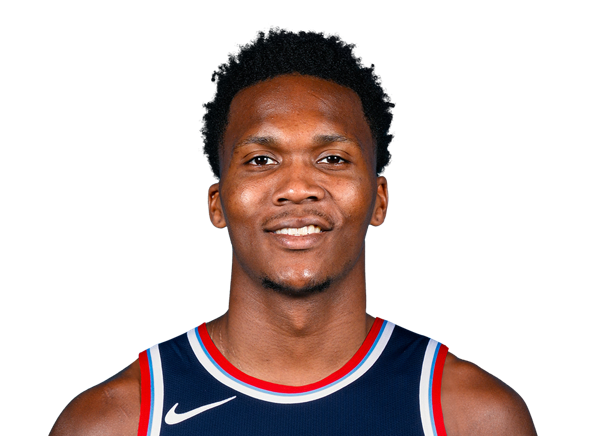
Bennedict Mathurin
#3

Jordan Poole
#11

Bryce McGowens
#14
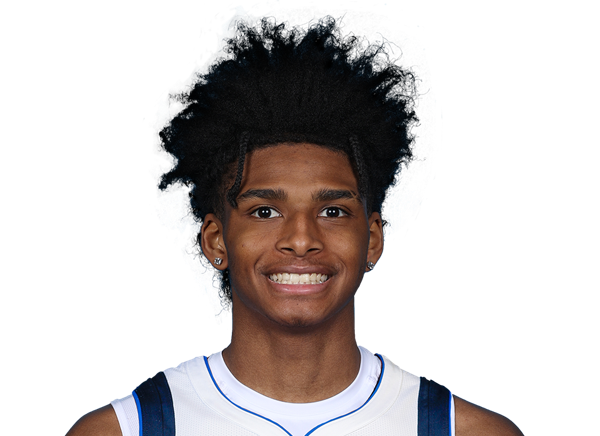
AJ Johnson
Center
#22
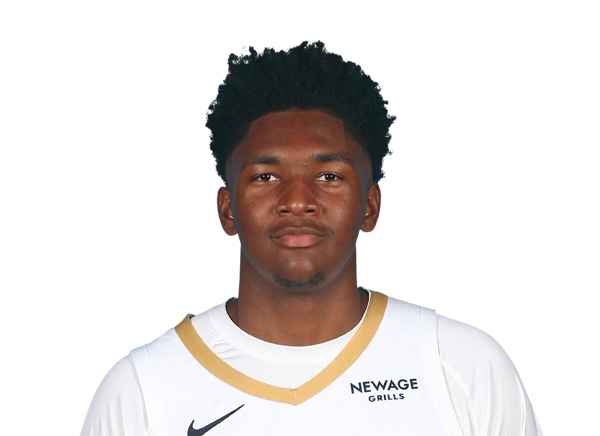
Derik Queen
#21
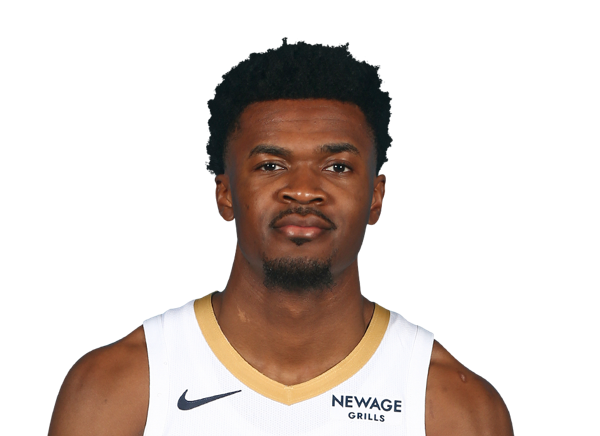
Yves Missi
#6

DeAndre Jordan
Center
#28

Alperen Sengun
#30

Clint Capela
#12
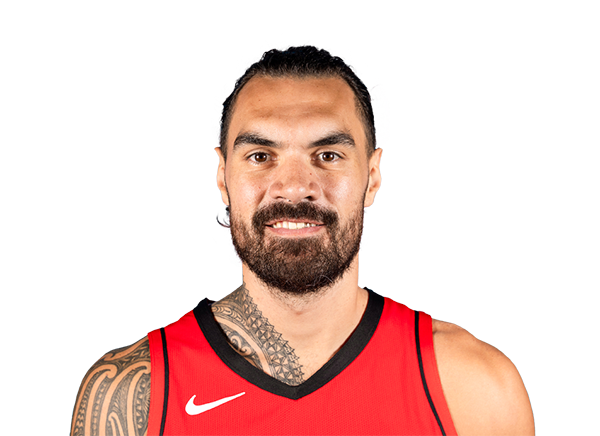
Steven Adams
#9
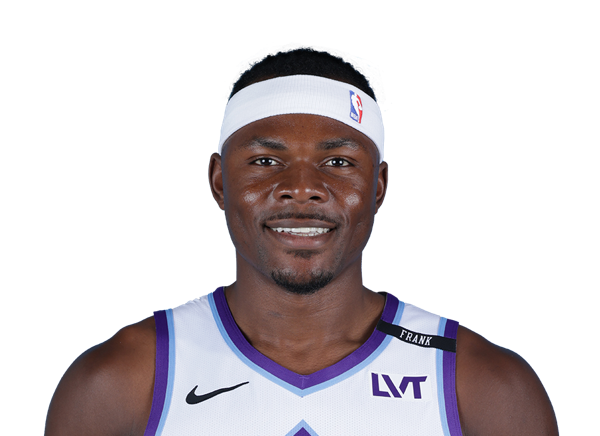
Oscar Tshiebwe
Forward
#7

Kevin Durant
#10

Jabari Smith Jr.
#17

Tari Eason
#27

Isaiah Crawford
#8

Jae'Sean Tate
Guard
#1

Amen Thompson
#5
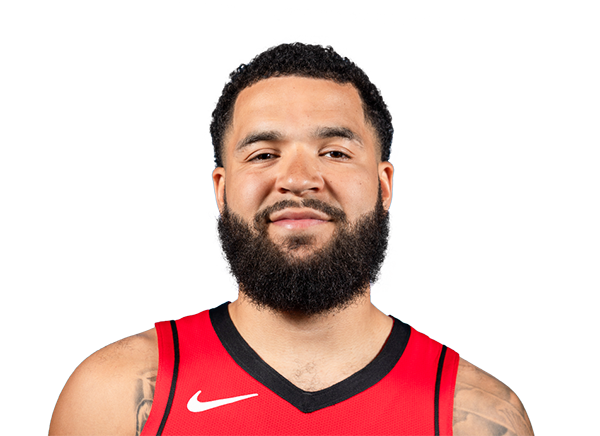
Fred VanVleet
#15
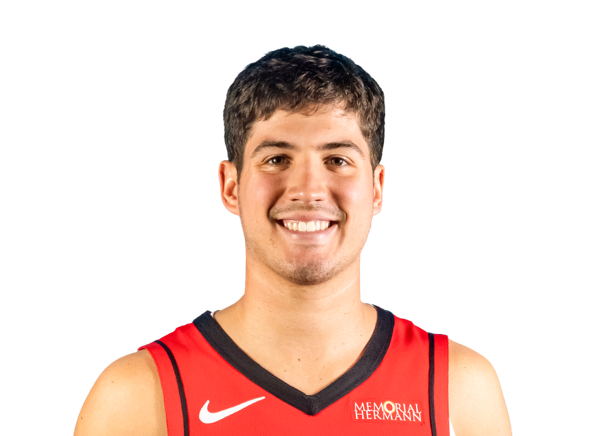
Reed Sheppard
#36
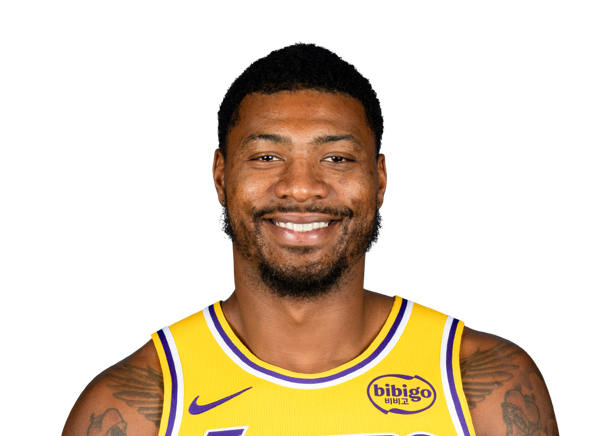
Marcus Smart
#31

Bogdan Bogdanovic
#2
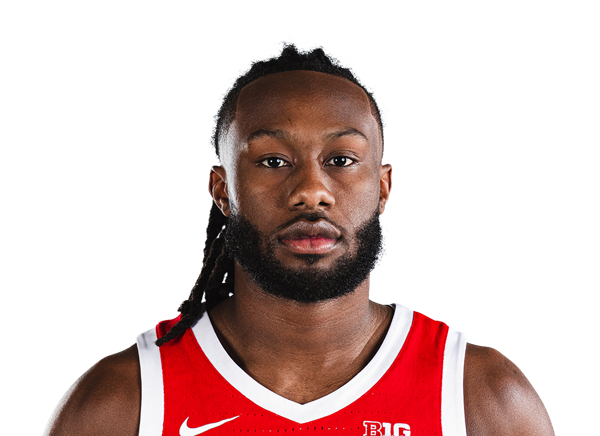
Bruce Thornton
Team Statistics
Pelicans
10th in Western Conference Division
VS
Rockets
1st in Western Conference Division
General
44.9
Rebounds Per Game
43.7
1.5
Assist To Turnover Ratio
1.9
23.0
Fouls Per Game
19.8
8
Games Played
9
0
Games Started
0
0
Minutes
0
0.0
Minutes Per Game
0.0
359
Rebounds
393
359
Rebounds
393
Offensive
82.4
Free Throw Percentage
81.4
31.7
3-Point Field Goal Percentage
38.6
43.1
Average Field Goals Made
41.8
88.5
Average Field Goals Attempted
85.2
9.0
Average 3-Point Field Goals Made
13.0
28.4
Average 3-Point Field Goals Attempted
33.7
26.4
Average Free Throws Made
21.3
32.0
Average Free Throws Attempted
26.2
121.6
Points Per Game
117.9
10.9
Offensive Rebounds Per Game
12.7
25.4
Assists Per Game
28.0
16.8
Turnovers Per Game
14.7
56.8
2-Point Field Goal Percentage
55.8
1.374
Scoring Efficiency
1.383
0.54
Shooting Efficiency
0.57
48.7
Field Goal Percentage
49.0
273.0
2-Point Field Goals Made
259.0
481.0
2-Point Field Goals Attempted
464.0
973
Points
1061
87
Offensive Rebounds
114
203
Assists
252
134
Turnovers
132
345
Field Goals Made
376
708
Field Goals Attempted
767
211
Free Throws Made
192
256
Free Throws Attempted
236
72
3-Point Field Goals Made
117
227
3-Point Field Goals Attempted
303
31.7
3-Point Field Goal Percentage
38.6
34.1
2-Point Field Goals Made per Game
28.8
60.1
2-Point Field Goals Attempted per Game
51.6
Defensive
34.0
Defensive Rebounds Per Game
31.0
4.8
Blocks Per Game
5.9
12.4
Steals Per Game
9.1
272
Defensive Rebounds
279
99
Steals
82
38
Blocks
53