

Spurs vs Pelicans Live Score (17 Jan, 2027)
Game Information
League
NBA
Season
1
Date
January 17, 2027
Tipoff
10:30 AM EST
Status
Scheduled
Team Stats
 SA
Game Comparison
NO

-Points-
-Rebounds-
-Assists-
-Field Goal %-
-3-Point %-
-Free Throw %-
Injury Report
New Orleans Pelicans
H2H / Season Series
Last 5 Games








NBA Standings
Western Conference — Southwest
| Team | W | L | PCT | GB | STRK |
|---|---|---|---|---|---|
 Memphis | 3 | 1 | .750 | - | W2 |
| New Orleans | 3 | 1 | .750 | - | W2 |
 Houston | 2 | 1 | .667 | 0.5 | W1 |
| San Antonio | 2 | 3 | .400 | 1.5 | W2 |
 Dallas | 1 | 3 | .250 | 2 | L2 |
Rosters
Spurs
4th in Western Conference Division
VS
Pelicans
10th in Western Conference Division
Forward
#1
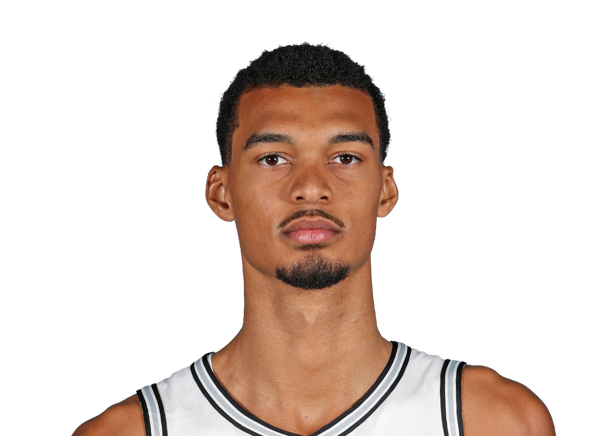
Victor Wembanyama
#30

Julian Champagnie
#3
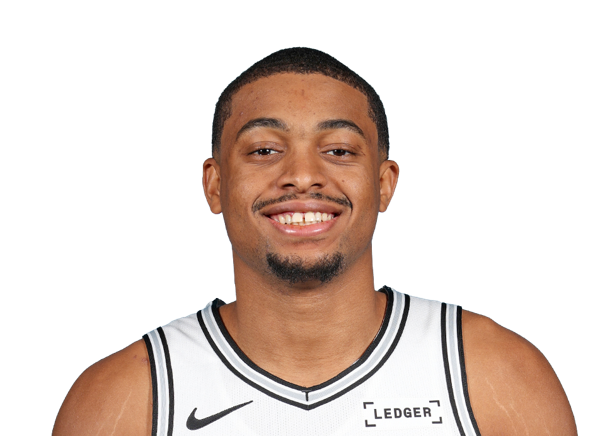
Keldon Johnson
#40

Harrison Barnes
#11
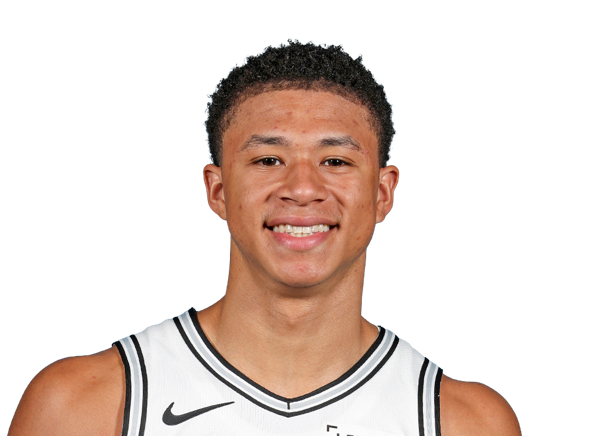
Carter Bryant
#25
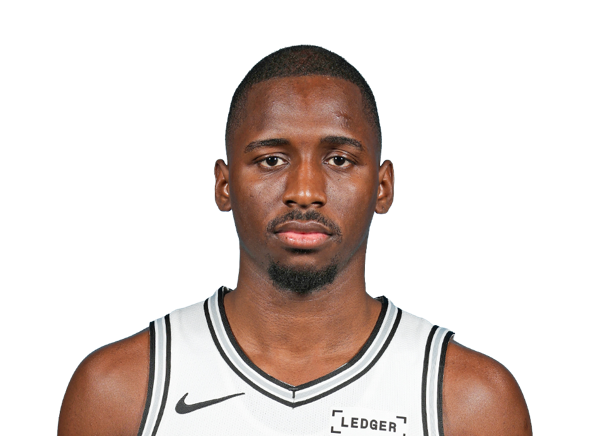
David Jones Garcia
#15
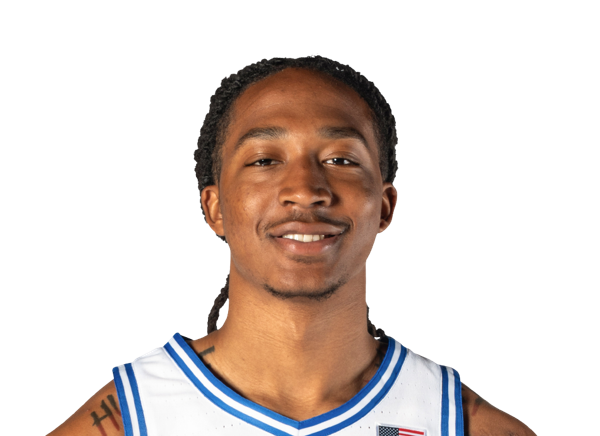
Maliq Brown
#23
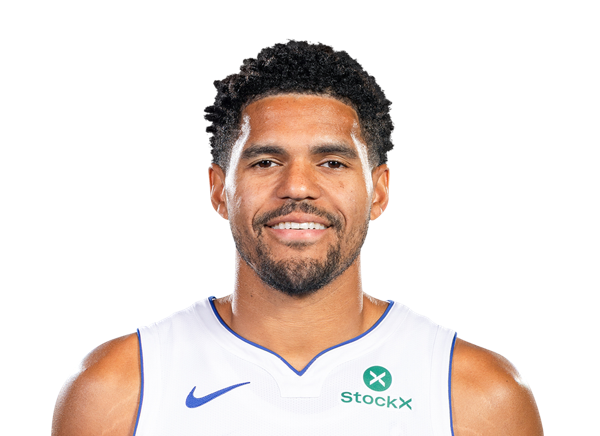
Tobias Harris
#22
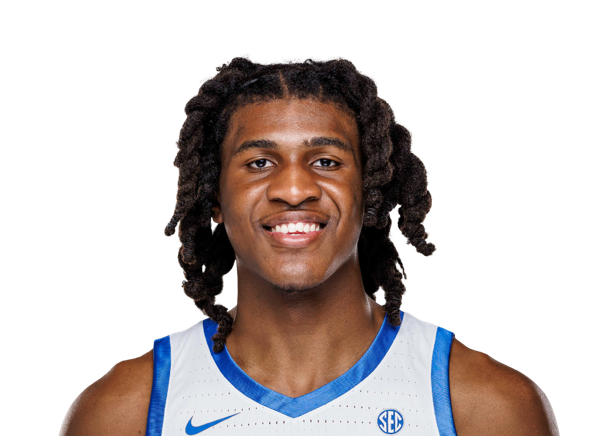
Jayden Quaintance
Guard
#2
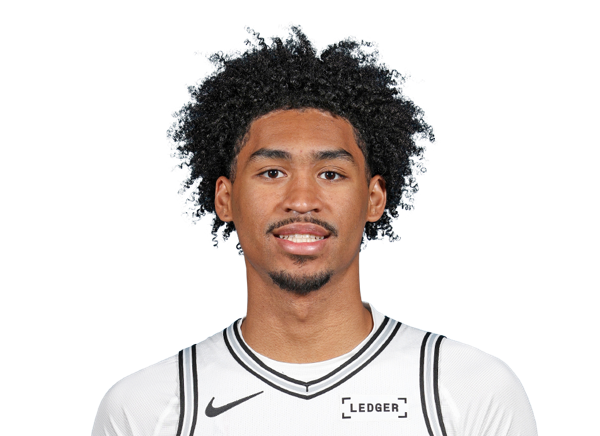
Dylan Harper
#4
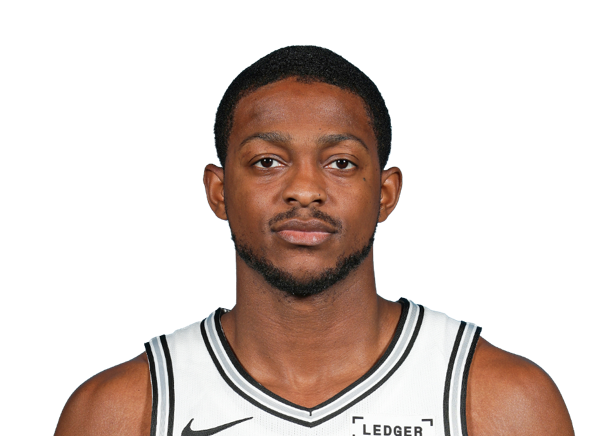
De'Aaron Fox
#5
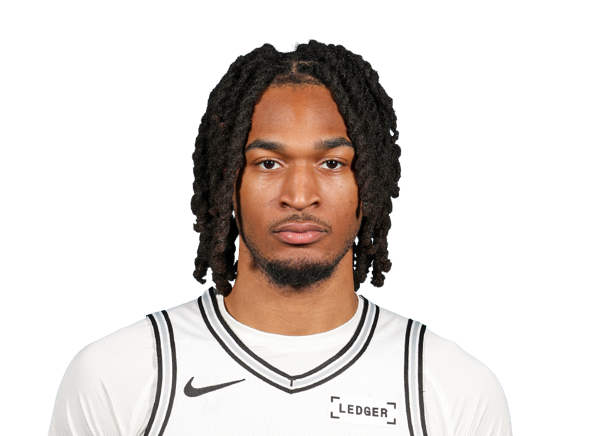
Stephon Castle
#24

Devin Vassell
#17
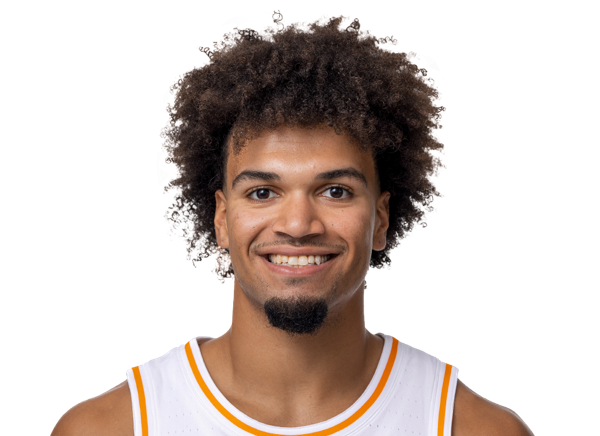
Ja'Kobi Gillespie
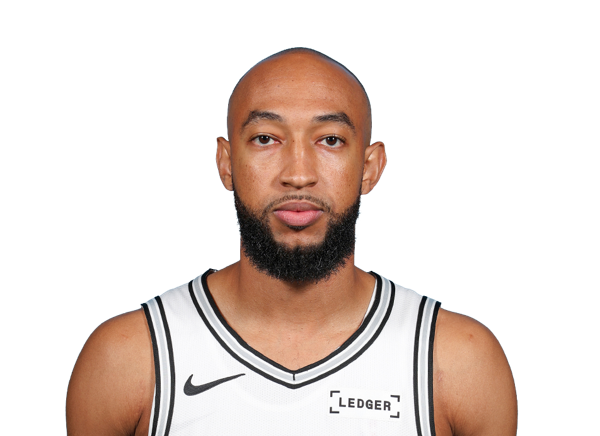
Jordan McLaughlin
Center
#7

Luke Kornet
#10
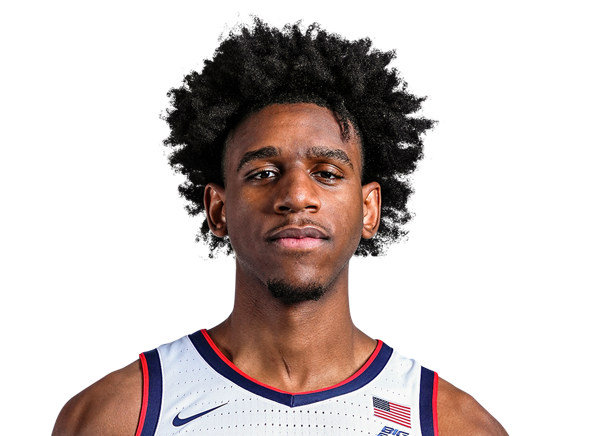
Tarris Reed Jr.
Forward
#1

Zion Williamson
#41
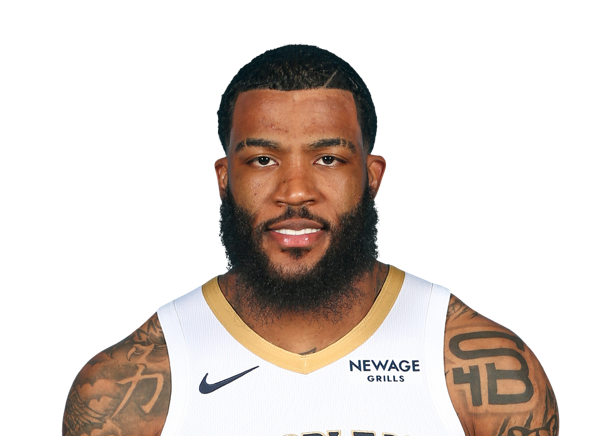
Saddiq Bey
#25

Trey Murphy III
#17

Karlo Matkovic
#2

Herbert Jones
#9
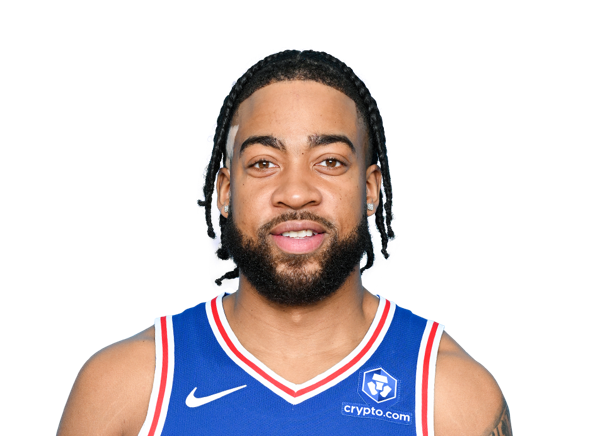
Trendon Watford
#13

Julian Reese
Guard
#5

Dejounte Murray

Jeremiah Fears
#24

Bennedict Mathurin
#3

Jordan Poole
#11

Bryce McGowens
#14
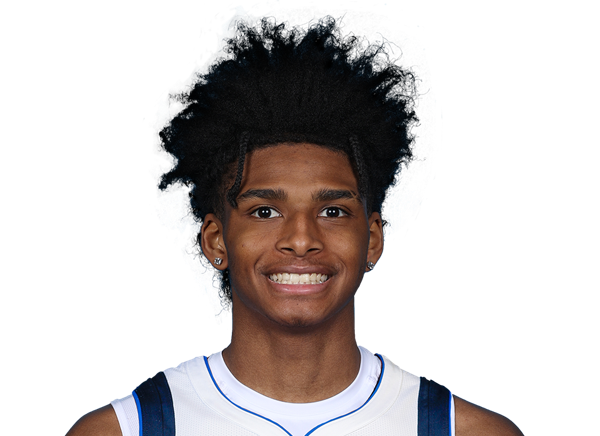
AJ Johnson
Center
#22
Derik Queen
#21

Yves Missi
#6

DeAndre Jordan
Team Statistics
Spurs
4th in Western Conference Division
VS
Pelicans
10th in Western Conference Division
General
48.5
Rebounds Per Game
44.9
2.1
Assist To Turnover Ratio
1.5
20.5
Fouls Per Game
23.0
8
Games Played
8
0
Games Started
0
0
Minutes
0
0.0
Minutes Per Game
0.0
388
Rebounds
359
388
Rebounds
359
Offensive
80.1
Free Throw Percentage
82.4
32.2
3-Point Field Goal Percentage
31.7
42.4
Average Field Goals Made
43.1
93.1
Average Field Goals Attempted
88.5
11.5
Average 3-Point Field Goals Made
9.0
35.8
Average 3-Point Field Goals Attempted
28.4
20.6
Average Free Throws Made
26.4
25.8
Average Free Throws Attempted
32.0
116.9
Points Per Game
121.6
13.1
Offensive Rebounds Per Game
10.9
26.5
Assists Per Game
25.4
12.6
Turnovers Per Game
16.8
53.8
2-Point Field Goal Percentage
56.8
1.255
Scoring Efficiency
1.374
0.52
Shooting Efficiency
0.54
45.5
Field Goal Percentage
48.7
247.0
2-Point Field Goals Made
273.0
459.0
2-Point Field Goals Attempted
481.0
935
Points
973
105
Offensive Rebounds
87
212
Assists
203
101
Turnovers
134
339
Field Goals Made
345
745
Field Goals Attempted
708
165
Free Throws Made
211
206
Free Throws Attempted
256
92
3-Point Field Goals Made
72
286
3-Point Field Goals Attempted
227
32.2
3-Point Field Goal Percentage
31.7
30.9
2-Point Field Goals Made per Game
34.1
57.4
2-Point Field Goals Attempted per Game
60.1
Defensive
35.4
Defensive Rebounds Per Game
34.0
7.4
Blocks Per Game
4.8
8.4
Steals Per Game
12.4
283
Defensive Rebounds
272
67
Steals
99
59
Blocks
38