

Suns vs Pacers Live Score (16 Jan, 2027)
Game Information
League
NBA
Season
1
Date
January 15, 2027
Tipoff
7:00 PM EST
Status
Scheduled
Team Stats
 PHX
Game Comparison
IND
-Points-
-Rebounds-
-Assists-
-Field Goal %-
-3-Point %-
-Free Throw %-
Injury Report
H2H / Season Series
Last 5 Games







NBA Standings
Western Conference — Pacific
| Team | W | L | PCT | GB | STRK |
|---|---|---|---|---|---|
 Golden State | 4 | 2 | .667 | - | W3 |
 LA Clippers | 2 | 1 | .667 | 0.5 | W1 |
 LA Lakers | 2 | 3 | .400 | 1.5 | L2 |
| Phoenix | 1 | 4 | .200 | 2.5 | L2 |
 Sacramento | 0 | 5 | .000 | 3.5 | L5 |

Rosters
Suns
3rd in Pacific Division
VS
Pacers
3rd in Central Division
Guard
#15
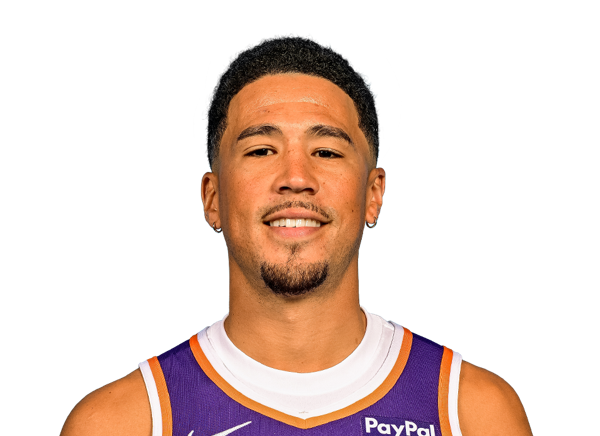
Devin Booker
#4

Jalen Green
#23

Jordan Goodwin
#12

Collin Gillespie
#8

Luke Kennard
#17

Jamaree Bouyea
#61
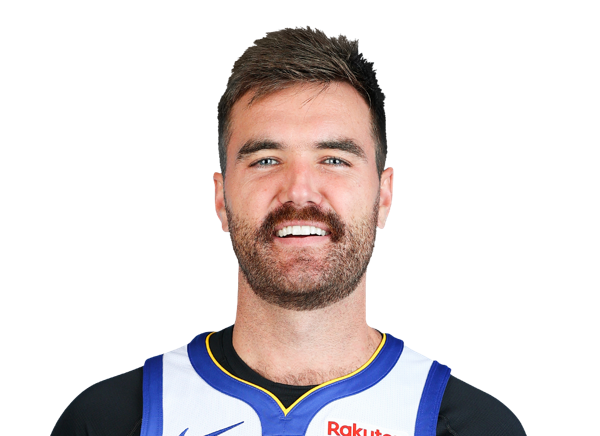
Pat Spencer
Forward
#22

Miles Bridges
#3

Dillon Brooks
#11
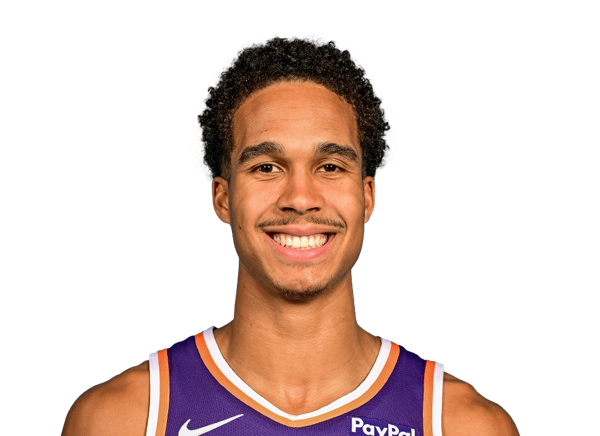
Oso Ighodaro

Ryan Dunn
#18

Koa Peat
#20

Rasheer Fleming
Center
#10
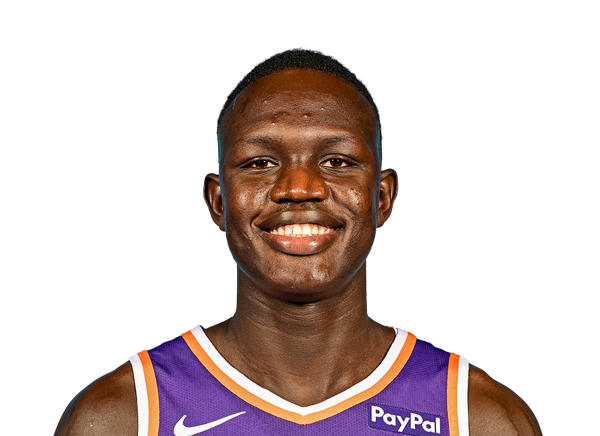
Khaman Maluach
#26

Duop Reath
#25

Mark Williams
Forward
#43

Pascal Siakam
#1

Obi Toppin
#5

Jarace Walker
#22

Larry Nance Jr.
#18

Jalen Slawson
Guard
#2

Andrew Nembhard
#23

Aaron Nesmith
#10

Kelly Oubre Jr.
#29

Quenton Jackson
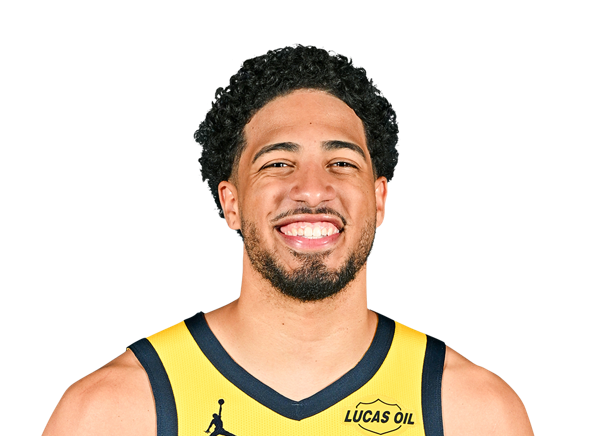
Tyrese Haliburton
#9

T.J. McConnell
#24

Kobe Brown
#3

Braden Smith
#26
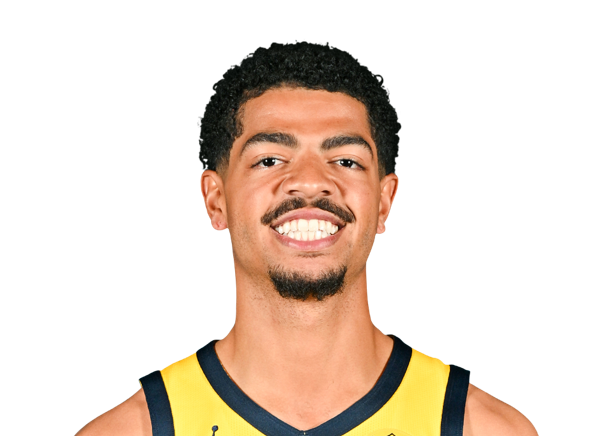
Ben Sheppard
#12

Johnny Furphy
Center
#40

Ivica Zubac
#32

Jay Huff
Team Statistics
Suns
3rd in Pacific Division
VS
Pacers
3rd in Central Division
General
39.2
Rebounds Per Game
41.6
2.0
Assist To Turnover Ratio
2.0
22.1
Fouls Per Game
20.4
12
Games Played
14
0
Games Started
0
0
Minutes
0
0.0
Minutes Per Game
0.0
470
Rebounds
583
470
Rebounds
583
Offensive
78.0
Free Throw Percentage
76.5
36.0
3-Point Field Goal Percentage
32.8
41.4
Average Field Goals Made
40.9
88.8
Average Field Goals Attempted
87.1
13.6
Average 3-Point Field Goals Made
11.9
37.8
Average 3-Point Field Goals Attempted
36.1
16.3
Average Free Throws Made
18.4
20.8
Average Free Throws Attempted
24.0
112.7
Points Per Game
112.1
10.9
Offensive Rebounds Per Game
9.6
27.3
Assists Per Game
27.8
13.4
Turnovers Per Game
13.8
54.6
2-Point Field Goal Percentage
57.1
1.269
Scoring Efficiency
1.287
0.54
Shooting Efficiency
0.54
46.7
Field Goal Percentage
47.0
334.0
2-Point Field Goals Made
407.0
612.0
2-Point Field Goals Attempted
713.0
1352
Points
1569
131
Offensive Rebounds
135
328
Assists
389
161
Turnovers
193
497
Field Goals Made
573
1065
Field Goals Attempted
1219
195
Free Throws Made
257
250
Free Throws Attempted
336
163
3-Point Field Goals Made
166
453
3-Point Field Goals Attempted
506
36.0
3-Point Field Goal Percentage
32.8
27.8
2-Point Field Goals Made per Game
29.1
51.0
2-Point Field Goals Attempted per Game
50.9
Defensive
28.3
Defensive Rebounds Per Game
32.0
4.4
Blocks Per Game
4.2
8.0
Steals Per Game
7.2
339
Defensive Rebounds
448
96
Steals
101
53
Blocks
59