

Warriors vs Pacers Live Score (17 Dec, 2026)
Game Information
League
NBA
Season
1
Date
December 16, 2026
Tipoff
7:00 PM EST
Status
Scheduled
Team Stats
 GS
Game Comparison
IND
-Points-
-Rebounds-
-Assists-
45Field Goal %47
-3-Point %-
-Free Throw %-
Game Leaders
GSIND
 —#
Points
—
—#
—#
Rebounds
—
—#
—#
Assists
—
—#
Injury Report
Golden State Warriors
Indiana Pacers
H2H / Season Series
Last 5 Games








NBA Standings
Western Conference — Pacific
| Team | W | L | PCT | GB | STRK |
|---|---|---|---|---|---|
 LA Lakers | 13 | 3 | .813 | - | L1 |
| Golden State | 8 | 8 | .500 | 5 | L5 |
 Phoenix | 7 | 7 | .500 | 5 | W2 |
 LA Clippers | 4 | 10 | .286 | 8 | L2 |
 Sacramento | 1 | 13 | .071 | 11 | L7 |




Rosters
Warriors
3rd in Pacific Division
VS
Pacers
3rd in Central Division
Guard
#30

Stephen Curry
#2
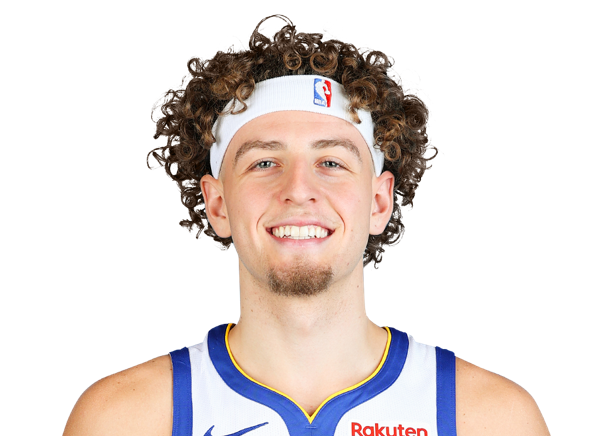
Brandin Podziemski
#12
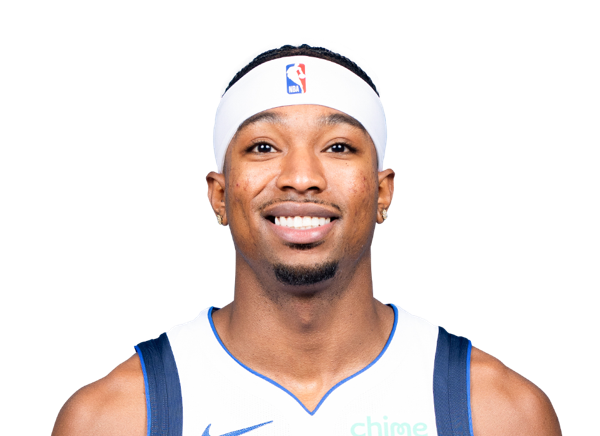
Brandon Williams
#8
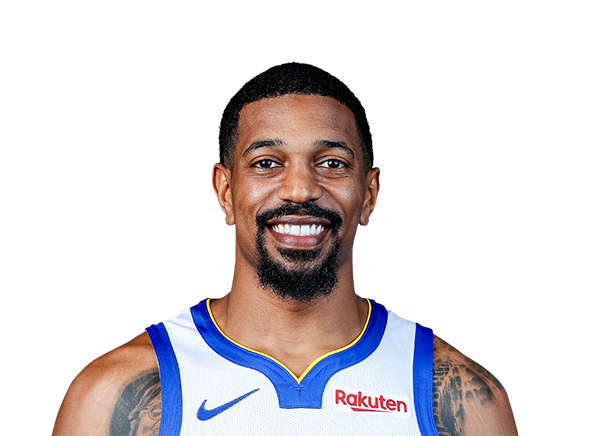
De'Anthony Melton
#3

Will Richard
#18

LJ Cryer
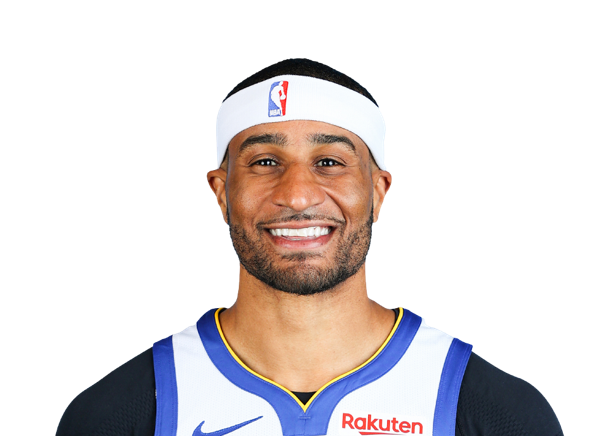
Gary Payton II
#4
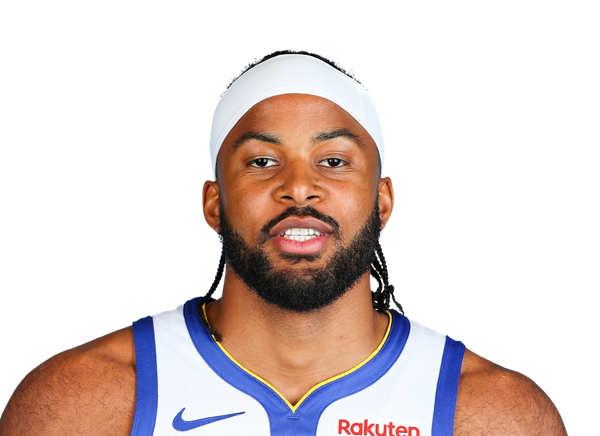
Moses Moody
Forward
#1

Yaxel Lendeborg
#32
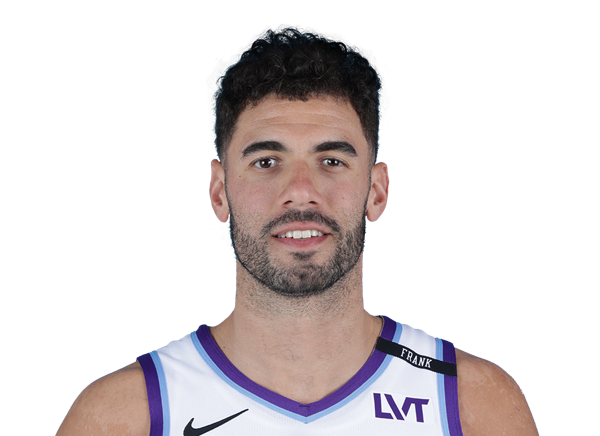
Georges Niang
#15
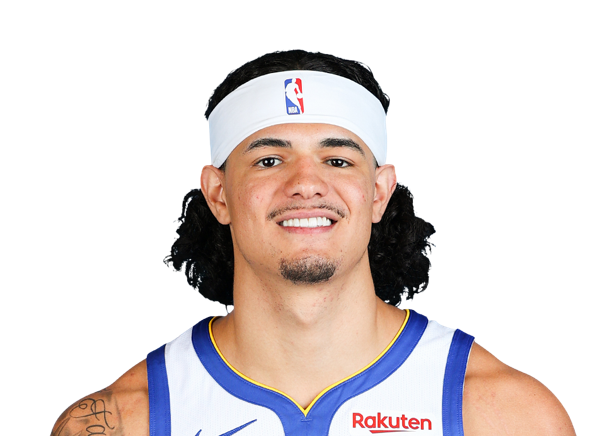
Gui Santos
#45
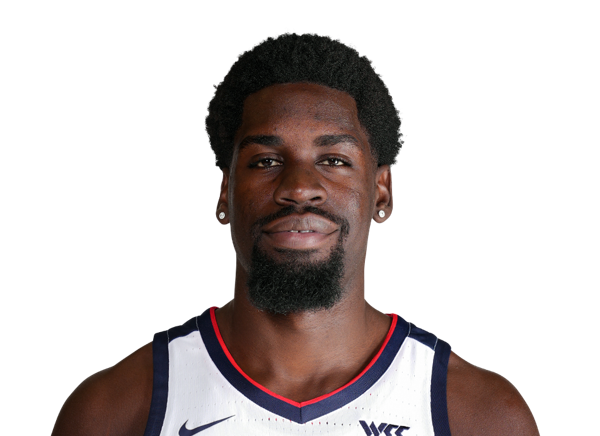
Graham Ike
#23
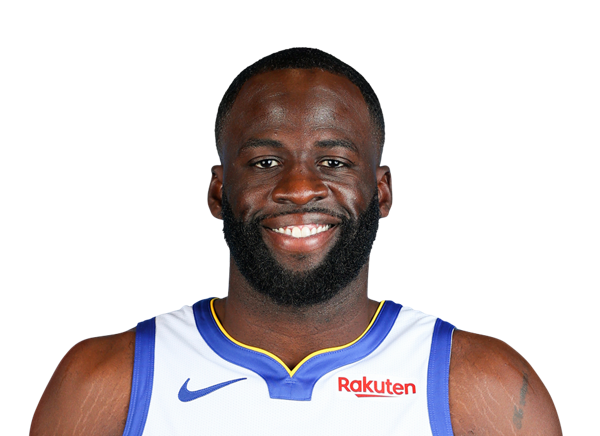
Draymond Green
#33

Malevy Leons
#10
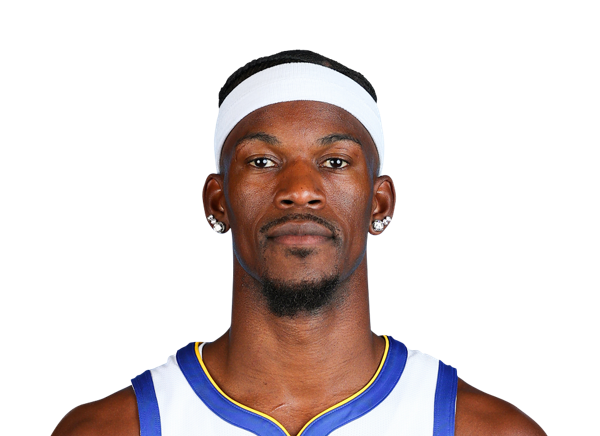
Jimmy Butler III
Center
#28

Charles Bassey
#20
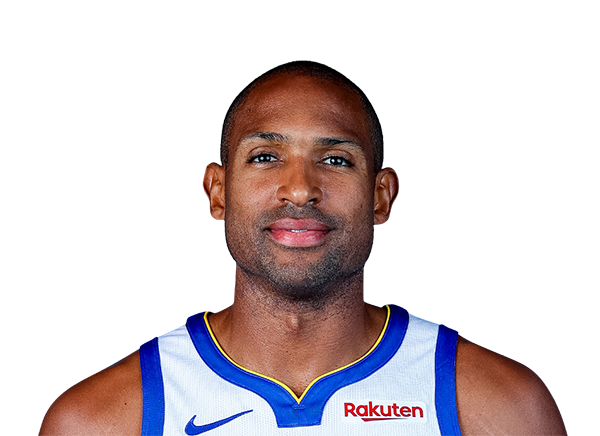
Al Horford
#7
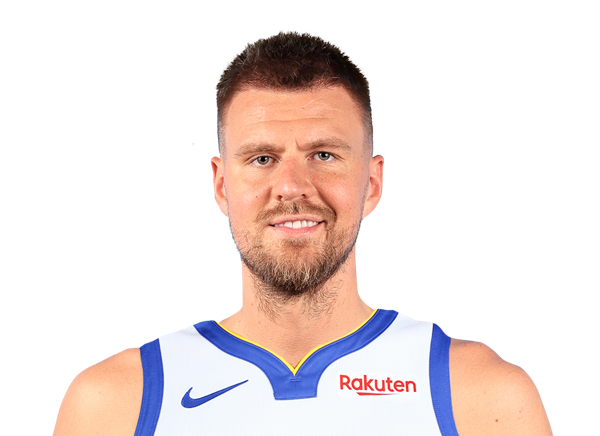
Kristaps Porzingis
Forward
#43

Pascal Siakam
#1
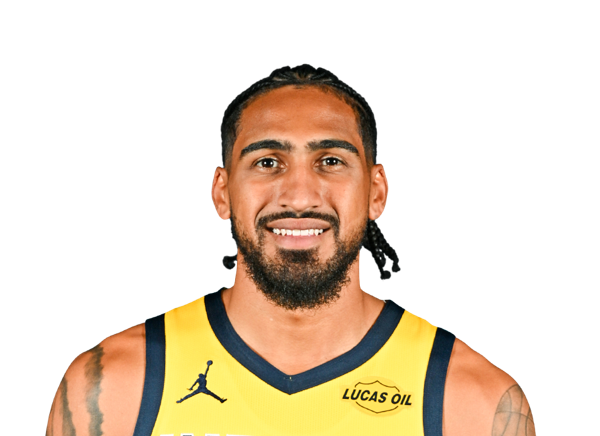
Obi Toppin
#5
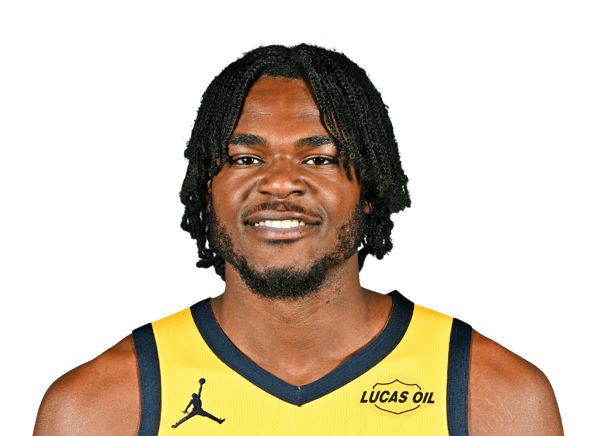
Jarace Walker
#22
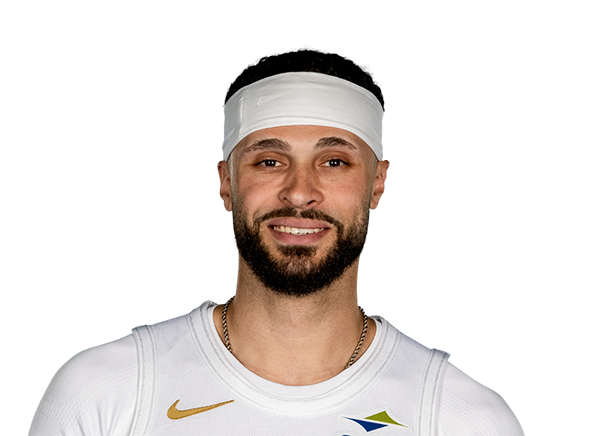
Larry Nance Jr.
#18

Jalen Slawson
Guard
#2

Andrew Nembhard
#10

Kelly Oubre Jr.
#23

Aaron Nesmith
#29
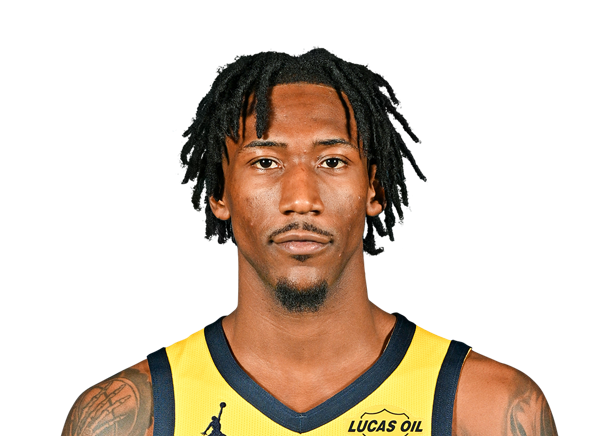
Quenton Jackson
#3

Braden Smith
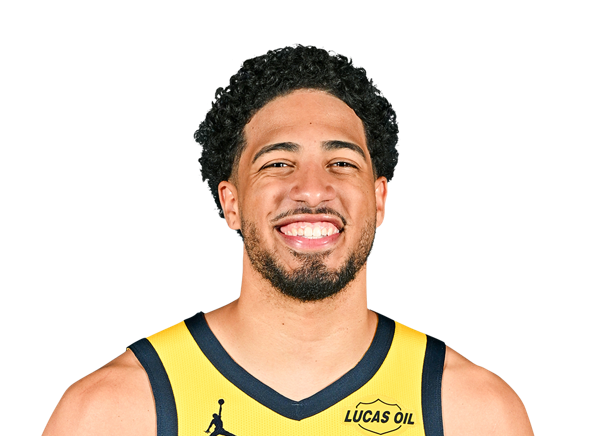
Tyrese Haliburton
#9

T.J. McConnell
#24

Kobe Brown
#26
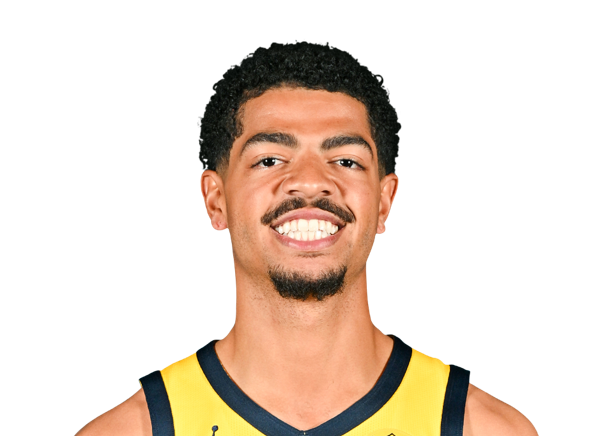
Ben Sheppard
#12

Johnny Furphy
Center
#40

Ivica Zubac
#32

Jay Huff
Team Statistics
Warriors
3rd in Pacific Division
VS
Pacers
3rd in Central Division
General
44.1
Rebounds Per Game
41.8
1.7
Assist To Turnover Ratio
2.1
21.9
Fouls Per Game
20.1
16
Games Played
16
0
Games Started
0
0
Minutes
0
0.0
Minutes Per Game
0.0
705
Rebounds
668
705
Rebounds
668
Offensive
80.7
Free Throw Percentage
76.1
36.4
3-Point Field Goal Percentage
33.1
38.7
Average Field Goals Made
41.2
86.5
Average Field Goals Attempted
87.2
14.9
Average 3-Point Field Goals Made
11.9
40.9
Average 3-Point Field Goals Attempted
35.9
20.4
Average Free Throws Made
17.8
25.3
Average Free Throws Attempted
23.3
112.7
Points Per Game
112.0
12.9
Offensive Rebounds Per Game
9.4
27.1
Assists Per Game
28.1
15.8
Turnovers Per Game
13.6
52.2
2-Point Field Goal Percentage
57.1
1.303
Scoring Efficiency
1.285
0.53
Shooting Efficiency
0.54
44.7
Field Goal Percentage
47.2
381.0
2-Point Field Goals Made
469.0
730.0
2-Point Field Goals Attempted
821.0
1803
Points
1792
207
Offensive Rebounds
151
433
Assists
449
253
Turnovers
218
619
Field Goals Made
659
1384
Field Goals Attempted
1395
327
Free Throws Made
284
405
Free Throws Attempted
373
238
3-Point Field Goals Made
190
654
3-Point Field Goals Attempted
574
36.4
3-Point Field Goal Percentage
33.1
23.8
2-Point Field Goals Made per Game
29.3
45.6
2-Point Field Goals Attempted per Game
51.3
Defensive
31.1
Defensive Rebounds Per Game
32.3
5.7
Blocks Per Game
4.7
8.5
Steals Per Game
7.5
498
Defensive Rebounds
517
136
Steals
120
91
Blocks
75