

St. Louis Blues vs Los Angeles Kings Live Score (14 Jan, 2027)
Game Information
Stage
Regular Season
Season
2027
Puck Drop
Wed, Jan 13, 10:00 PM
Venue
crypto.com Arena
Location
Los Angeles, CA
Injury Report
 Los Angeles Kings
Head-to-Head
 STL
Last 3 Games
LA
1
NHL Regular Season
FINAL
Apr 1, 2026
▸2
4
NHL Regular Season
FINAL
Jan 24, 2026
▸5
1
NHL Regular Season
FINAL
Oct 21, 2025
▸2
Last 5 Games









Division Standings
Western Conference — Central Division












Blues
10th in Western Conference
VS
Kings
14th in Western Conference
Goaltenders
#50
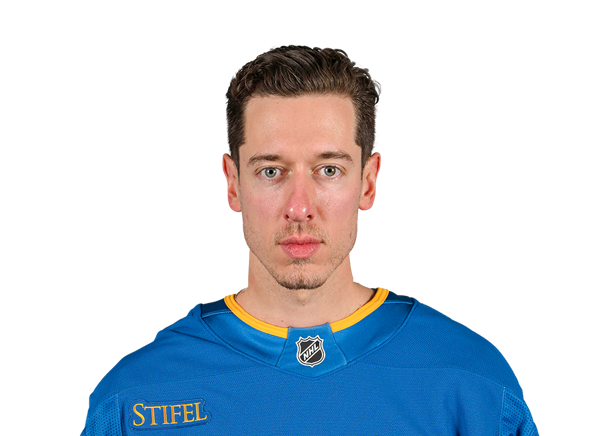
Jordan Binnington
#30
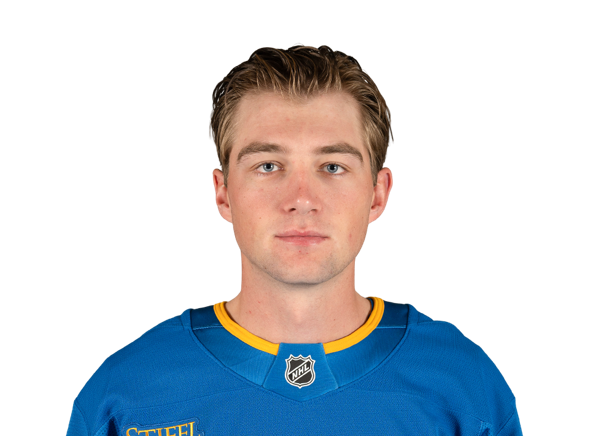
Joel Hofer
Defensemen
#72
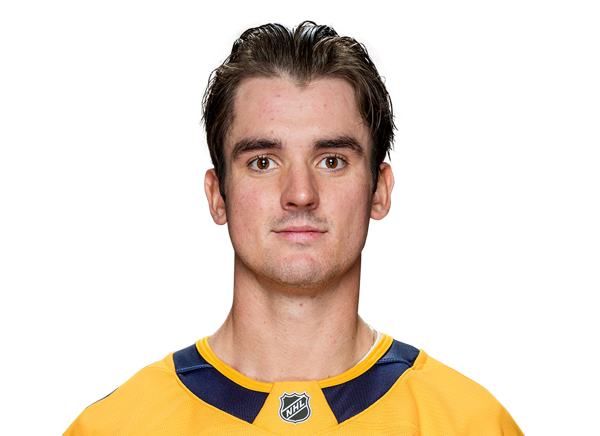
Justin Barron
#6
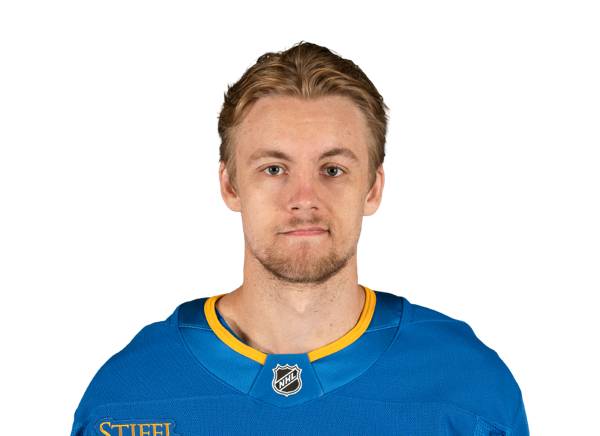
Philip Broberg
#42
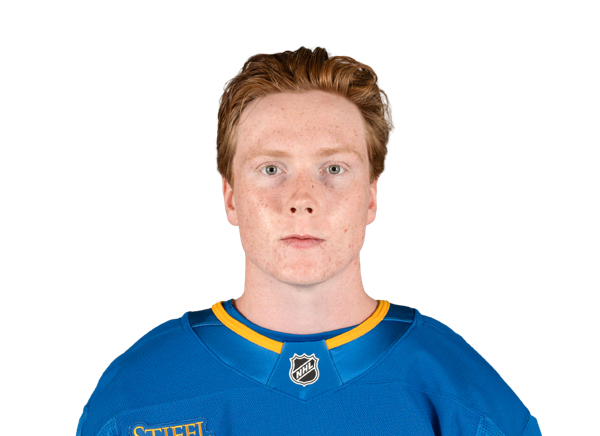
Quinton Burns
#25
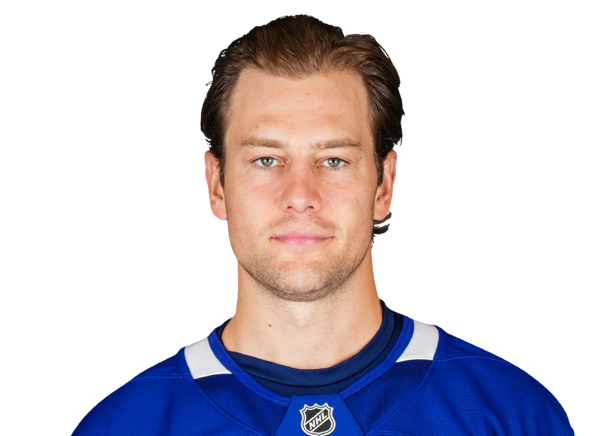
Brandon Carlo
#17
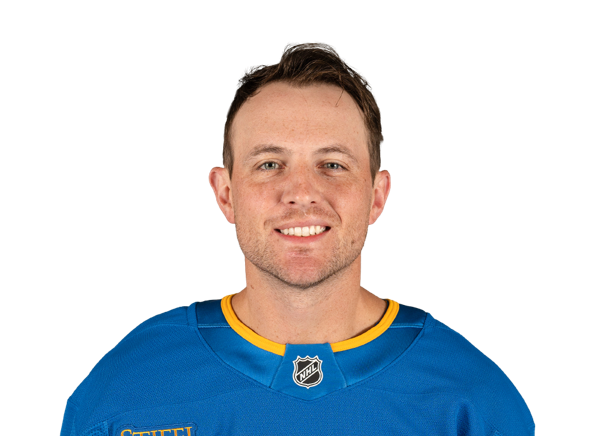
Cam Fowler
#36

Adam Jiricek
#4
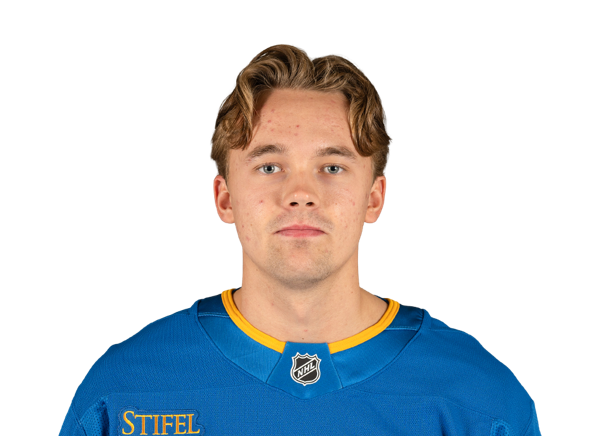
Theo Lindstein
#23
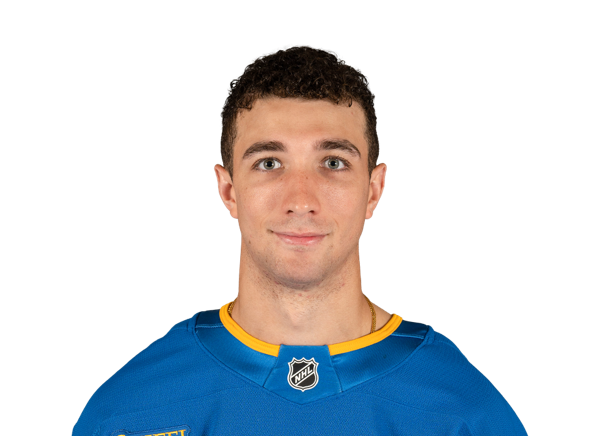
Logan Mailloux
#55
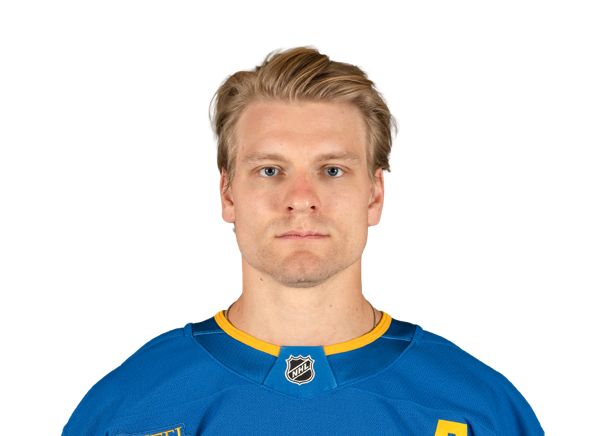
Colton Parayko
#75
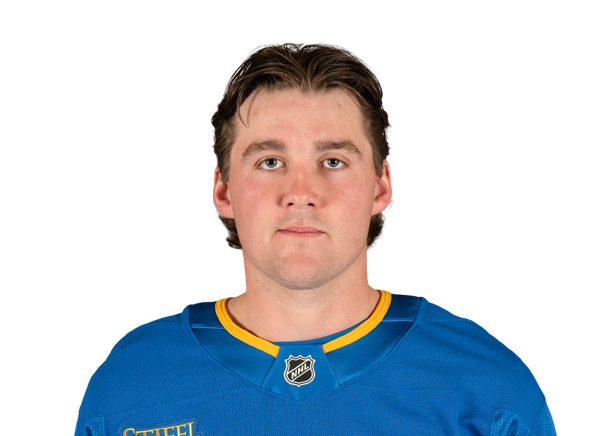
Tyler Tucker
Left Wings
#89

Pavel Buchnevich
#81
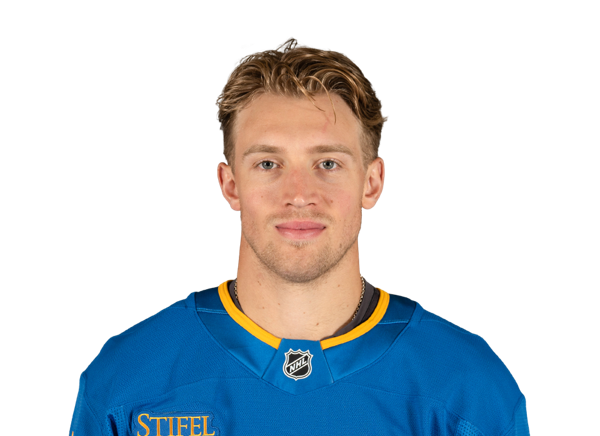
Dylan Holloway
#49
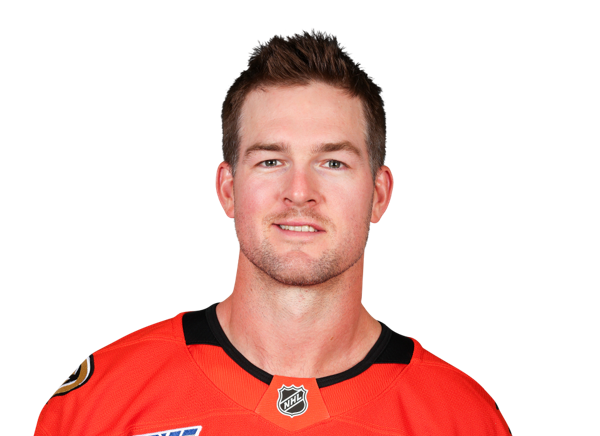
Ross Johnston
#77

Connor McMichael
#63
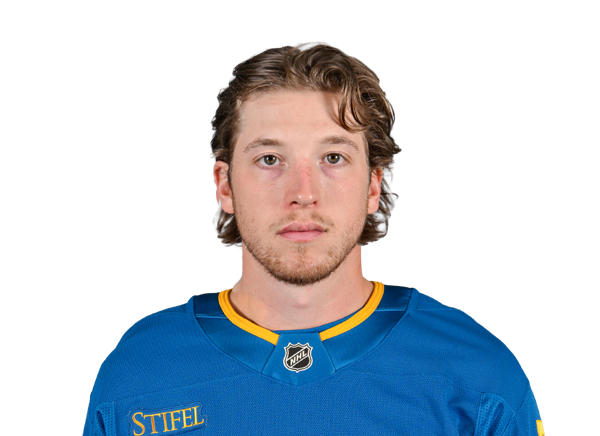
Jake Neighbours
Centers
#52
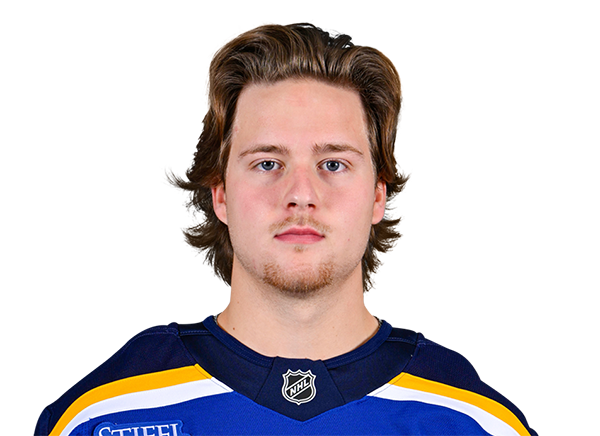
Zach Dean
#65
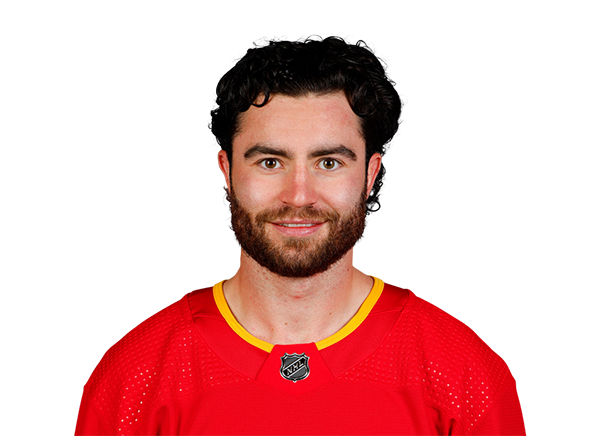
Dillon Dube
#84

Adam Jecho
#41
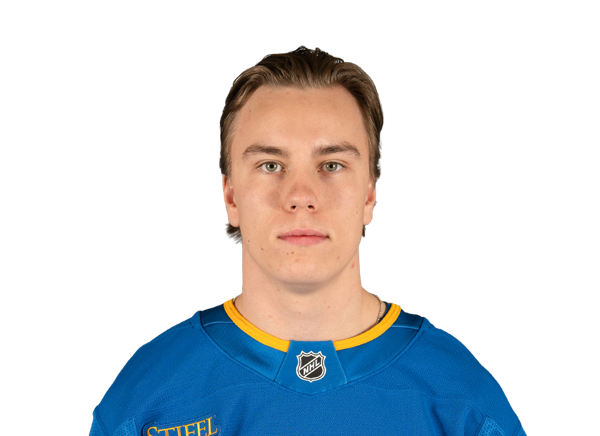
Aleksanteri Kaskimaki
#83

Mason McTavish
#28
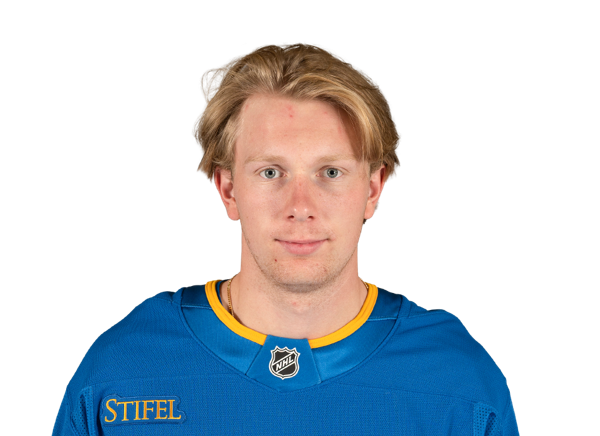
Otto Stenberg
#22

Pius Suter
#18

Robert Thomas
Right Wings
#29
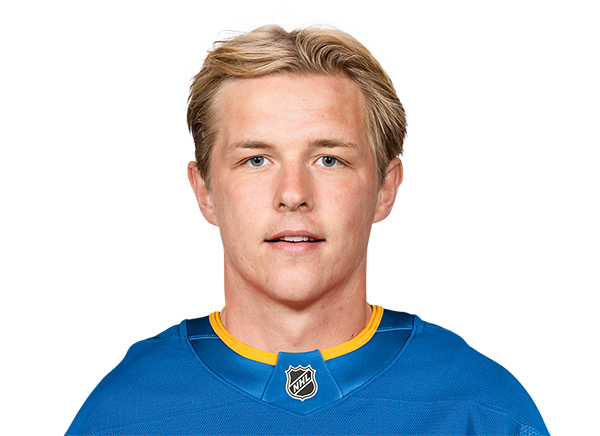
Jonatan Berggren
#15
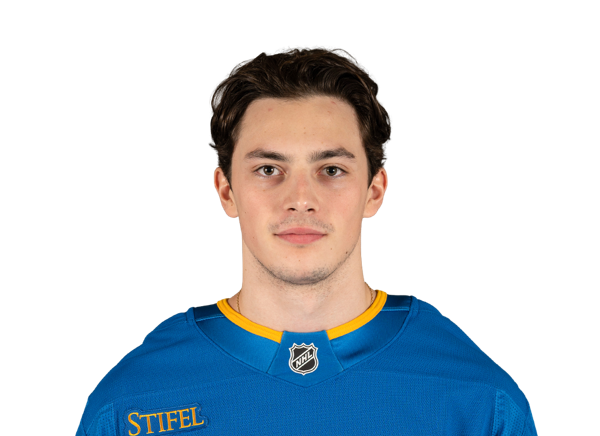
Dalibor Dvorsky
#21
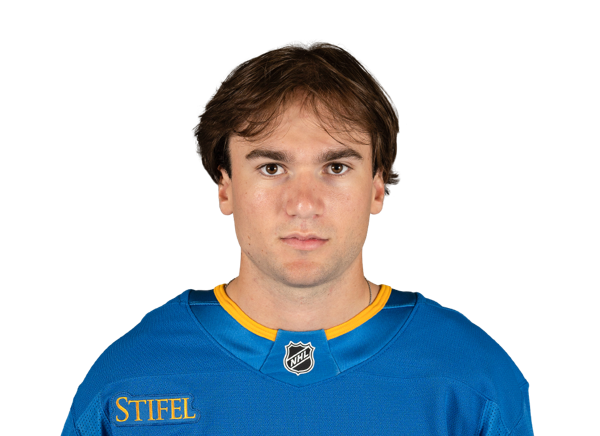
Jimmy Snuggerud
#13
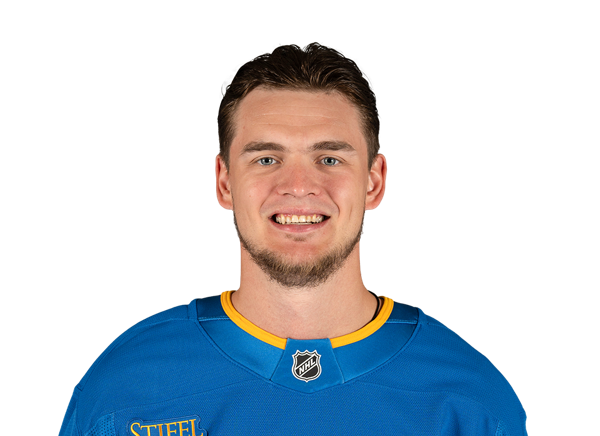
Alexey Toropchenko
Goaltenders
#31
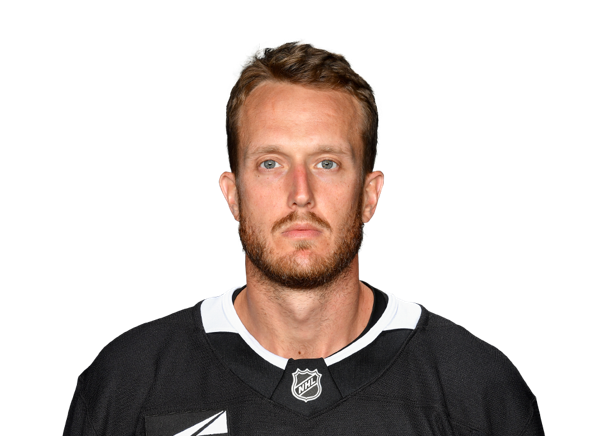
Anton Forsberg
#35
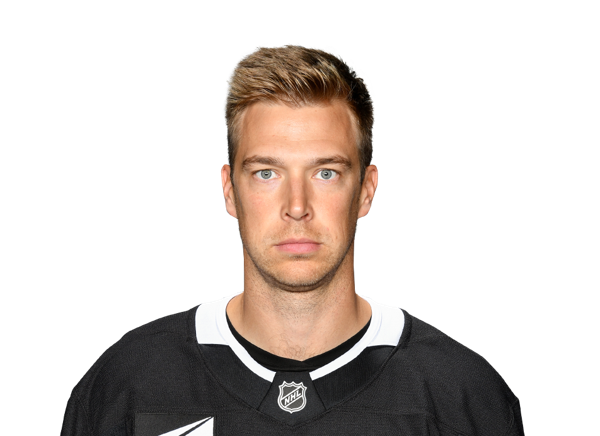
Darcy Kuemper
Defensemen
#44

Mikey Anderson
#5
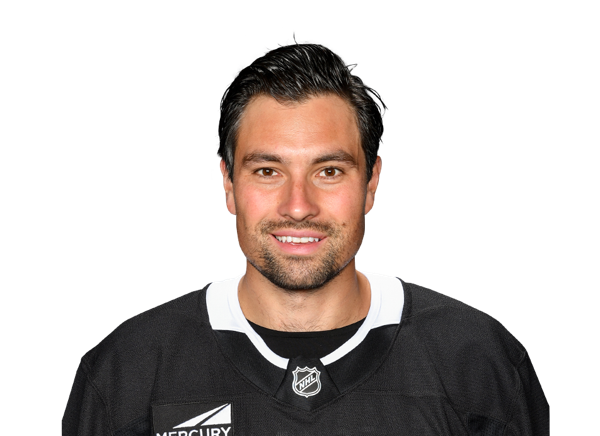
Cody Ceci
#92
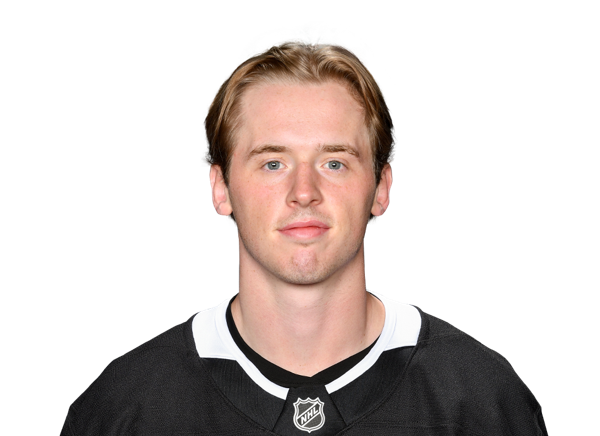
Brandt Clarke
#8
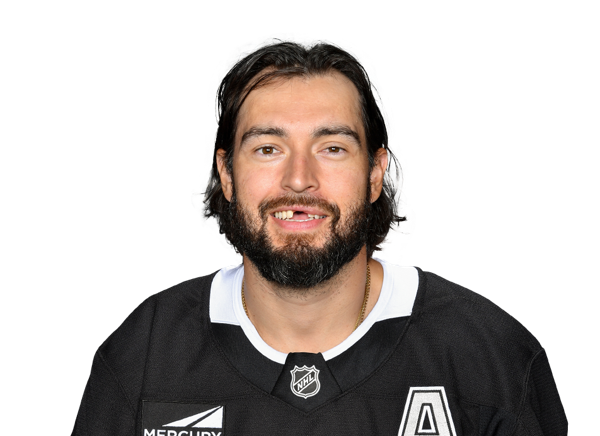
Drew Doughty
#2
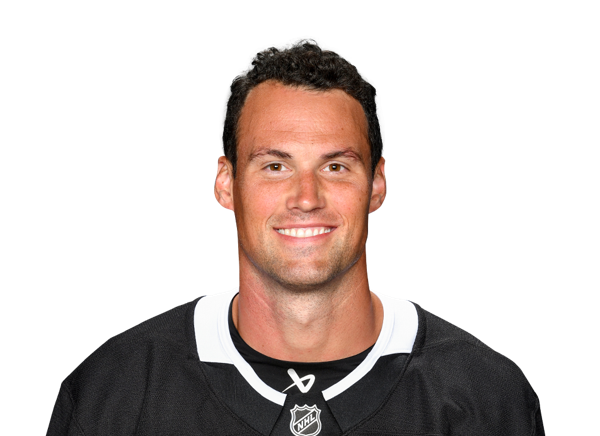
Brian Dumoulin
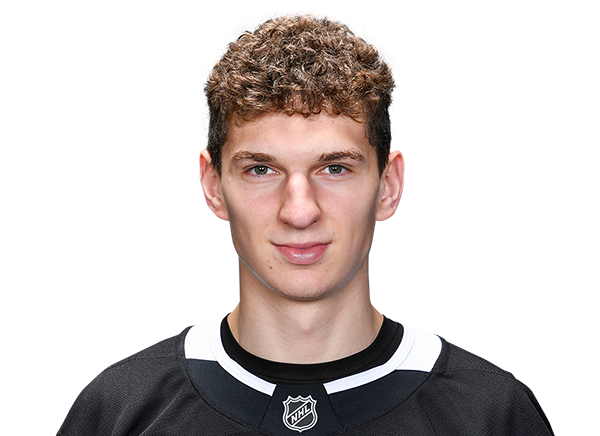
Jakub Dvorak
#6
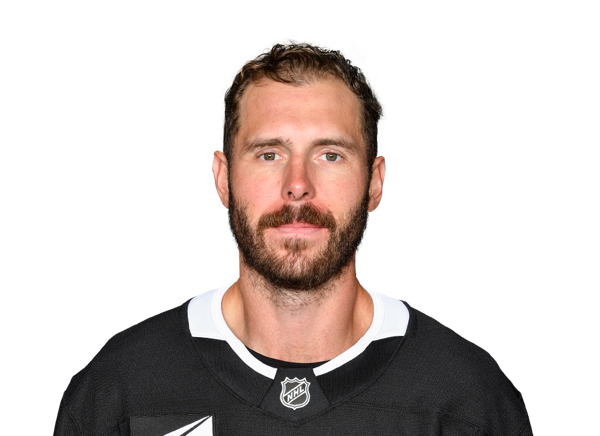
Joel Edmundson
#64

Erik Gustafsson
Left Wings
#22
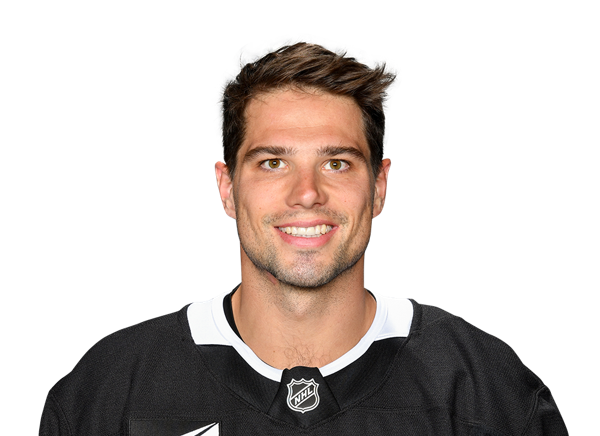
Kevin Fiala
#56
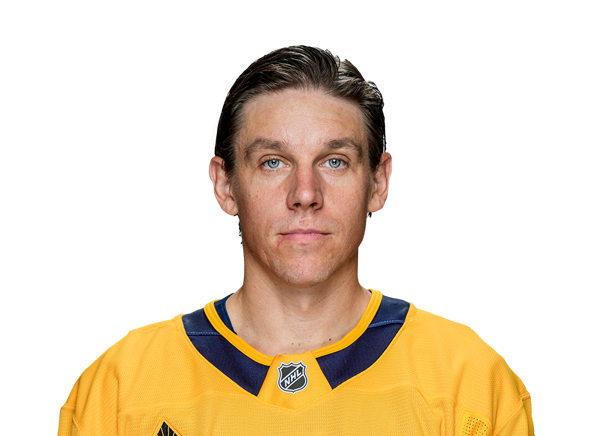
Erik Haula
#47

Andre Lee
#12
Trevor Moore
#10
Artemi Panarin
Centers
#34

Kenny Connors
#79
Samuel Helenius

Jan Jenik
#21
Scott Laughton
#15

Alex Turcotte
Right Wings
#40
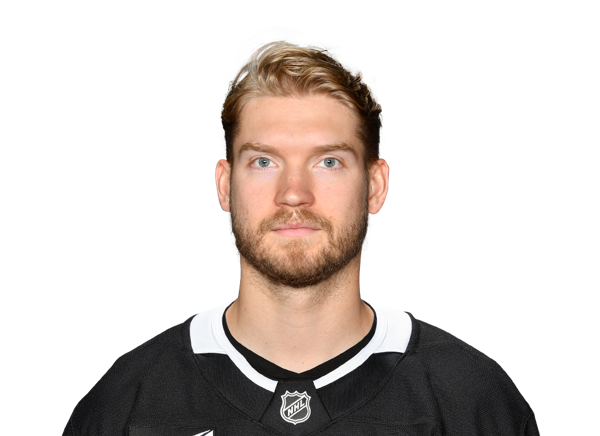
Joel Armia
#55

Quinton Byfield
#42
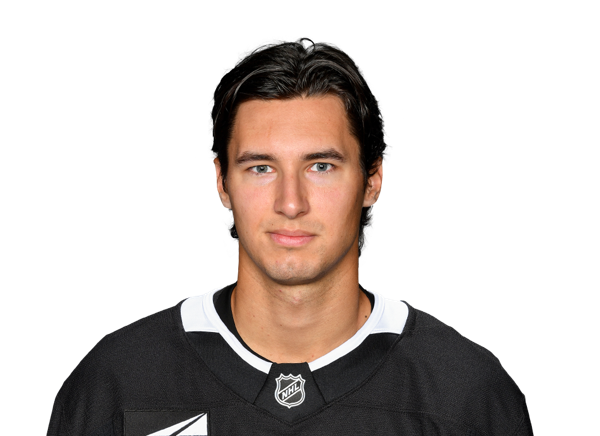
Martin Chromiak
#9
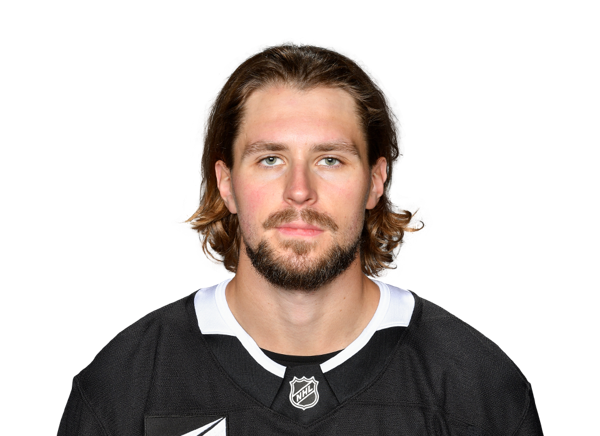
Adrian Kempe
#14

Alex Laferriere
#90
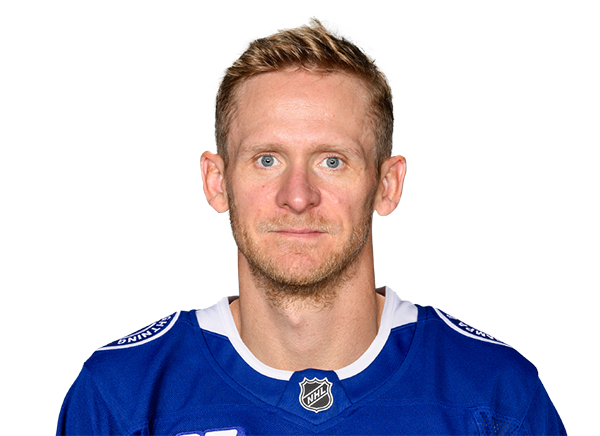
Corey Perry
#36
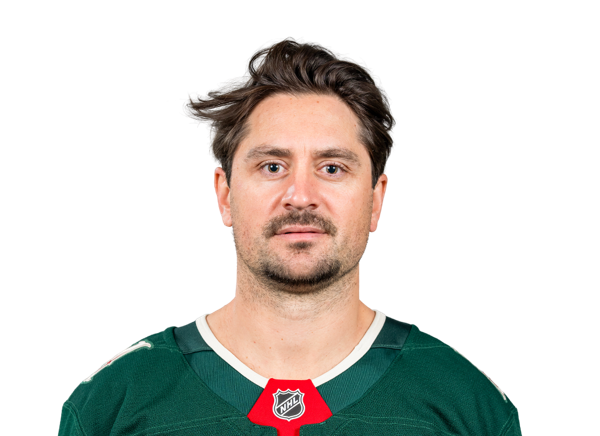
Mats Zuccarello
Blues
6th in Central Division
VS
Kings
7th in Pacific Division
General
16
Games Played
14
5683:14
Time On Ice
5005:48
355:12
Time On Ice Per Game
357:33
0
Plus/Minus Rating
0
0:00
Production
0:00
6124
Shifts
5281
7
Losses
7
7
Wins
5
Offensive
49
Goals
43
84
Assists
70
472
Faceoffs Won
402
486
Faceoffs Lost
388
0
Game-Winning Goals
0
133
Points
113
10
Power Play Goals
11
20
Power Play Assists
18
3
Short Handed Goals
2
3
Short Handed Assists
3
435
Shots
390
0
Shootout Attempts
0
0
Shootout Goals
0
0.0
Shootout Shot Percentage
0.0
11.3
Shooting Percentage
11.0
49.3
Faceoff Win Percent
50.9
Defensive
3.13
Goals Against Average
3.36
410
Saves
353
.897
Save Percentage
.891
50
Goals Against
47
460
Shots Against
400
2
Overtime Losses
2
0
Shootout Saves
0
0
Shootout Shots Against
0
.000
Shootout Save Percentage
.000
Penalties
119
Penalty Minutes
151