

Capitals vs Flyers Live Score (17 Apr, 2021)
Score by Period
| Team | 1st | 2nd | 3rd | Total |
|---|---|---|---|---|
 WSH | 1 | 3 | 2 | 6 |
 PHI | 1 | 1 | 1 | 3 |
Play-by-Play
3rd Period 20:00
6–3
3rd Period 20:00
6–3
3rd Period 19:41
6–3
3rd Period 19:40
6–3
3rd Period 19:30
6–3
3rd Period 19:30
6–3
3rd Period 19:22
6–3
3rd Period 19:18
6–3
3rd Period 19:01
6–3
3rd Period 19:00
6–3
3rd Period 19:00
6–3
3rd Period 18:48
6–3
3rd Period 18:48
6–3
3rd Period 18:17
5–3
3rd Period 18:15
5–3
3rd Period 17:47
5–3
3rd Period 17:47
5–3
3rd Period 17:40
5–3
3rd Period 17:40
5–3
3rd Period 17:38
5–3
3rd Period 17:12
5–3
3rd Period 17:12
5–3
3rd Period 17:01
5–3
3rd Period 17:01
5–3
Scoring Summary
1st Period
3:38
Alex Ovechkin
Assists: John Carlson, Evgeny Kuznetsov
1 - 0
19:59
Ivan Provorov
Assists: Joel Farabee, Claude Giroux
1 - 1
2nd Period
0:33
Dmitry Orlov
Assists: Alex Ovechkin, John Carlson
2 - 1
5:28
James van Riemsdyk
Assists: Nicolas Aube-Kubel
2 - 2
6:15
Alex Ovechkin
Assists: Evgeny Kuznetsov, John Carlson
3 - 2
15:02
Evgeny Kuznetsov
Assists: Tom Wilson, John Carlson
4 - 2
3rd Period
7:02
Wade Allison
Assists: Claude Giroux, Kevin Hayes
4 - 3
9:15
Conor Sheary
Assists: Justin Schultz, Lars Eller
5 - 3
18:48
Anthony Mantha
6 - 3
Team Stats
WSH
PHI

12
Blocked Shots
15
17
Hits
24
5
Takeaways
4
5
Giveaways
9
2
Power Play Goals
1
5
Power Play Opportunities
4
41
Total Shots
25
8
Penalty Minutes
10
40.0
Power Play %
25.0
0
Short Handed Goals
0
0
Shootout Goals
0
24
Faceoffs Won
37
39.3
Faceoff Percent
60.7
4
Penalties
5
Game Leaders
WSH
PHI
Player Box Score
Capitals| Player | BS | HT | TK | +/- | TOI | PPTOI | SHTOI | ESTOI | SHFT | G | YTDG | A | S | SM | SOG | FW | FL | FO% | GV | PN | PIM |
|---|---|---|---|---|---|---|---|---|---|---|---|---|---|---|---|---|---|---|---|---|---|
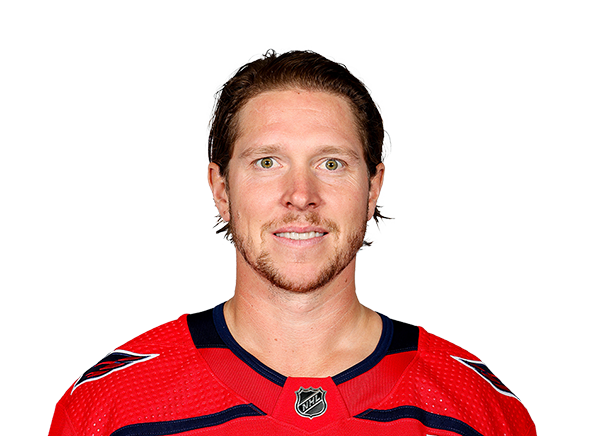 Nicklas Backstrom#19 · C | 0 | 0 | 2 | 0 | 17:44 | 5:03 | 0:00 | 12:41 | 20 | 0 | 14 | 0 | 3 | 0 | 0 | 6 | 4 | 60.0 | 0 | 0 | 0 |
 Nic Dowd#26 · C | 1 | 5 | 0 | 0 | 12:51 | 0:00 | 2:41 | 10:10 | 17 | 0 | 8 | 0 | 2 | 0 | 0 | 2 | 9 | 18.2 | 0 | 0 | 0 |
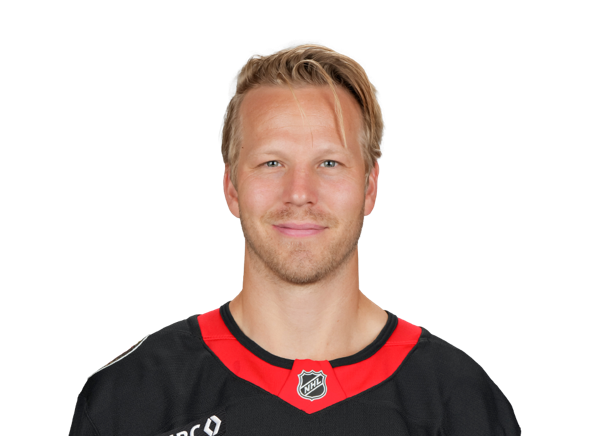 Lars Eller#20 · C | 0 | 0 | 0 | -1 | 12:37 | 0:00 | 3:14 | 9:23 | 18 | 0 | 7 | 1 | 1 | 2 | 0 | 6 | 5 | 54.5 | 1 | 0 | 0 |
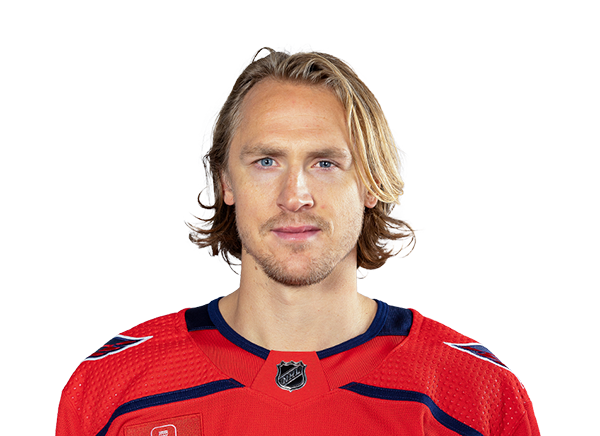 Carl Hagelin#62 · LW | 0 | 1 | 0 | 0 | 14:20 | 0:00 | 4:17 | 10:03 | 18 | 0 | 5 | 0 | 2 | 0 | 0 | 0 | 0 | 0.0 | 0 | 0 | 0 |
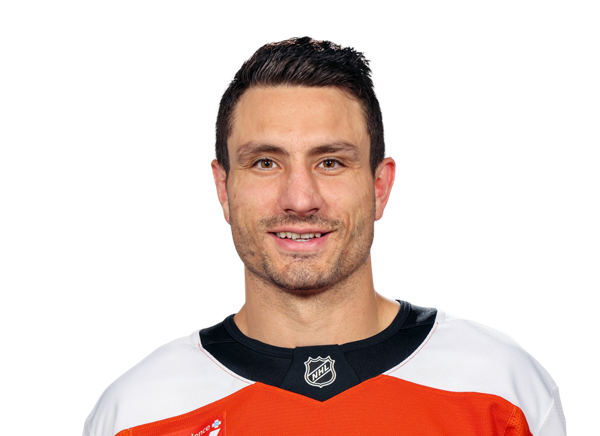 Garnet Hathaway#21 · RW | 1 | 2 | 0 | 0 | 12:33 | 0:00 | 2:39 | 9:54 | 17 | 0 | 4 | 0 | 1 | 1 | 0 | 1 | 0 | 100.0 | 0 | 0 | 0 |
 Evgeny Kuznetsov#92 · C | 1 | 0 | 0 | 3 | 17:30 | 5:03 | 0:00 | 12:27 | 20 | 1 | 8 | 2 | 1 | 0 | 0 | 6 | 12 | 33.3 | 2 | 1 | 2 |
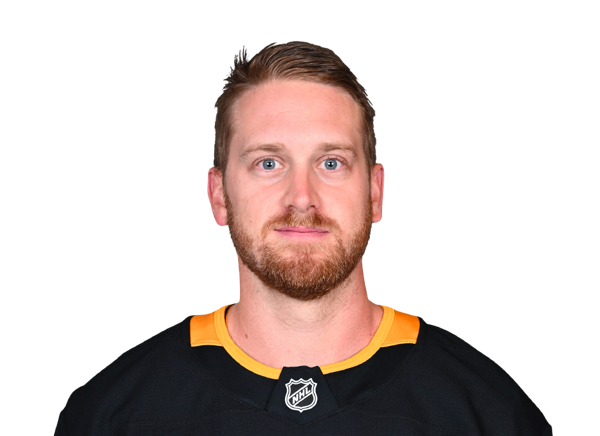 Anthony Mantha#39 · RW | 1 | 1 | 0 | 1 | 15:26 | 1:57 | 0:00 | 13:29 | 19 | 1 | 14 | 0 | 3 | 0 | 0 | 1 | 2 | 33.3 | 0 | 0 | 0 |
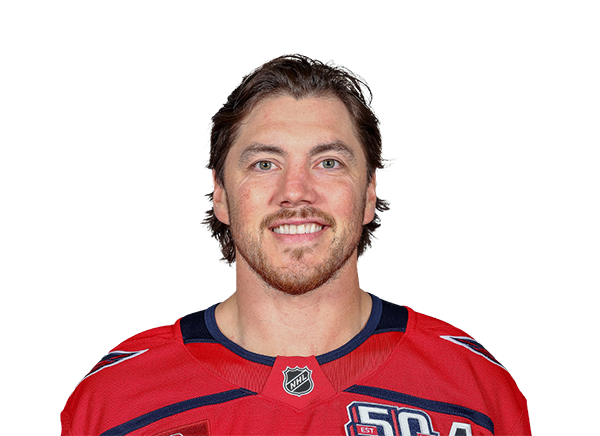 T.J. Oshie#77 · RW | 1 | 1 | 1 | 1 | 17:44 | 5:00 | 0:00 | 12:44 | 21 | 0 | 14 | 0 | 0 | 0 | 0 | 2 | 4 | 33.3 | 0 | 1 | 2 |
 Alex Ovechkin#8 · LW | 0 | 1 | 0 | 2 | 20:08 | 6:55 | 0:00 | 13:13 | 19 | 2 | 24 | 1 | 5 | 3 | 0 | 0 | 0 | 0.0 | 1 | 0 | 0 |
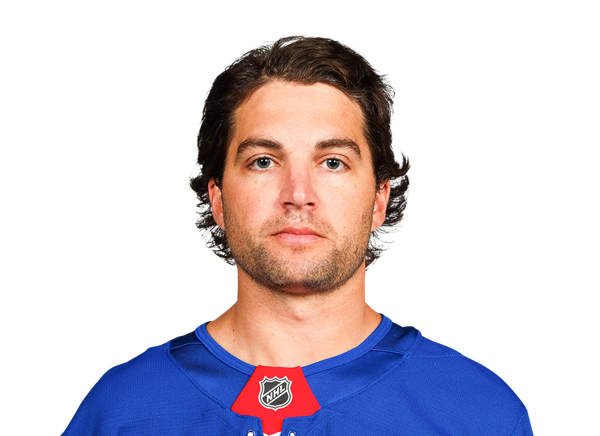 Conor Sheary#73 · LW | 0 | 0 | 1 | -1 | 11:42 | 1:57 | 0:00 | 9:45 | 16 | 1 | 12 | 0 | 4 | 1 | 0 | 0 | 0 | 0.0 | 0 | 1 | 2 |
 Daniel Sprong#10 · RW | 0 | 1 | 0 | -1 | 9:49 | 0:00 | 0:00 | 9:49 | 12 | 0 | 7 | 0 | 5 | 0 | 0 | 0 | 0 | 0.0 | 0 | 0 | 0 |
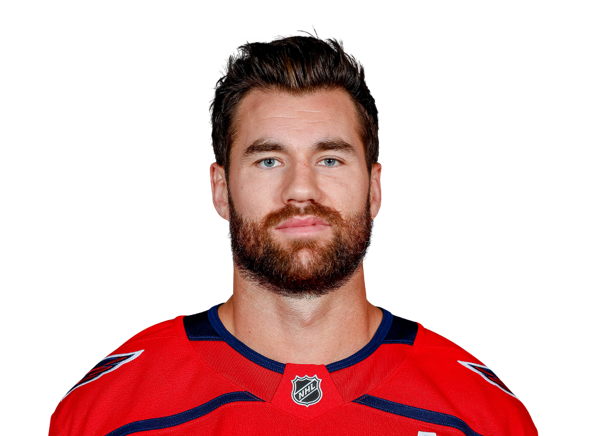 Tom Wilson#43 · RW | 0 | 0 | 1 | 2 | 16:44 | 2:00 | 2:45 | 11:59 | 23 | 0 | 11 | 1 | 3 | 0 | 0 | 0 | 1 | 0.0 | 0 | 0 | 0 |
Flyers| Player | BS | HT | TK | +/- | TOI | PPTOI | SHTOI | ESTOI | SHFT | G | YTDG | A | S | SM | SOG | FW | FL | FO% | GV | PN | PIM |
|---|---|---|---|---|---|---|---|---|---|---|---|---|---|---|---|---|---|---|---|---|---|
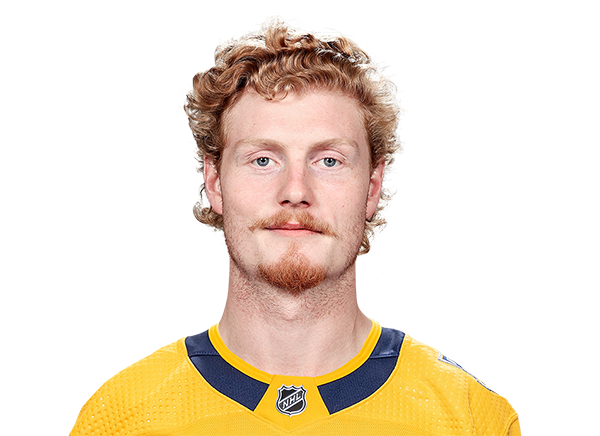 Wade Allison#57 · RW | 1 | 2 | 0 | 0 | 16:17 | 3:30 | 0:00 | 12:47 | 20 | 1 | 1 | 0 | 1 | 0 | 0 | 0 | 0 | 0.0 | 0 | 0 | 0 |
 Nicolas Aube-Kubel#62 · RW | 1 | 3 | 0 | 0 | 10:44 | 0:00 | 0:00 | 10:44 | 13 | 0 | 3 | 1 | 1 | 0 | 0 | 0 | 0 | 0.0 | 1 | 1 | 2 |
 Sean Couturier#14 · C | 0 | 0 | 1 | -3 | 18:22 | 4:18 | 3:32 | 10:32 | 24 | 0 | 13 | 0 | 1 | 1 | 0 | 16 | 7 | 69.6 | 0 | 0 | 0 |
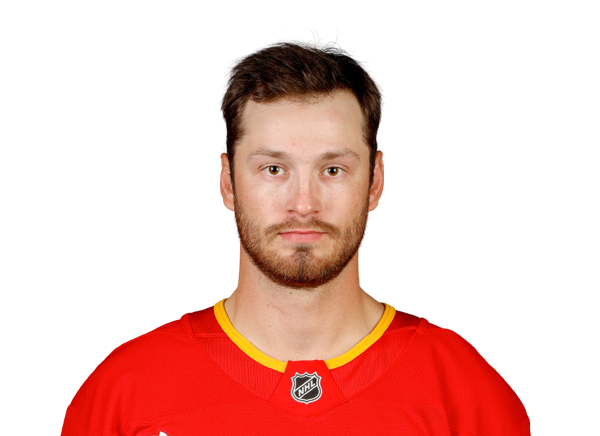 Joel Farabee#86 · LW | 0 | 0 | 1 | 1 | 19:15 | 3:56 | 3:35 | 11:44 | 25 | 0 | 15 | 1 | 0 | 0 | 0 | 0 | 0 | 0.0 | 0 | 0 | 0 |
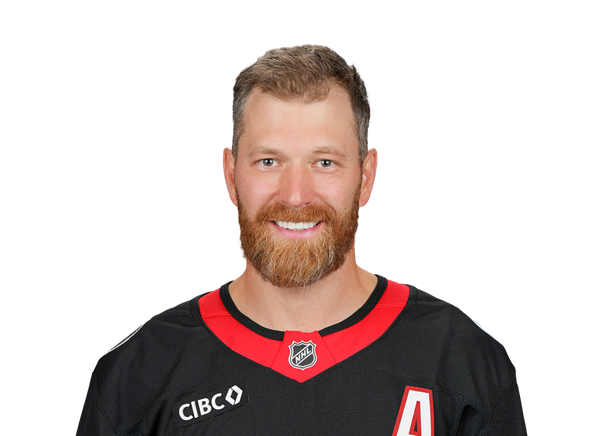 Claude Giroux#28 · RW | 0 | 0 | 1 | 2 | 17:19 | 3:30 | 0:00 | 13:49 | 21 | 0 | 11 | 2 | 2 | 1 | 0 | 13 | 4 | 76.5 | 0 | 0 | 0 |
 Kevin Hayes#13 · RW | 0 | 1 | 0 | -1 | 14:00 | 3:30 | 0:07 | 10:23 | 19 | 0 | 11 | 1 | 2 | 1 | 0 | 3 | 7 | 30.0 | 0 | 1 | 2 |
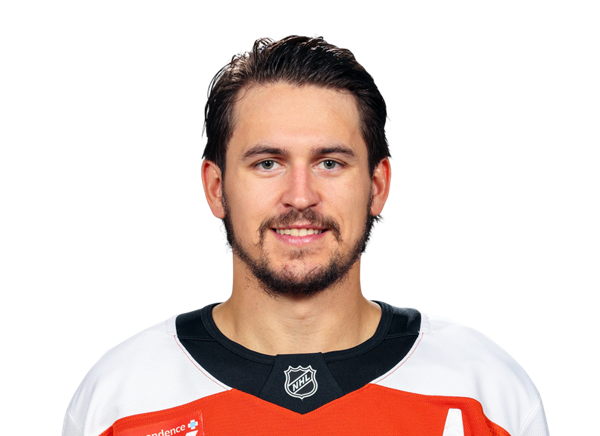 Travis Konecny#11 · RW | 0 | 0 | 0 | -3 | 15:22 | 3:52 | 0:00 | 11:30 | 19 | 0 | 9 | 0 | 1 | 0 | 0 | 0 | 0 | 0.0 | 0 | 1 | 2 |
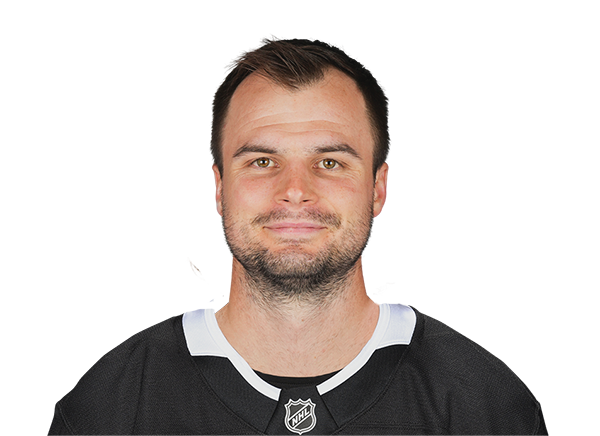 Scott Laughton#21 · C | 1 | 3 | 0 | 0 | 14:44 | 0:00 | 3:28 | 11:16 | 17 | 0 | 7 | 0 | 0 | 0 | 0 | 5 | 6 | 45.5 | 0 | 0 | 0 |
 Oskar Lindblom#23 · LW | 0 | 2 | 0 | 0 | 13:15 | 0:00 | 3:18 | 9:57 | 17 | 0 | 6 | 0 | 0 | 2 | 0 | 0 | 0 | 0.0 | 0 | 0 | 0 |
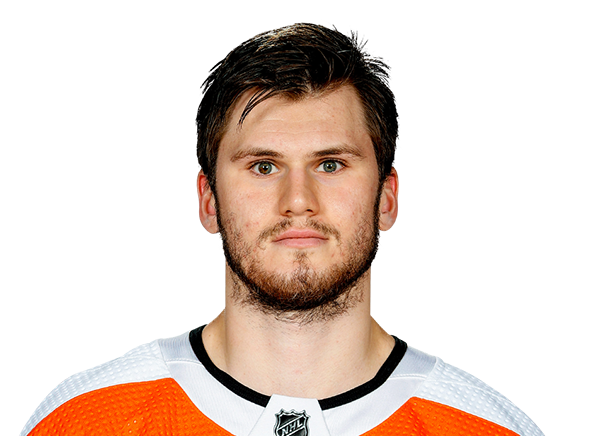 Samuel Morin#55 · LW | 1 | 2 | 0 | -1 | 10:20 | 0:00 | 1:41 | 8:39 | 17 | 0 | 1 | 0 | 0 | 0 | 0 | 0 | 0 | 0.0 | 0 | 1 | 2 |
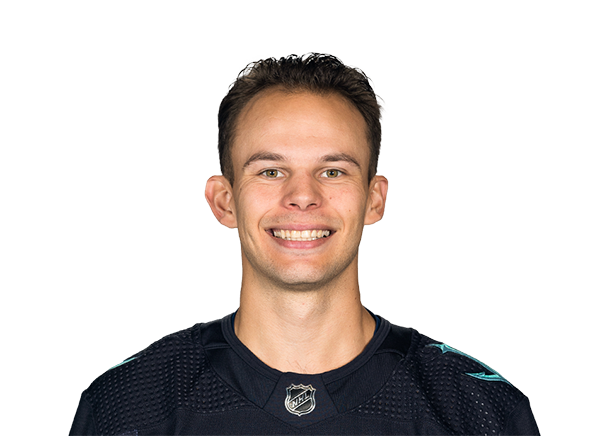 Carsen Twarynski#81 · LW | 1 | 4 | 0 | 0 | 10:06 | 0:00 | 0:00 | 10:06 | 12 | 0 | 0 | 0 | 1 | 1 | 0 | 0 | 0 | 0.0 | 0 | 0 | 0 |
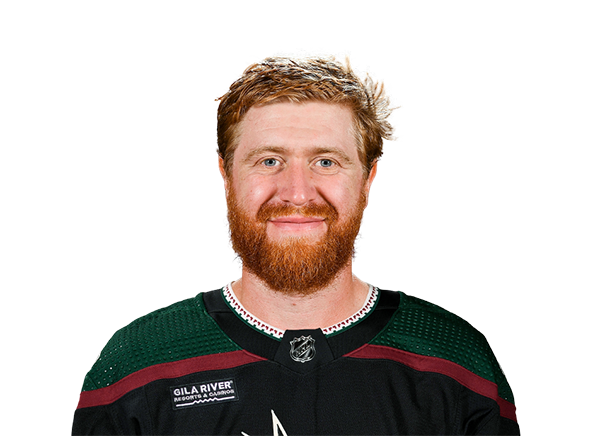 Jakub Voracek#93 · RW | 0 | 0 | 1 | -3 | 17:25 | 4:18 | 0:00 | 13:07 | 21 | 0 | 8 | 0 | 4 | 1 | 0 | 0 | 0 | 0.0 | 0 | 0 | 0 |
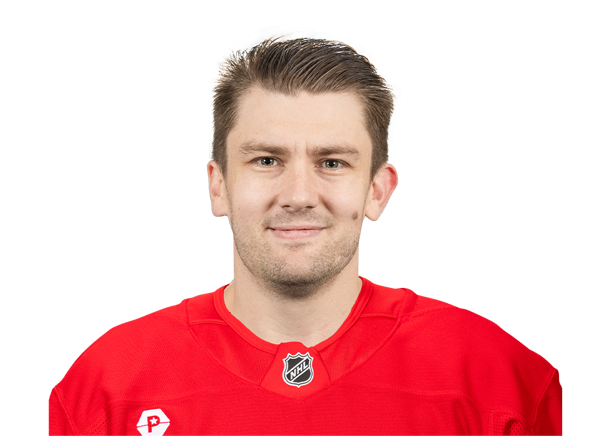 James van Riemsdyk#25 · LW | 0 | 0 | 0 | 0 | 16:21 | 4:18 | 0:00 | 12:03 | 20 | 1 | 14 | 0 | 2 | 1 | 0 | 0 | 0 | 0.0 | 0 | 0 | 0 |
Capitals| Player | BS | HT | TK | +/- | TOI | PPTOI | SHTOI | ESTOI | SHFT | G | YTDG | A | S | SM | SOG | FW | FL | FO% | GV | PN | PIM |
|---|---|---|---|---|---|---|---|---|---|---|---|---|---|---|---|---|---|---|---|---|---|
 John Carlson#74 · D | 1 | 0 | 0 | 1 | 22:01 | 4:50 | 3:39 | 13:32 | 24 | 0 | 10 | 4 | 3 | 1 | 0 | 0 | 0 | 0.0 | 0 | 0 | 0 |
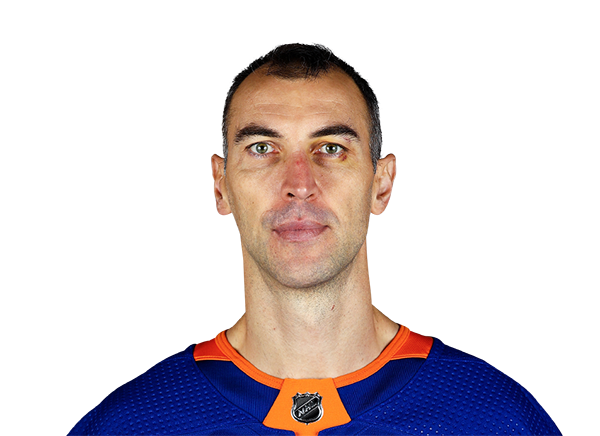 Zdeno Chara#33 · D | 3 | 0 | 0 | -1 | 19:30 | 0:00 | 5:01 | 14:29 | 20 | 0 | 2 | 0 | 1 | 0 | 0 | 0 | 0 | 0.0 | 0 | 0 | 0 |
 Brenden Dillon#4 · D | 1 | 1 | 0 | 1 | 18:03 | 0:00 | 2:47 | 15:16 | 26 | 0 | 2 | 0 | 1 | 0 | 0 | 0 | 0 | 0.0 | 0 | 0 | 0 |
 Nick Jensen#3 · D | 1 | 3 | 0 | 0 | 18:28 | 0:00 | 3:35 | 14:53 | 22 | 0 | 2 | 0 | 3 | 2 | 0 | 0 | 0 | 0.0 | 1 | 1 | 2 |
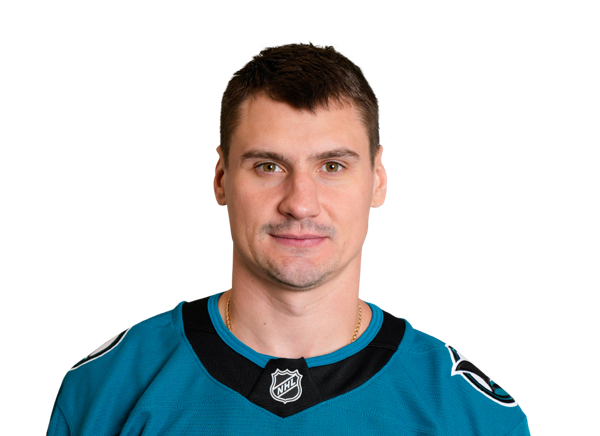 Dmitry Orlov#9 · D | 1 | 1 | 0 | 1 | 17:25 | 0:05 | 0:34 | 16:46 | 22 | 1 | 7 | 0 | 3 | 2 | 0 | 0 | 0 | 0.0 | 0 | 0 | 0 |
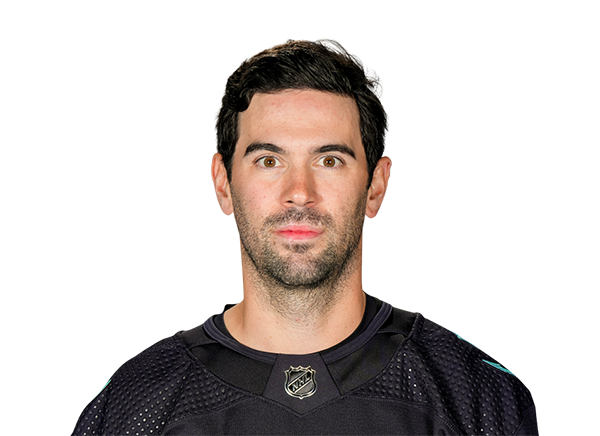 Justin Schultz#2 · D | 0 | 0 | 0 | 2 | 17:11 | 2:10 | 0:00 | 15:01 | 23 | 0 | 3 | 1 | 0 | 0 | 0 | 0 | 0 | 0.0 | 0 | 0 | 0 |
Flyers| Player | BS | HT | TK | +/- | TOI | PPTOI | SHTOI | ESTOI | SHFT | G | YTDG | A | S | SM | SOG | FW | FL | FO% | GV | PN | PIM |
|---|---|---|---|---|---|---|---|---|---|---|---|---|---|---|---|---|---|---|---|---|---|
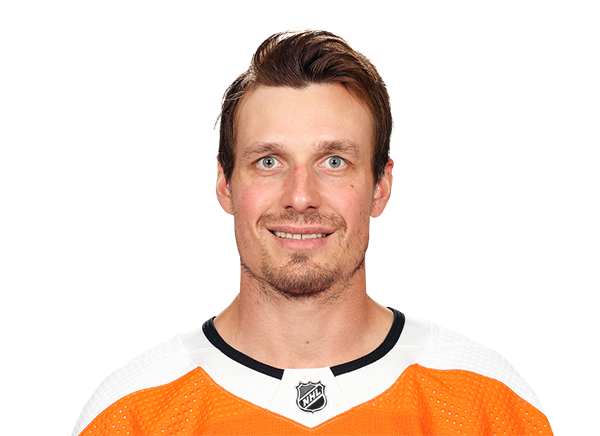 Justin Braun#61 · D | 2 | 1 | 0 | -1 | 16:27 | 0:00 | 3:20 | 13:07 | 23 | 0 | 0 | 0 | 0 | 0 | 0 | 0 | 0 | 0.0 | 0 | 1 | 2 |
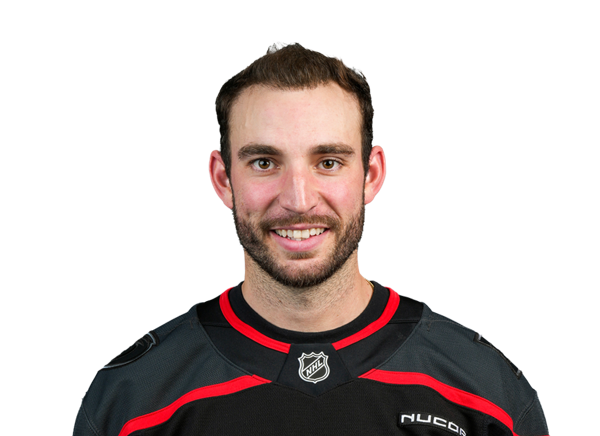 Shayne Gostisbehere#53 · D | 2 | 1 | 0 | -1 | 20:30 | 3:43 | 0:00 | 16:47 | 21 | 0 | 8 | 0 | 1 | 2 | 0 | 0 | 0 | 0.0 | 0 | 0 | 0 |
 Philippe Myers#5 · D | 2 | 3 | 0 | 0 | 17:22 | 0:00 | 1:16 | 16:06 | 23 | 0 | 0 | 0 | 2 | 1 | 0 | 0 | 0 | 0.0 | 2 | 0 | 0 |
 Ivan Provorov#9 · D | 0 | 0 | 0 | -1 | 24:41 | 3:31 | 4:37 | 16:33 | 31 | 1 | 7 | 0 | 3 | 0 | 0 | 0 | 0 | 0.0 | 2 | 0 | 0 |
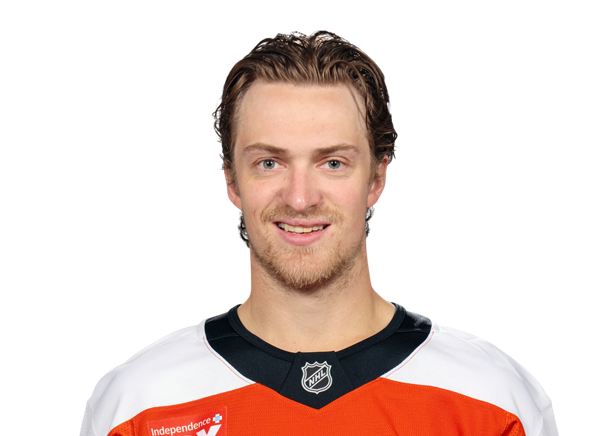 Travis Sanheim#6 · D | 4 | 2 | 0 | 0 | 22:44 | 0:34 | 3:06 | 19:04 | 28 | 0 | 2 | 0 | 4 | 0 | 0 | 0 | 0 | 0.0 | 3 | 0 | 0 |
Capitals| Player | GA | SA | SOS | SOSA | SV | SV% | ESSV | PPSV | SHSV | TOI | YTDG | PIM |
|---|---|---|---|---|---|---|---|---|---|---|---|---|
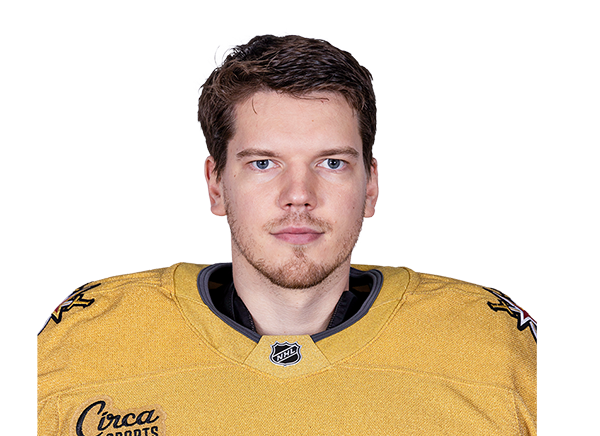 Ilya Samsonov#30 · G | 3 | 25 | 0 | 0 | 22 | .880 | 10 | 1 | 11 | 60:00 | 0 | 0 |
Flyers| Player | GA | SA | SOS | SOSA | SV | SV% | ESSV | PPSV | SHSV | TOI | YTDG | PIM |
|---|---|---|---|---|---|---|---|---|---|---|---|---|
 Alex Lyon#34 · G | 5 | 40 | 0 | 0 | 35 | .875 | 30 | 2 | 3 | 57:46 | 0 | 0 |
Injury Report
Head-to-Head
WSHLast 5 Games
PHI
2◂
NHL Regular Season
FINAL
May 8, 2021
1
2
NHL Regular Season
FINAL
May 7, 2021
▸4
6◂
NHL Regular Season
FINAL
Apr 13, 2021
1
5◂
NHL Regular Season
FINAL
Mar 13, 2021
4
5◂
NHL Regular Season
FINAL
Mar 11, 2021
3
Last 5 Games

Game Information
Stage
Regular Season
Season
2021
Puck Drop
Sat, Apr 17, 12:30 PM
Venue
Xfinity Mobile Arena
Location
Philadelphia, PA
Attendance
3,430
Officials
Steve Kozari · Referee, Dan O'Rourke · Referee, Brandon Gawryletz · Linesman, Julien Fournier · Linesman
Division Standings
Eastern Conference — Metropolitan Division
| Team | GP | W | L | OT | Pct | PTS | DIFF | Strk |
|---|---|---|---|---|---|---|---|---|
 Hurricanes | 82 | 53 | 22 | 7 | — | 113 | +56 | W1 |
 Penguins | 82 | 41 | 25 | 16 | — | 98 | +25 | L3 |
| Flyers | 82 | 43 | 27 | 12 | — | 98 | +7 | W3 |
| Capitals | 82 | 43 | 30 | 9 | — | 95 | +19 | W4 |
 Blue Jackets | 82 | 40 | 30 | 12 | — | 92 | 0 | L2 |
 Islanders | 82 | 43 | 34 | 5 | — | 91 | -8 | L3 |
 Devils | 82 | 42 | 37 | 3 | — | 87 | -24 | L1 |
 Rangers | 82 | 34 | 39 | 9 | — | 77 | -12 | W1 |
Capitals
12th in Eastern Conference
VS
Flyers
14th in Eastern Conference
Goaltenders
#79
Charlie Lindgren
#1

Remi Poirier
#48
Logan Thompson
Defensemen
#6
Jakob Chychrun
#73

Vincent Desharnais
#42

Martin Fehervary
#44
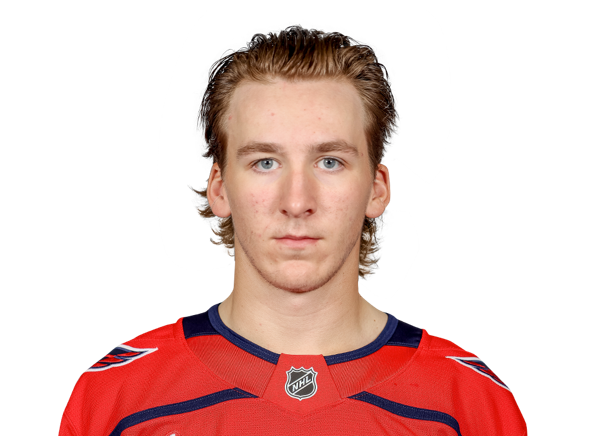
Cole Hutson
#27

Timothy Liljegren
#3
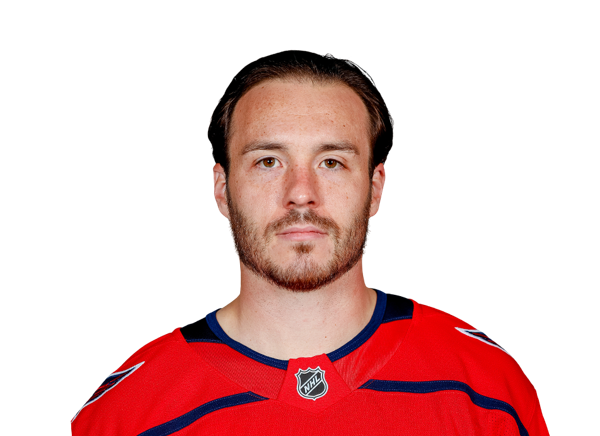
Matt Roy
#38
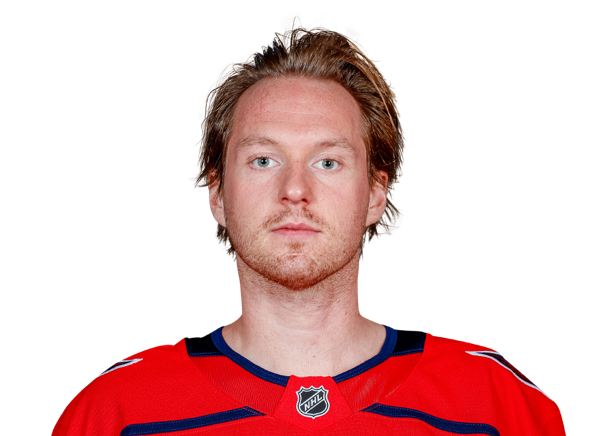
Rasmus Sandin
#6

Jack St. Ivany
Left Wings
#72

Anthony Beauvillier
#80
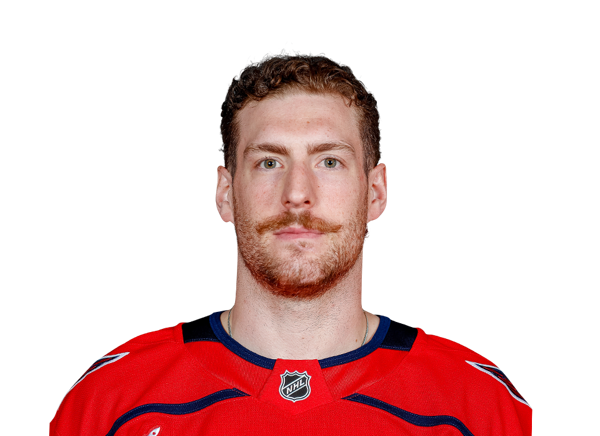
Pierre-Luc Dubois
#63
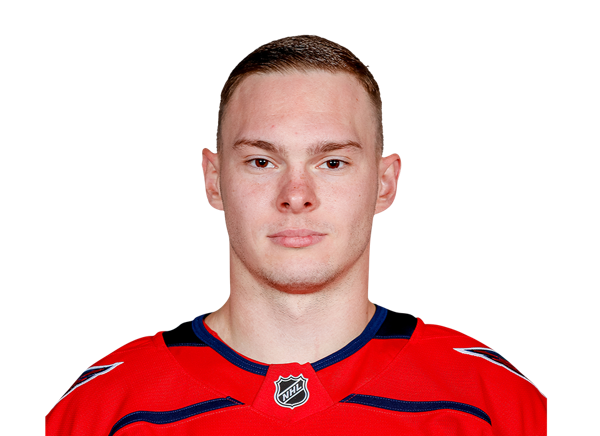
Ivan Miroshnichenko
#8
Alex Ovechkin
#62

Ilya Protas
Centers
#53

Ethen Frank
#22

Boone Jenner
#21
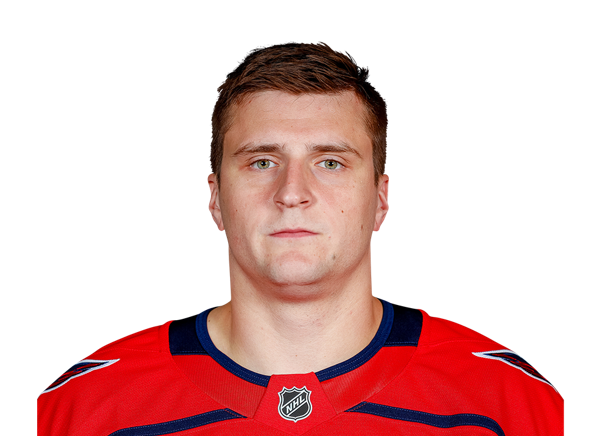
Aliaksei Protas
#17
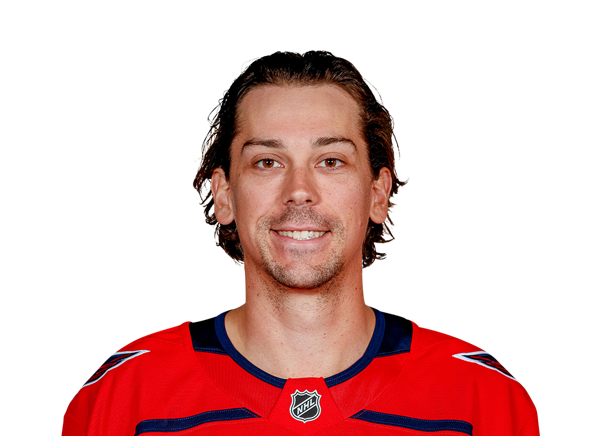
Dylan Strome
#49
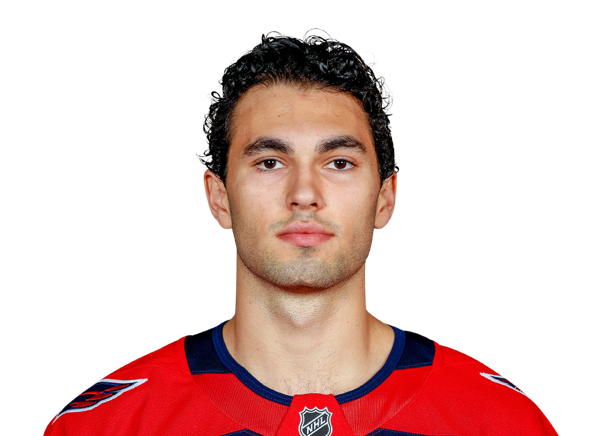
Patrick Thomas
Right Wings
#25
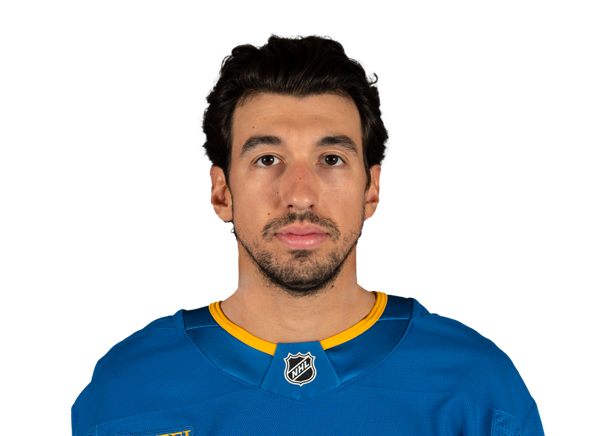
Jordan Kyrou
#9

Ryan Leonard
#34

Justin Sourdif
#89

Alex Tuch
#43
Tom Wilson
Goaltenders
#80
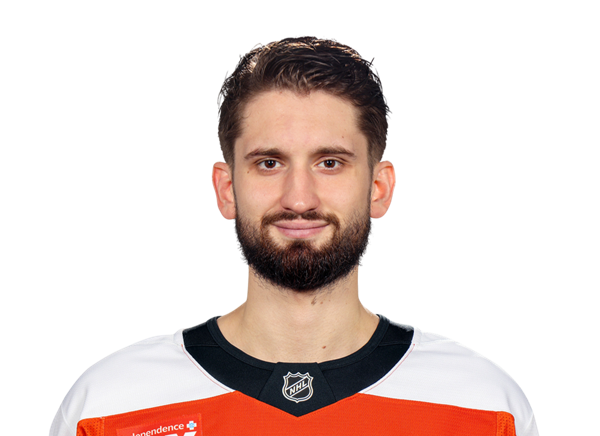
Dan Vladar
#53
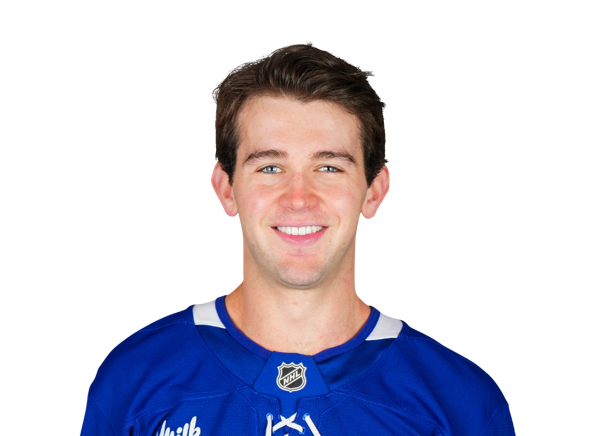
Joseph Woll
Defensemen
#44
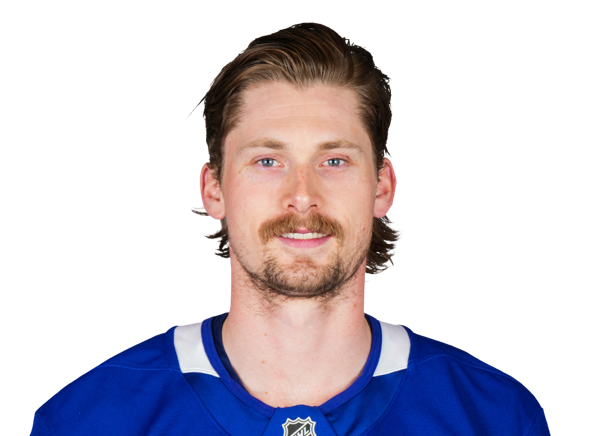
Simon Benoit
#59
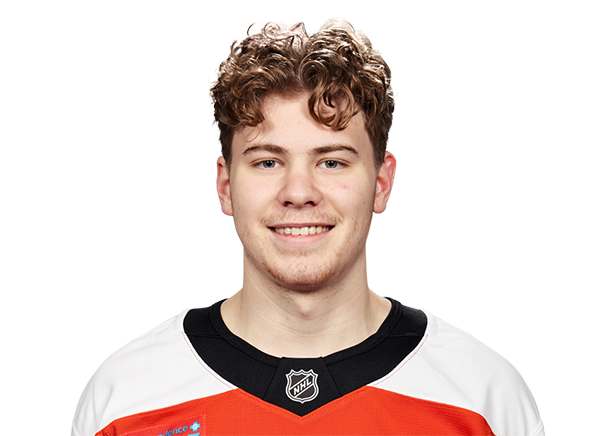
Oliver Bonk
#9

Jamie Drysdale
#3

Helge Grans
#5

David Jiricek
#55
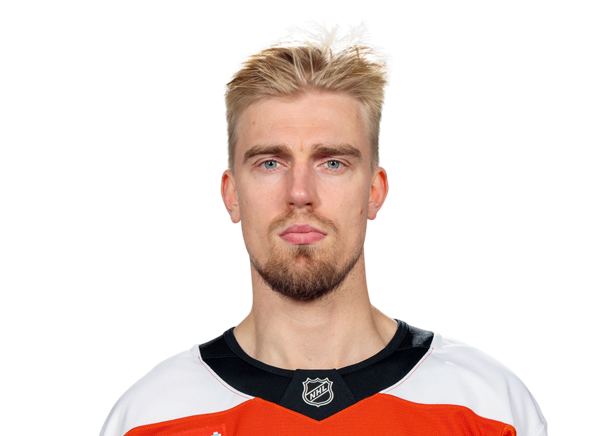
Rasmus Ristolainen
#6
Travis Sanheim
#24

Nick Seeler
#8
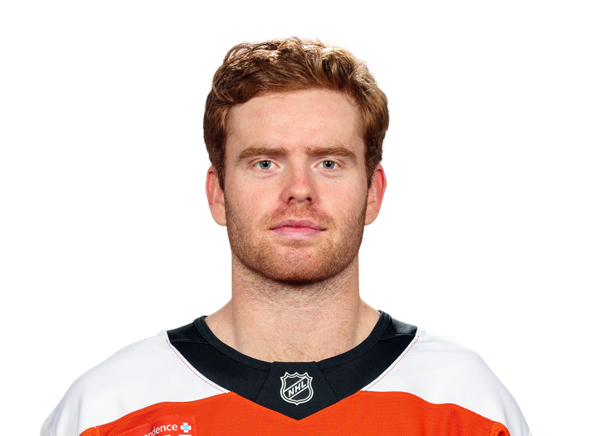
Cam York
Left Wings
#20

Alex Bump
#58

Michael Bunting
#27

Noah Cates
Centers
#52

Noel Acciari
#86
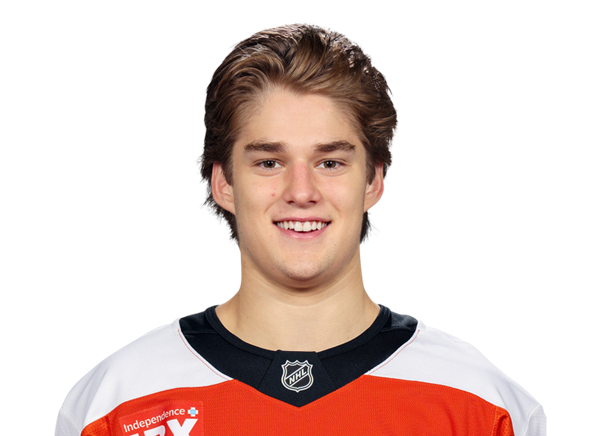
Denver Barkey
#14
Sean Couturier
#22

Christian Dvorak
#17

Jett Luchanko
#46

Trevor Zegras
Right Wings
#71
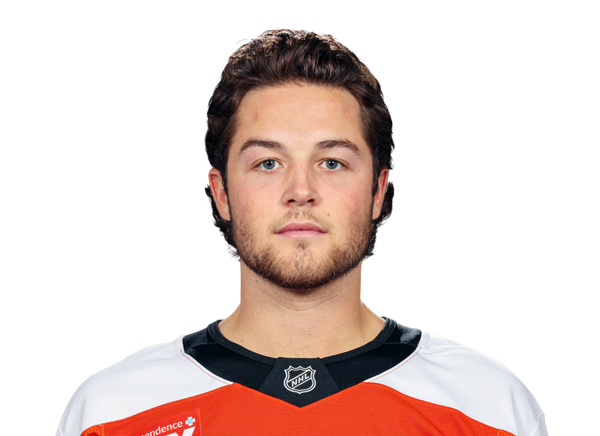
Tyson Foerster
#54

Cole Knuble
#11
Travis Konecny
#94
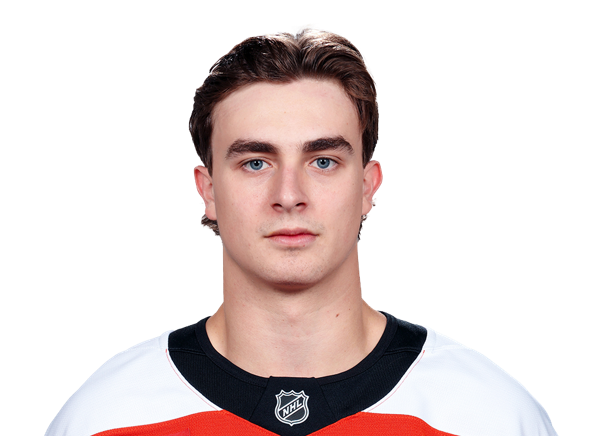
Porter Martone
#39
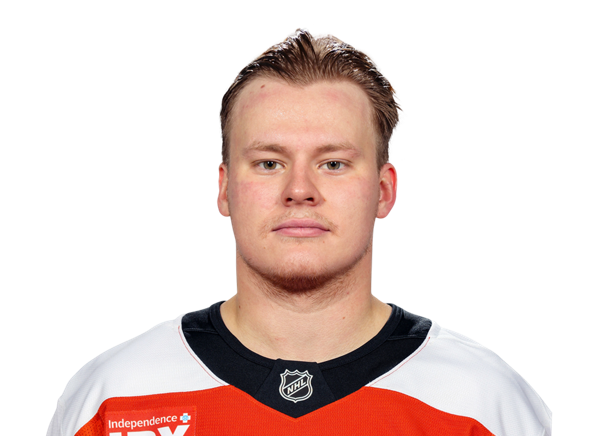
Matvei Michkov
#74
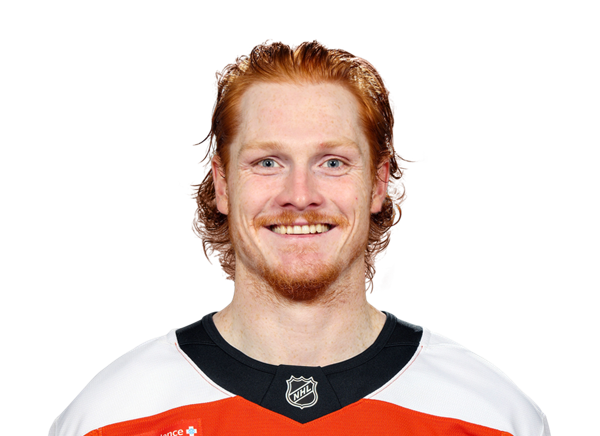
Owen Tippett
Capitals
4th in Metropolitan Division
VS
Flyers
6th in Metropolitan Division
General
14
Games Played
17
4960:21
Time On Ice
6067:33
354:18
Time On Ice Per Game
356:54
0
Plus/Minus Rating
0
0:00
Production
0:00
4927
Shifts
6451
6
Losses
9
8
Wins
4
Offensive
49
Goals
37
81
Assists
66
380
Faceoffs Won
493
400
Faceoffs Lost
481
0
Game-Winning Goals
0
130
Points
103
8
Power Play Goals
9
14
Power Play Assists
18
1
Short Handed Goals
1
0
Short Handed Assists
1
386
Shots
398
0
Shootout Attempts
5
0
Shootout Goals
1
0.0
Shootout Shot Percentage
20.0
12.7
Shooting Percentage
9.3
48.7
Faceoff Win Percent
50.6
Defensive
3.43
Goals Against Average
3.35
339
Saves
441
.885
Save Percentage
.891
48
Goals Against
57
387
Shots Against
498
0
Overtime Losses
4
0
Shootout Saves
3
0
Shootout Shots Against
5
.000
Shootout Save Percentage
.600
Penalties
139
Penalty Minutes
172