

Oilers vs Penguins Live Score (26 Apr, 2022)
Score by Period
| Team | 1st | 2nd | 3rd | Total |
|---|---|---|---|---|
 EDM | 1 | 1 | 3 | 5 |
 PIT | 0 | 1 | 0 | 1 |
Play-by-Play
3rd Period 20:00
5–1
3rd Period 20:00
5–1
3rd Period 19:51
5–1
3rd Period 19:29
5–1
3rd Period 18:55
5–1
3rd Period 18:26
5–1
3rd Period 18:26
5–1
3rd Period 17:43
4–1
3rd Period 17:43
4–1
3rd Period 17:43
4–1
3rd Period 17:36
4–1
3rd Period 17:32
4–1
3rd Period 17:27
4–1
3rd Period 17:27
4–1
3rd Period 17:26
4–1
3rd Period 17:13
4–1
3rd Period 17:13
4–1
3rd Period 17:08
4–1
3rd Period 16:53
4–1
3rd Period 16:35
4–1
3rd Period 15:47
4–1
3rd Period 15:29
4–1
3rd Period 14:58
4–1
3rd Period 14:33
4–1
Scoring Summary
1st Period
12:47
Evan Bouchard
Assists: Connor McDavid, Evander Kane
1 - 0
2nd Period
5:23
Jeff Carter
Assists: Kasperi Kapanen, Mike Matheson
1 - 1
5:48
Evander Kane
Assists: Connor McDavid, Kailer Yamamoto
2 - 1
3rd Period
4:08
Zach Hyman
Assists: Ryan Nugent-Hopkins, Connor McDavid
3 - 1
9:13
Connor McDavid
Assists: Tyson Barrie, Leon Draisaitl
4 - 1
18:26
Zack Kassian
Assists: Brett Kulak, Cody Ceci
5 - 1
Team Stats
EDM
PIT

18
Blocked Shots
12
22
Hits
25
7
Takeaways
16
2
Giveaways
10
2
Power Play Goals
0
4
Power Play Opportunities
4
42
Total Shots
34
8
Penalty Minutes
8
50.0
Power Play %
0.0
0
Short Handed Goals
0
0
Shootout Goals
0
27
Faceoffs Won
29
48.2
Faceoff Percent
51.8
4
Penalties
4
Game Leaders
EDM
PIT
Player Box Score
Oilers| Player | BS | HT | TK | +/- | TOI | PPTOI | SHTOI | ESTOI | SHFT | G | YTDG | A | S | SM | SOG | FW | FL | FO% | GV | PN | PIM |
|---|---|---|---|---|---|---|---|---|---|---|---|---|---|---|---|---|---|---|---|---|---|
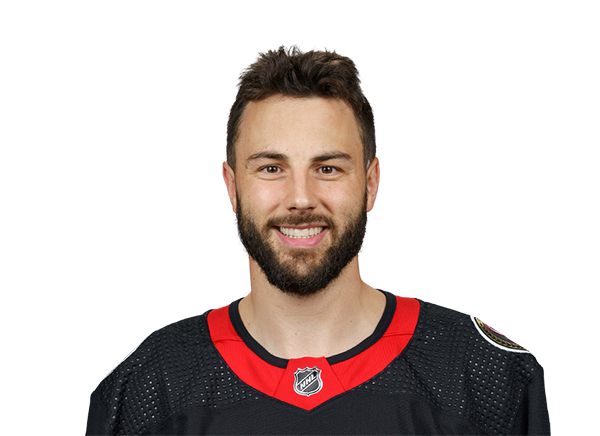 Derick Brassard#16 · C | 0 | 0 | 0 | 0 | 11:35 | 0:00 | 0:00 | 11:35 | 15 | 0 | 8 | 0 | 2 | 0 | 0 | 0 | 1 | 0.0 | 0 | 1 | 2 |
 Leon Draisaitl#29 · C | 0 | 1 | 2 | 0 | 19:03 | 4:11 | 1:34 | 13:18 | 24 | 0 | 55 | 1 | 2 | 2 | 0 | 10 | 9 | 52.6 | 0 | 0 | 0 |
 Warren Foegele#37 · LW | 0 | 1 | 0 | 0 | 11:30 | 0:04 | 0:00 | 11:26 | 15 | 0 | 12 | 0 | 2 | 1 | 0 | 0 | 0 | 0.0 | 0 | 0 | 0 |
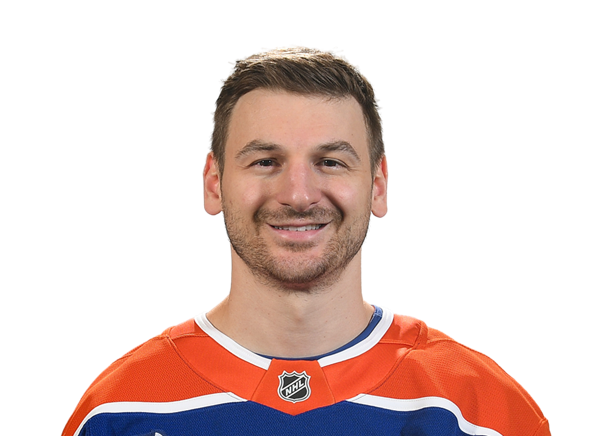 Zach Hyman#18 · LW | 1 | 1 | 0 | 0 | 17:01 | 1:38 | 3:28 | 11:55 | 24 | 1 | 26 | 0 | 1 | 0 | 0 | 0 | 0 | 0.0 | 1 | 0 | 0 |
 Evander Kane#91 · LW | 0 | 3 | 1 | 2 | 17:24 | 1:48 | 0:29 | 15:07 | 21 | 1 | 22 | 1 | 5 | 1 | 0 | 1 | 0 | 100.0 | 0 | 0 | 0 |
 Zack Kassian#44 · RW | 0 | 2 | 0 | 1 | 10:12 | 0:08 | 0:00 | 10:04 | 14 | 1 | 6 | 0 | 2 | 1 | 0 | 0 | 0 | 0.0 | 0 | 1 | 2 |
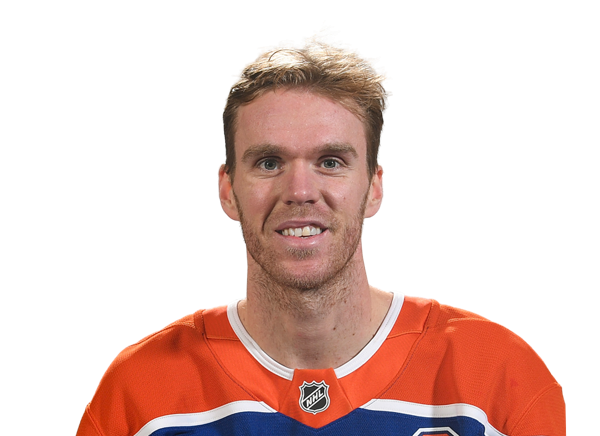 Connor McDavid#97 · C | 0 | 0 | 0 | 2 | 19:05 | 4:19 | 0:08 | 14:38 | 20 | 1 | 44 | 3 | 4 | 1 | 0 | 6 | 5 | 54.5 | 0 | 0 | 0 |
 Ryan McLeod#71 · C | 3 | 2 | 1 | 0 | 14:26 | 0:03 | 1:57 | 12:26 | 20 | 0 | 8 | 0 | 0 | 0 | 0 | 2 | 3 | 40.0 | 0 | 0 | 0 |
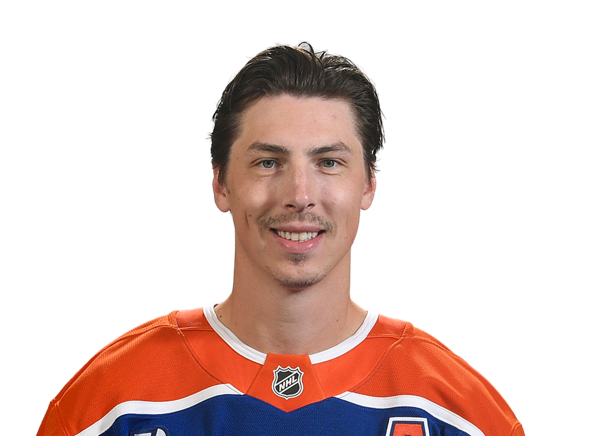 Ryan Nugent-Hopkins#93 · C | 1 | 0 | 0 | 0 | 18:13 | 4:20 | 3:08 | 10:45 | 21 | 0 | 11 | 1 | 3 | 0 | 0 | 3 | 5 | 37.5 | 0 | 0 | 0 |
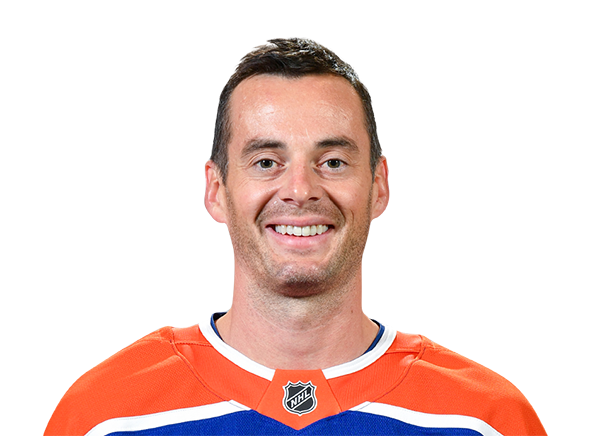 Derek Ryan#10 · C | 0 | 3 | 1 | -1 | 12:11 | 0:00 | 0:24 | 11:47 | 17 | 0 | 9 | 0 | 3 | 0 | 0 | 1 | 2 | 33.3 | 0 | 1 | 2 |
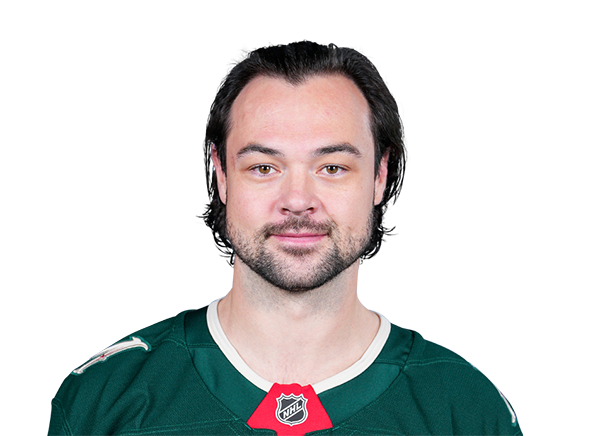 Devin Shore#14 · C | 0 | 3 | 0 | 0 | 10:53 | 0:00 | 0:24 | 10:29 | 14 | 0 | 5 | 0 | 1 | 0 | 0 | 4 | 4 | 50.0 | 0 | 0 | 0 |
 Kailer Yamamoto#56 · RW | 2 | 2 | 0 | 2 | 15:30 | 0:49 | 1:58 | 12:43 | 22 | 0 | 19 | 1 | 3 | 2 | 0 | 0 | 0 | 0.0 | 0 | 0 | 0 |
Penguins| Player | BS | HT | TK | +/- | TOI | PPTOI | SHTOI | ESTOI | SHFT | G | YTDG | A | S | SM | SOG | FW | FL | FO% | GV | PN | PIM |
|---|---|---|---|---|---|---|---|---|---|---|---|---|---|---|---|---|---|---|---|---|---|
 Teddy Blueger#53 · C | 0 | 0 | 0 | -1 | 9:15 | 0:00 | 1:29 | 7:46 | 11 | 0 | 9 | 0 | 1 | 0 | 0 | 2 | 4 | 33.3 | 1 | 0 | 0 |
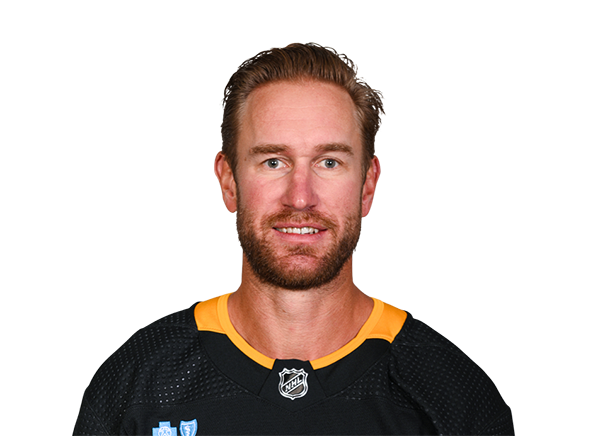 Jeff Carter#77 · C | 1 | 0 | 0 | -1 | 17:48 | 2:49 | 2:37 | 12:22 | 24 | 1 | 19 | 0 | 1 | 0 | 0 | 8 | 6 | 57.1 | 1 | 0 | 0 |
 Sidney Crosby#87 · C | 1 | 0 | 1 | -1 | 22:11 | 5:13 | 0:10 | 16:48 | 24 | 0 | 31 | 0 | 5 | 0 | 0 | 18 | 11 | 62.1 | 0 | 1 | 2 |
 Jake Guentzel#59 · C | 1 | 3 | 0 | -1 | 22:35 | 5:19 | 0:14 | 17:02 | 24 | 0 | 40 | 0 | 2 | 1 | 0 | 0 | 0 | 0.0 | 0 | 0 | 0 |
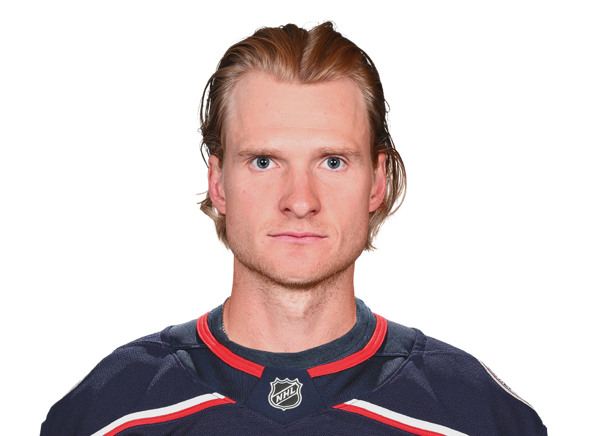 Danton Heinen#43 · LW | 0 | 1 | 2 | -1 | 9:28 | 0:00 | 0:00 | 9:28 | 14 | 0 | 18 | 0 | 3 | 0 | 0 | 0 | 0 | 0.0 | 0 | 0 | 0 |
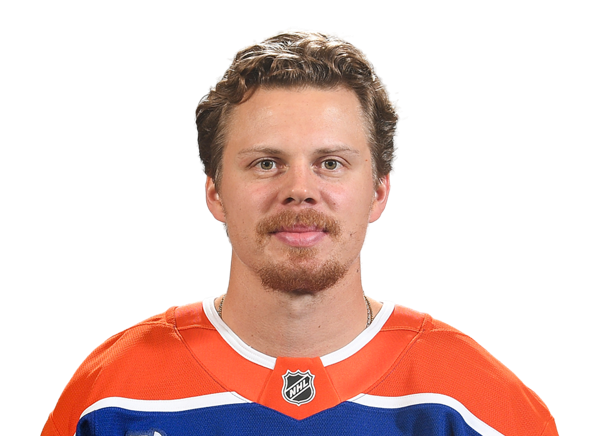 Kasperi Kapanen#42 · RW | 0 | 0 | 0 | 0 | 13:04 | 1:28 | 0:00 | 11:36 | 19 | 0 | 11 | 1 | 0 | 0 | 0 | 0 | 0 | 0.0 | 1 | 0 | 0 |
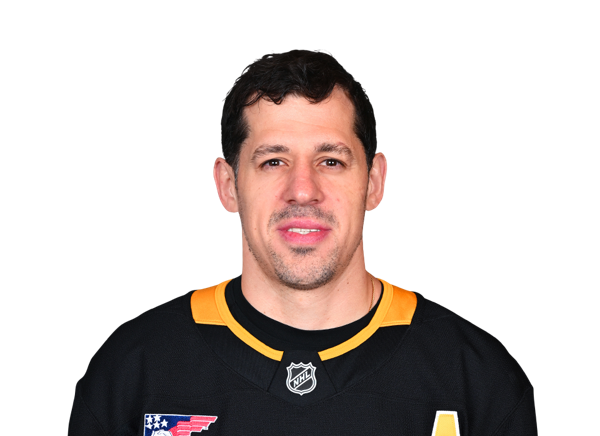 Evgeni Malkin#71 · C | 0 | 0 | 3 | -1 | 20:18 | 5:21 | 0:00 | 14:57 | 21 | 0 | 19 | 0 | 4 | 0 | 0 | 0 | 6 | 0.0 | 2 | 0 | 0 |
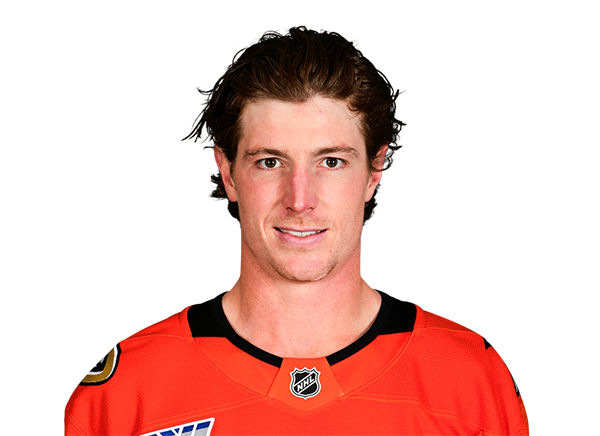 Brock McGinn#23 · LW | 1 | 1 | 1 | -1 | 17:43 | 0:05 | 2:34 | 15:04 | 22 | 0 | 12 | 0 | 4 | 1 | 0 | 0 | 0 | 0.0 | 0 | 0 | 0 |
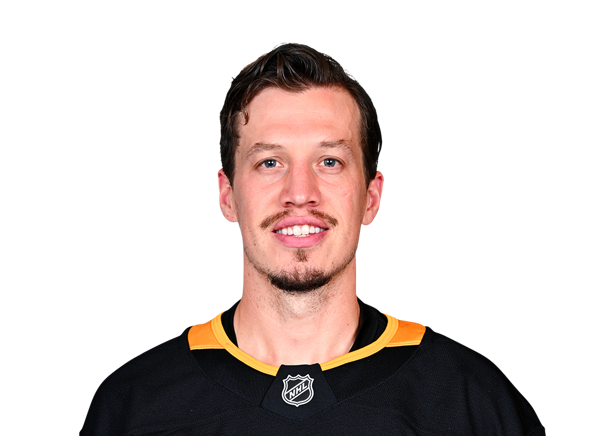 Rickard Rakell#67 · RW | 0 | 3 | 1 | 1 | 15:50 | 1:30 | 0:00 | 14:20 | 19 | 0 | 20 | 0 | 0 | 0 | 0 | 0 | 0 | 0.0 | 2 | 0 | 0 |
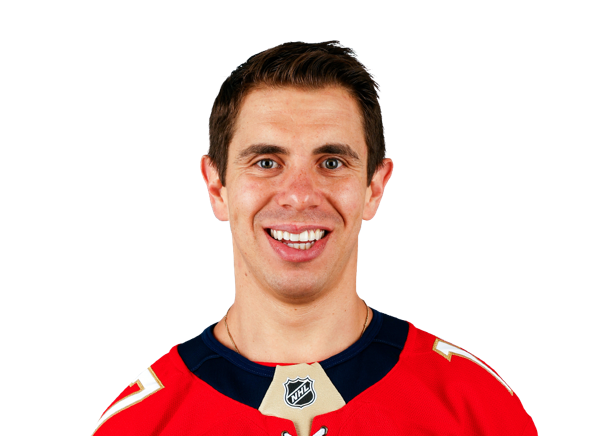 Evan Rodrigues#9 · C | 0 | 1 | 1 | 1 | 10:39 | 1:32 | 0:28 | 8:39 | 12 | 0 | 18 | 0 | 0 | 1 | 0 | 1 | 0 | 100.0 | 0 | 0 | 0 |
 Bryan Rust#17 · RW | 0 | 2 | 2 | -1 | 23:02 | 5:15 | 1:14 | 16:33 | 25 | 0 | 24 | 0 | 6 | 1 | 0 | 0 | 0 | 0.0 | 0 | 1 | 2 |
 Jason Zucker#16 · LW | 0 | 0 | 0 | -1 | 3:28 | 0:00 | 0:00 | 3:28 | 5 | 0 | 8 | 0 | 0 | 0 | 0 | 0 | 0 | 0.0 | 1 | 0 | 0 |
Oilers| Player | BS | HT | TK | +/- | TOI | PPTOI | SHTOI | ESTOI | SHFT | G | YTDG | A | S | SM | SOG | FW | FL | FO% | GV | PN | PIM |
|---|---|---|---|---|---|---|---|---|---|---|---|---|---|---|---|---|---|---|---|---|---|
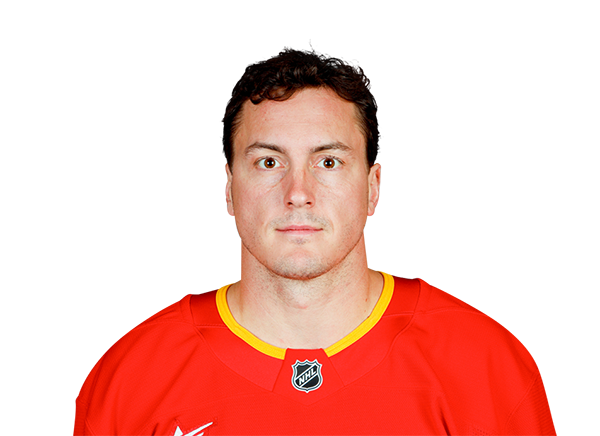 Tyson Barrie#22 · D | 0 | 0 | 1 | -1 | 18:38 | 4:11 | 0:26 | 14:01 | 20 | 0 | 6 | 1 | 2 | 0 | 0 | 0 | 0 | 0.0 | 0 | 0 | 0 |
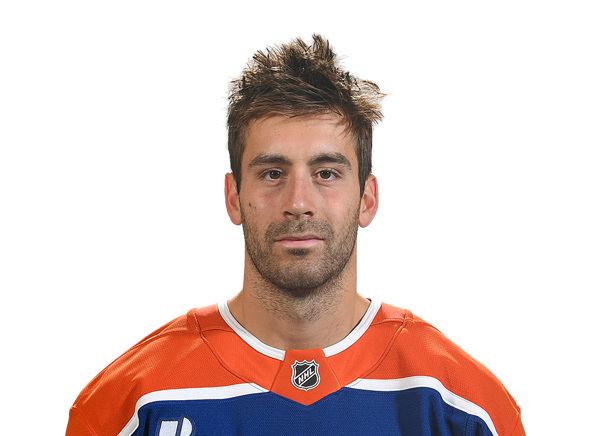 Evan Bouchard#75 · D | 1 | 0 | 0 | 2 | 19:33 | 0:12 | 3:05 | 16:16 | 22 | 1 | 12 | 0 | 6 | 0 | 0 | 0 | 0 | 0.0 | 1 | 0 | 0 |
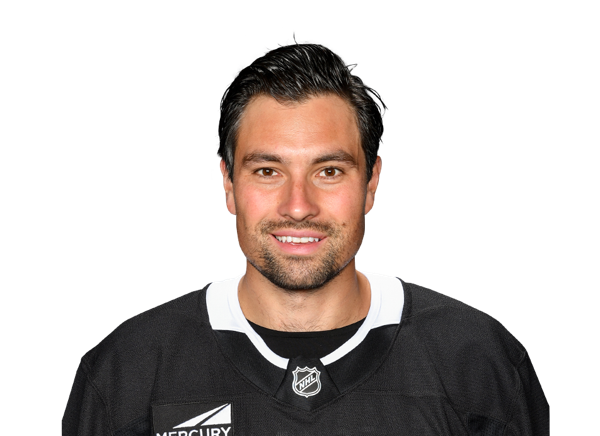 Cody Ceci#5 · D | 1 | 0 | 0 | 1 | 21:11 | 0:00 | 3:13 | 17:58 | 22 | 0 | 5 | 1 | 2 | 0 | 0 | 0 | 0 | 0.0 | 0 | 0 | 0 |
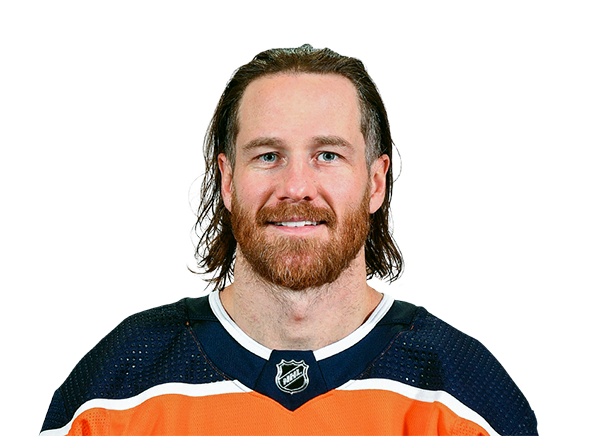 Duncan Keith#2 · D | 5 | 0 | 1 | 2 | 19:38 | 0:12 | 3:08 | 16:18 | 22 | 0 | 1 | 0 | 0 | 0 | 0 | 0 | 0 | 0.0 | 0 | 0 | 0 |
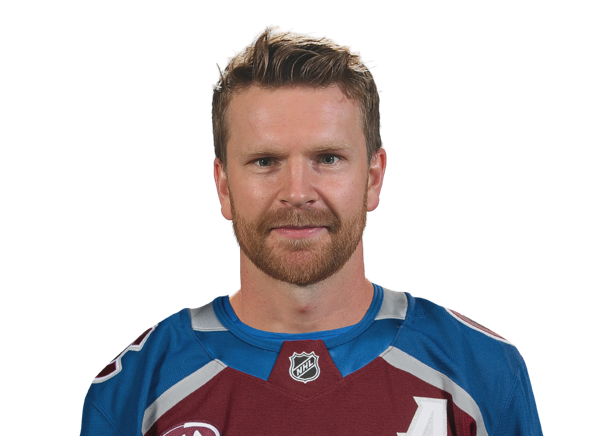 Brett Kulak#27 · D | 2 | 3 | 0 | 1 | 21:07 | 0:00 | 2:28 | 18:39 | 22 | 0 | 4 | 1 | 3 | 1 | 0 | 0 | 0 | 0.0 | 0 | 1 | 2 |
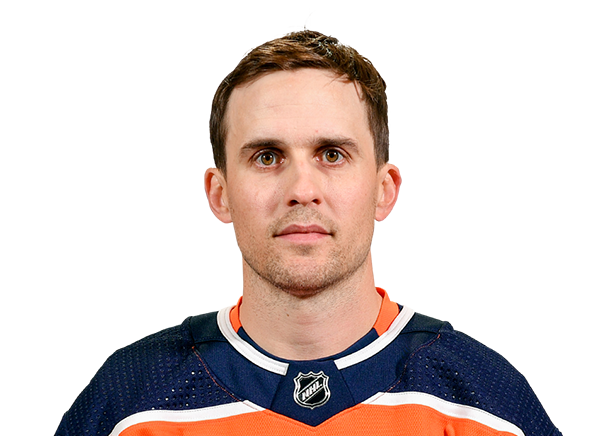 Kris Russell#6 · D | 2 | 1 | 0 | -1 | 15:18 | 0:00 | 1:10 | 14:08 | 22 | 0 | 2 | 0 | 0 | 0 | 0 | 0 | 0 | 0.0 | 0 | 0 | 0 |
Penguins| Player | BS | HT | TK | +/- | TOI | PPTOI | SHTOI | ESTOI | SHFT | G | YTDG | A | S | SM | SOG | FW | FL | FO% | GV | PN | PIM |
|---|---|---|---|---|---|---|---|---|---|---|---|---|---|---|---|---|---|---|---|---|---|
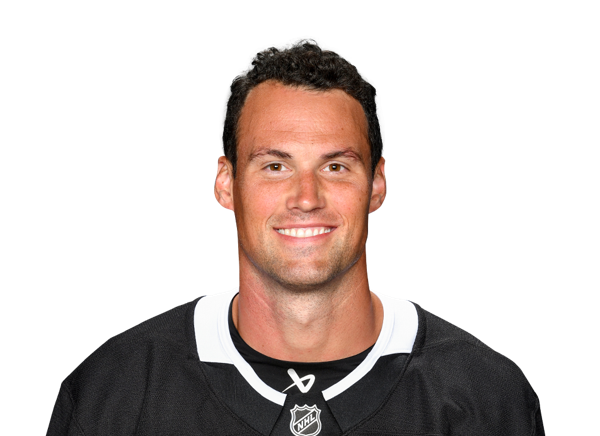 Brian Dumoulin#8 · D | 1 | 2 | 1 | -1 | 20:58 | 0:04 | 3:38 | 17:16 | 22 | 0 | 3 | 0 | 1 | 1 | 0 | 0 | 0 | 0.0 | 0 | 0 | 0 |
 Kris Letang#58 · D | 0 | 2 | 1 | -1 | 27:08 | 4:59 | 0:37 | 21:32 | 24 | 0 | 9 | 0 | 4 | 0 | 0 | 0 | 0 | 0.0 | 0 | 0 | 0 |
 John Marino#6 · D | 2 | 0 | 2 | -2 | 18:11 | 0:10 | 2:34 | 15:27 | 22 | 0 | 1 | 0 | 0 | 0 | 0 | 0 | 0 | 0.0 | 0 | 0 | 0 |
 Mike Matheson#5 · D | 1 | 3 | 1 | 1 | 16:49 | 1:42 | 0:08 | 14:59 | 21 | 0 | 11 | 1 | 0 | 2 | 0 | 0 | 0 | 0.0 | 0 | 1 | 2 |
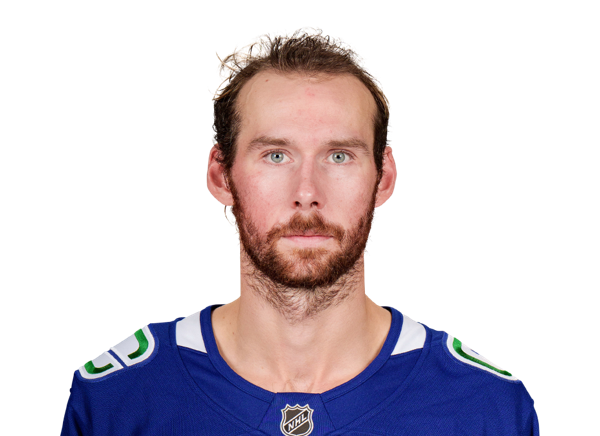 Marcus Pettersson#28 · D | 2 | 2 | 0 | -1 | 13:53 | 0:00 | 0:00 | 13:53 | 17 | 0 | 1 | 0 | 1 | 0 | 0 | 0 | 0 | 0.0 | 1 | 1 | 2 |
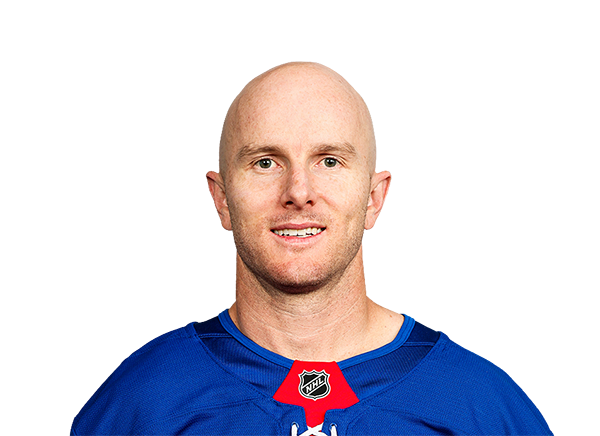 Chad Ruhwedel#2 · D | 2 | 5 | 0 | 0 | 15:45 | 0:00 | 1:49 | 13:56 | 17 | 0 | 4 | 0 | 2 | 0 | 0 | 0 | 0 | 0.0 | 1 | 0 | 0 |
Oilers| Player | GA | SA | SOS | SOSA | SV | SV% | ESSV | PPSV | SHSV | TOI | YTDG | PIM |
|---|---|---|---|---|---|---|---|---|---|---|---|---|
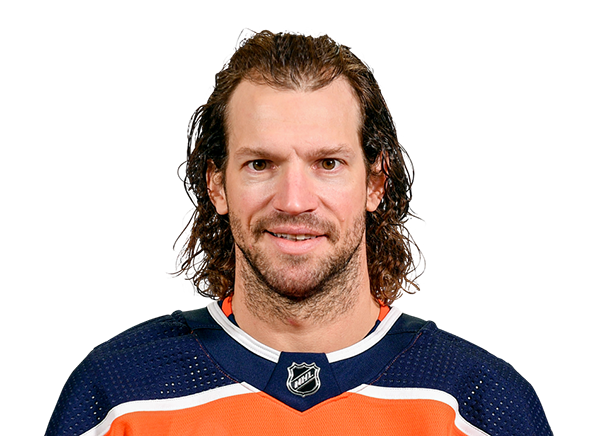 Mike Smith#41 · G | 1 | 34 | 0 | 0 | 33 | .971 | 25 | 0 | 8 | 59:32 | 0 | 0 |
Penguins| Player | GA | SA | SOS | SOSA | SV | SV% | ESSV | PPSV | SHSV | TOI | YTDG | PIM |
|---|---|---|---|---|---|---|---|---|---|---|---|---|
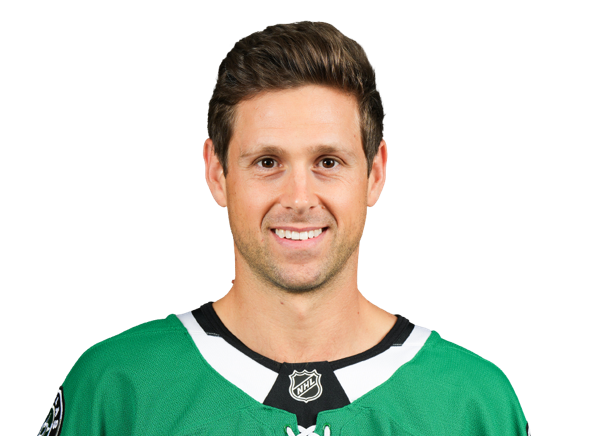 Casey DeSmith#1 · G | 4 | 41 | 0 | 0 | 37 | .902 | 29 | 3 | 5 | 56:17 | 0 | 0 |
Injury Report
Head-to-Head
EDMLast 1 Game
PIT
5◂
NHL Regular Season
FINAL
Dec 1, 2021
2
Last 5 Games






Game Information
Stage
Regular Season
Season
2022
Puck Drop
Tue, Apr 26, 7:00 PM
Venue
PPG Paints Arena
Location
Pittsburgh, PA
Attendance
17,804
Officials
Eric Furlatt · Referee, Francois St. Laurent · Referee, Michel Cormier · Linesman, James Tobias · Linesman
Division Standings
Eastern Conference — Metropolitan Division
| Team | GP | W | L | OT | Pct | PTS | DIFF | Strk |
|---|---|---|---|---|---|---|---|---|
 Hurricanes | 82 | 53 | 22 | 7 | — | 113 | +56 | W1 |
| Penguins | 82 | 41 | 25 | 16 | — | 98 | +25 | L3 |
 Flyers | 82 | 43 | 27 | 12 | — | 98 | +7 | W3 |
 Capitals | 82 | 43 | 30 | 9 | — | 95 | +19 | W4 |
 Blue Jackets | 82 | 40 | 30 | 12 | — | 92 | 0 | L2 |
 Islanders | 82 | 43 | 34 | 5 | — | 91 | -8 | L3 |
 Devils | 82 | 42 | 37 | 3 | — | 87 | -24 | L1 |
 Rangers | 82 | 34 | 39 | 9 | — | 77 | -12 | W1 |





Oilers
1st in Western Conference
VS
Penguins
14th in Eastern Conference
Goaltenders
#30

Frederik Andersen
#35

Tristan Jarry
#27

Devon Levi
#90
Matt Tomkins
Defensemen
#2
Evan Bouchard
#14

Mattias Ekholm
#49

Ty Emberson
#37

Atro Leppanen
#85
Shakir Mukhamadullin
#5
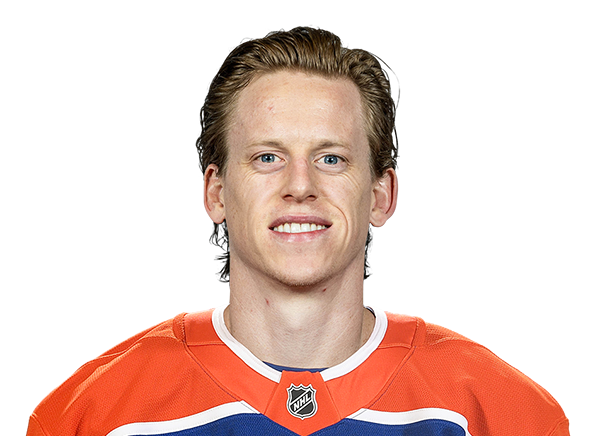
Connor Murphy
#75

Alec Regula
#6
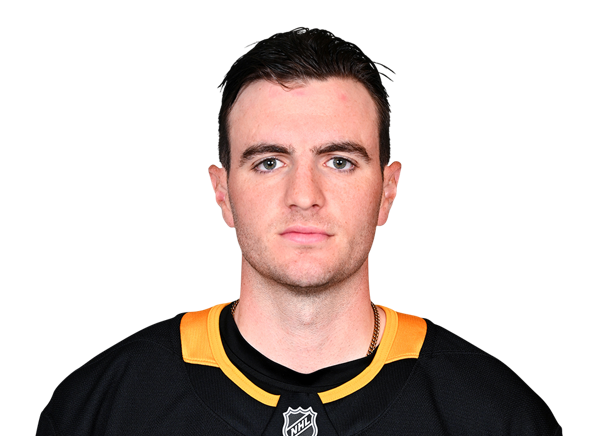
Ryan Shea
#96

Jake Walman
Left Wings
#26

Alex Formenton
#53
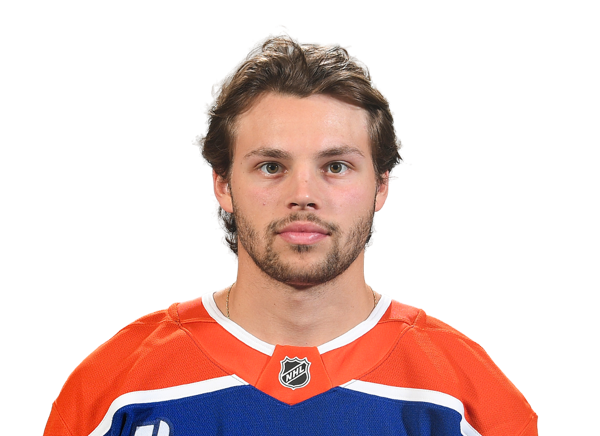
Isaac Howard
#18
Zach Hyman
#46

Max Jones
Centers
#34

Colton Dach
#16

Jason Dickinson
#29
Leon Draisaitl
#10
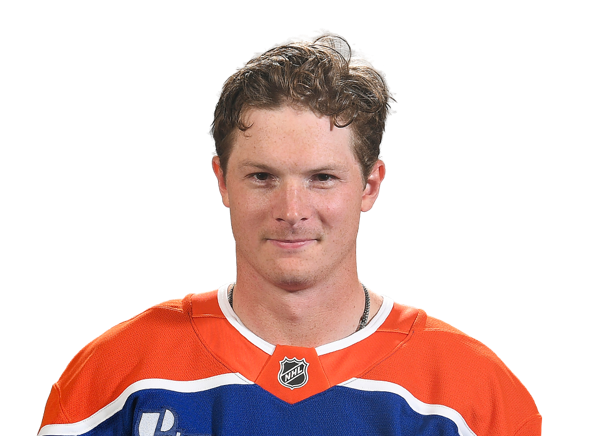
Trent Frederic
#19

Filip Hallander
#13
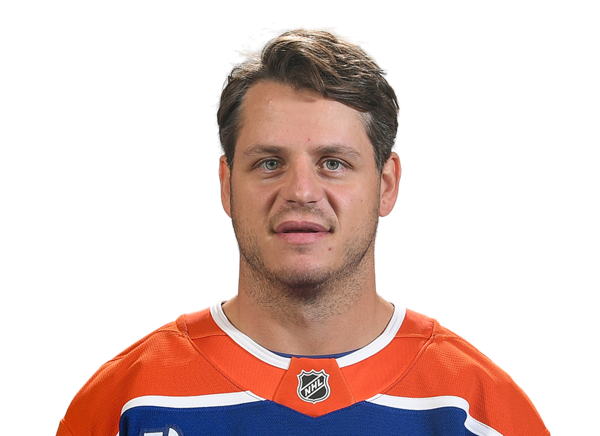
Mattias Janmark
#97
Connor McDavid
#43
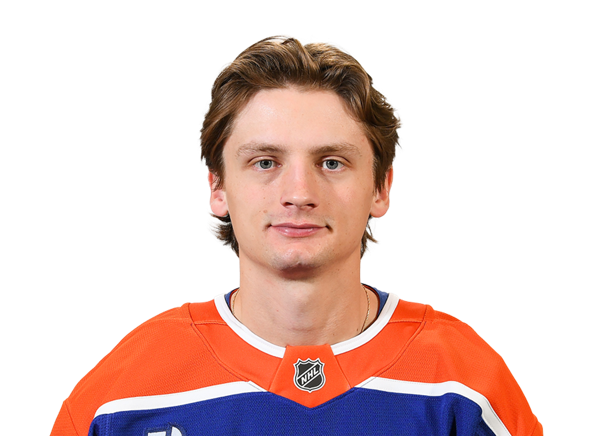
Owen Michaels
#93
Ryan Nugent-Hopkins
#22
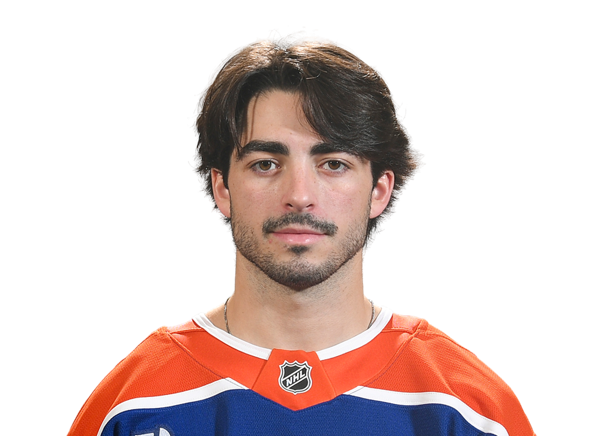
Matt Savoie
Right Wings
#21
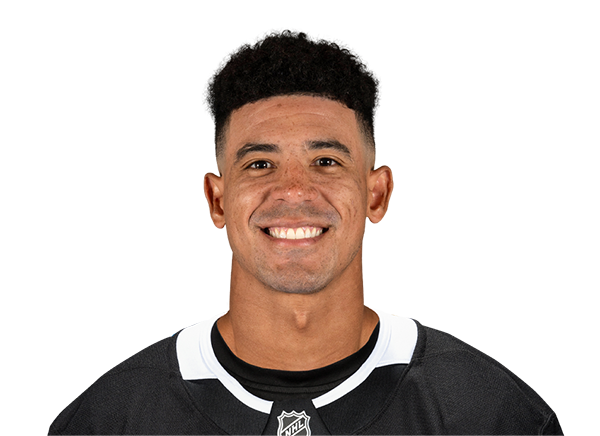
Mathieu Joseph
#42
Kasperi Kapanen
#92
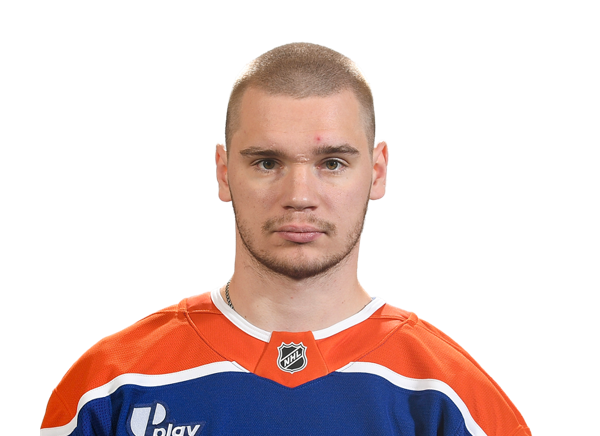
Vasily Podkolzin
Goaltenders
#1
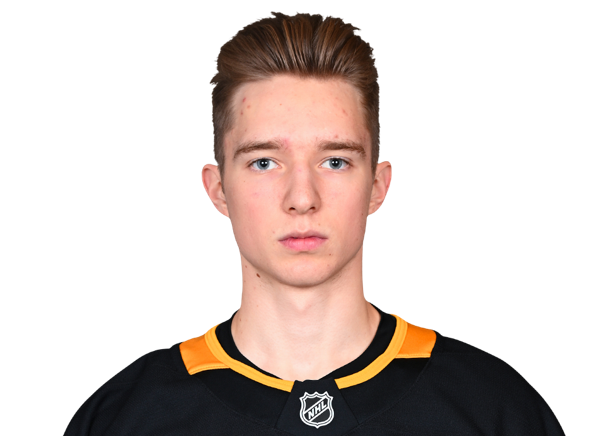
Sergei Murashov
#37
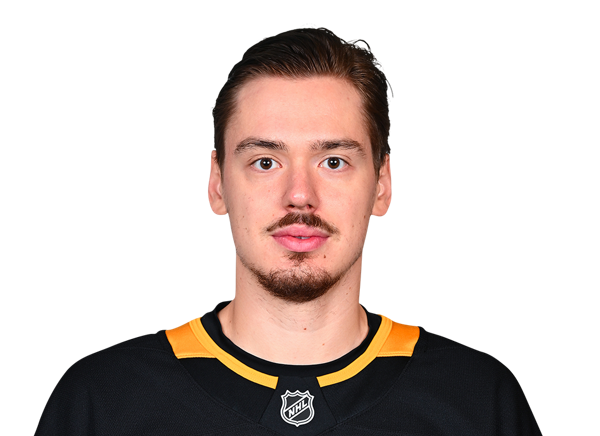
Arturs Silovs
Defensemen
#72
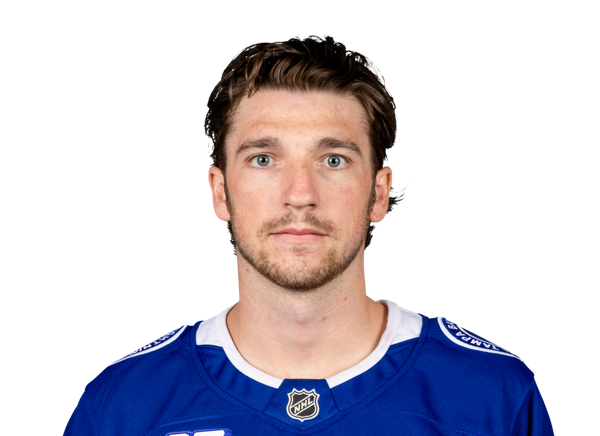
Declan Carlile
#49
Samuel Girard
#27

Ryan Graves
#65

Erik Karlsson
#6

Kaedan Korczak
#58
Kris Letang
#4
Jake Livanavage
#44
Chase Pietila
#7
Ilya Solovyov
#24
Spencer Stastney
#57
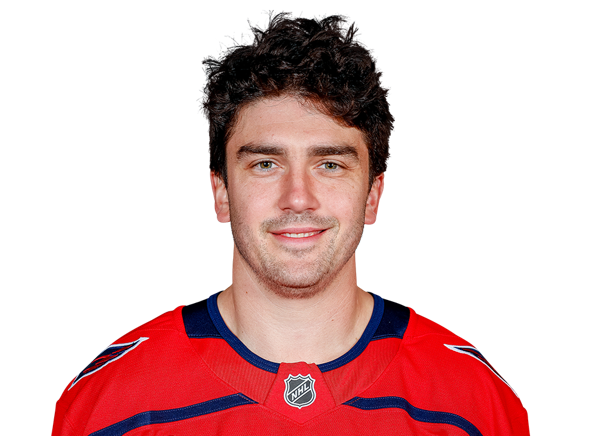
Trevor van Riemsdyk
Left Wings
#62

Andrei Kuzmenko
#14
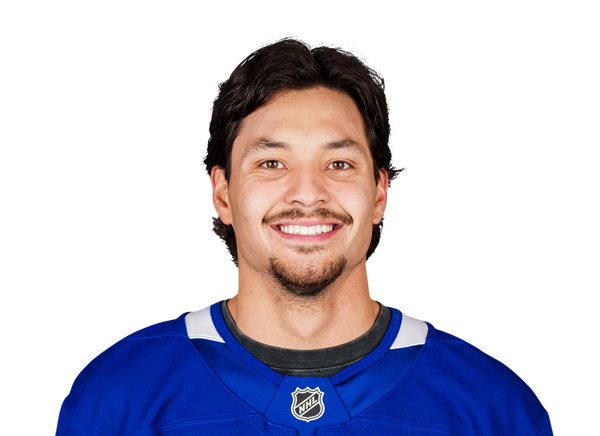
Nick Robertson
#25
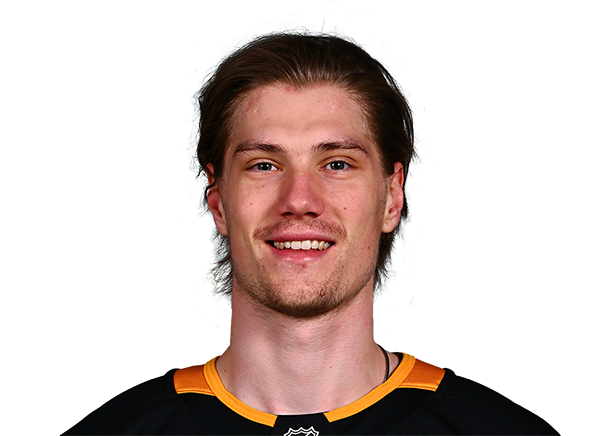
Elmer Soderblom
Centers
#87
Sidney Crosby
#19
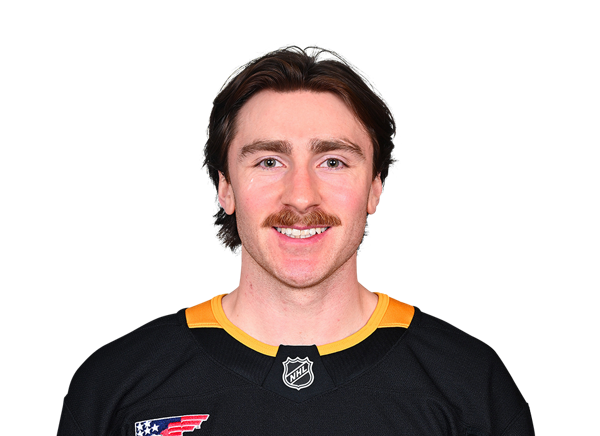
Connor Dewar
#81
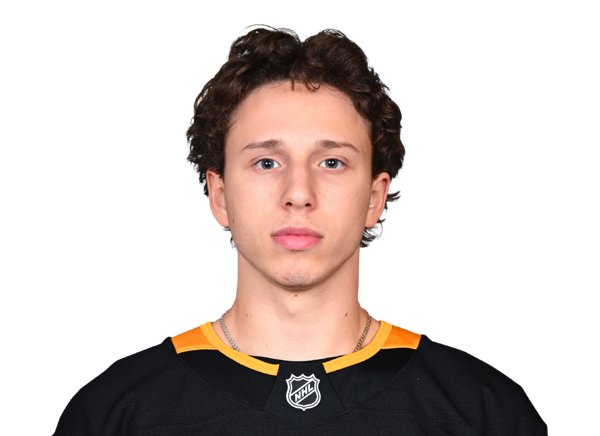
Ben Kindel
#22
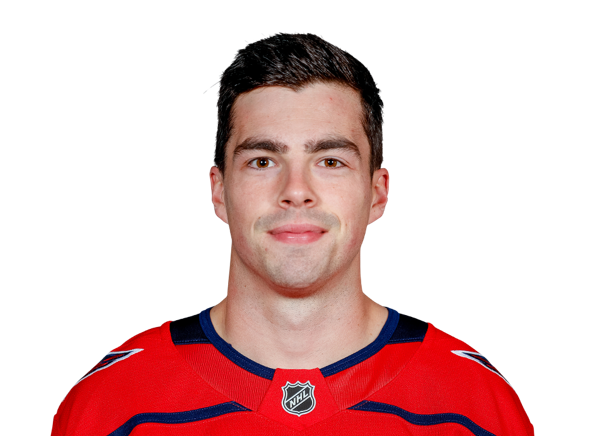
Hendrix Lapierre
#46
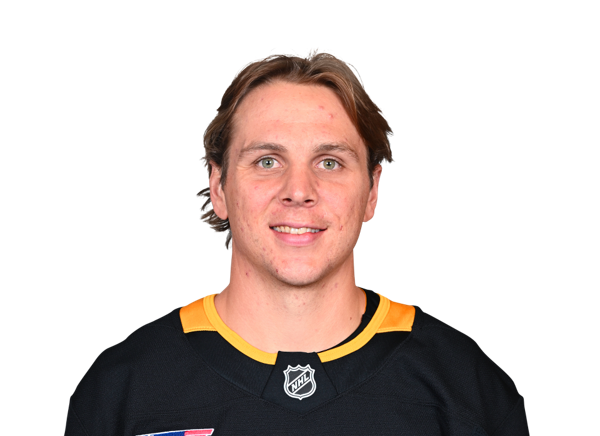
Blake Lizotte
#71
Evgeni Malkin
#18

Tommy Novak
Right Wings
#16
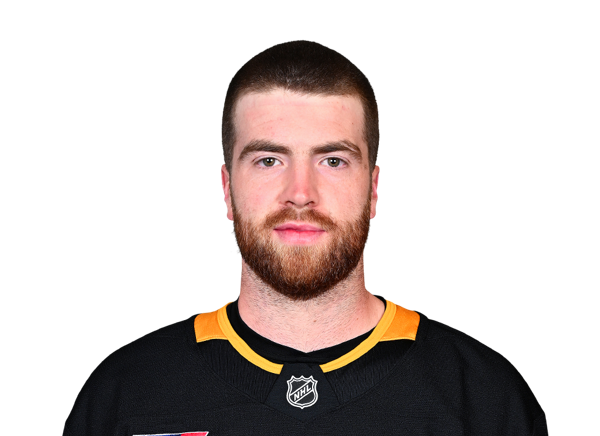
Justin Brazeau
#59

Egor Chinakhov
#85
Avery Hayes
#41

Ville Koivunen
#67
Rickard Rakell
#17
Bryan Rust
Oilers
1st in Pacific Division
VS
Penguins
6th in Metropolitan Division
General
16
Games Played
15
5753:02
Time On Ice
5391:28
359:33
Time On Ice Per Game
359:25
0
Plus/Minus Rating
0
0:00
Production
0:00
6568
Shifts
5406
2
Losses
8
11
Wins
5
Offensive
66
Goals
48
107
Assists
85
437
Faceoffs Won
387
458
Faceoffs Lost
462
0
Game-Winning Goals
0
173
Points
133
19
Power Play Goals
8
37
Power Play Assists
16
2
Short Handed Goals
2
0
Short Handed Assists
2
409
Shots
420
7
Shootout Attempts
7
1
Shootout Goals
3
14.3
Shootout Shot Percentage
42.9
16.1
Shooting Percentage
11.4
48.8
Faceoff Win Percent
45.6
Defensive
2.88
Goals Against Average
3.40
383
Saves
365
.897
Save Percentage
.882
46
Goals Against
51
429
Shots Against
415
3
Overtime Losses
2
3
Shootout Saves
4
6
Shootout Shots Against
7
.500
Shootout Save Percentage
.571
Penalties
138
Penalty Minutes
100