

Penguins vs Flyers Live Score (24 Apr, 2022)
Score by Period
| Team | 1st | 2nd | 3rd | Total |
|---|---|---|---|---|
 PIT | 0 | 0 | 1 | 1 |
 PHI | 1 | 1 | 2 | 4 |
Play-by-Play
3rd Period 20:00
1–4
3rd Period 20:00
1–4
3rd Period 19:59
1–4
3rd Period 19:54
1–4
3rd Period 19:46
1–4
3rd Period 19:43
1–4
3rd Period 19:20
1–4
3rd Period 19:16
1–4
3rd Period 18:55
1–4
3rd Period 18:53
1–4
3rd Period 18:41
1–4
3rd Period 18:41
1–4
3rd Period 18:40
1–4
3rd Period 18:15
1–4
3rd Period 17:47
1–4
3rd Period 17:26
1–4
3rd Period 17:26
1–4
3rd Period 17:06
1–3
3rd Period 16:58
1–3
3rd Period 16:49
1–3
3rd Period 16:27
1–3
3rd Period 16:27
1–3
3rd Period 16:23
0–3
3rd Period 14:53
0–3
Scoring Summary
1st Period
15:49
Morgan Frost
Assists: Noah Cates, Owen Tippett
0 - 1
2nd Period
6:49
Noah Cates
Assists: Keith Yandle, Morgan Frost
0 - 2
3rd Period
9:38
Noah Cates
Assists: Keith Yandle, Ivan Provorov
0 - 3
16:27
Sidney Crosby
Assists: Evgeni Malkin, Jake Guentzel
1 - 3
17:26
Travis Konecny
Assists: Linus Hogberg, Kevin Hayes
1 - 4
Team Stats
PIT
PHI

16
Blocked Shots
19
12
Hits
24
9
Takeaways
6
9
Giveaways
7
0
Power Play Goals
1
2
Power Play Opportunities
3
38
Total Shots
43
6
Penalty Minutes
4
0.0
Power Play %
33.3
0
Short Handed Goals
0
0
Shootout Goals
0
36
Faceoffs Won
36
50.0
Faceoff Percent
50.0
3
Penalties
2
Game Leaders
PIT
PHI
Player Box Score
Penguins| Player | BS | HT | TK | +/- | TOI | PPTOI | SHTOI | ESTOI | SHFT | G | YTDG | A | S | SM | SOG | FW | FL | FO% | GV | PN | PIM |
|---|---|---|---|---|---|---|---|---|---|---|---|---|---|---|---|---|---|---|---|---|---|
 Teddy Blueger#53 · C | 1 | 0 | 1 | 0 | 14:36 | 0:00 | 3:16 | 11:20 | 17 | 0 | 9 | 0 | 2 | 1 | 0 | 4 | 7 | 36.4 | 0 | 0 | 0 |
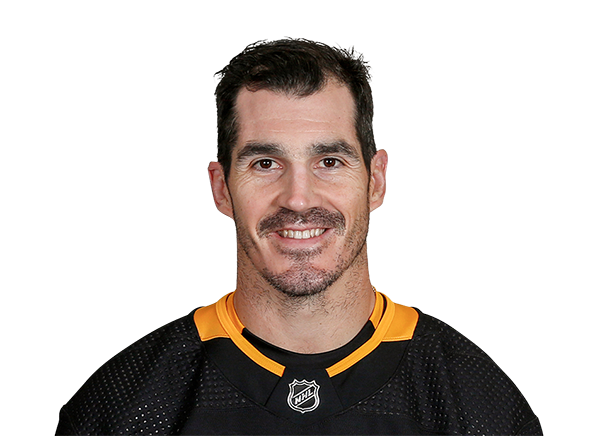 Brian Boyle#11 · C | 0 | 0 | 0 | 0 | 9:12 | 0:00 | 0:24 | 8:48 | 14 | 0 | 10 | 0 | 1 | 0 | 0 | 1 | 1 | 50.0 | 0 | 0 | 0 |
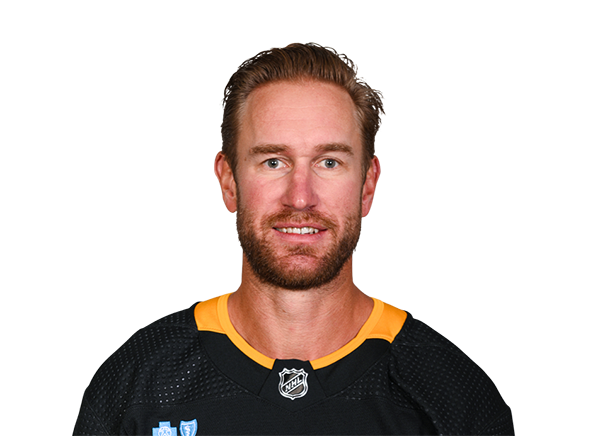 Jeff Carter#77 · C | 1 | 0 | 0 | -1 | 16:12 | 0:37 | 2:36 | 12:59 | 23 | 0 | 18 | 0 | 2 | 0 | 0 | 10 | 6 | 62.5 | 0 | 0 | 0 |
 Sidney Crosby#87 · C | 1 | 0 | 2 | 0 | 18:32 | 2:59 | 0:00 | 15:33 | 23 | 1 | 31 | 0 | 4 | 1 | 0 | 10 | 17 | 37.0 | 0 | 0 | 0 |
 Jake Guentzel#59 · C | 0 | 0 | 2 | 0 | 19:53 | 3:20 | 0:00 | 16:33 | 24 | 0 | 40 | 1 | 3 | 1 | 0 | 0 | 0 | 0.0 | 0 | 1 | 2 |
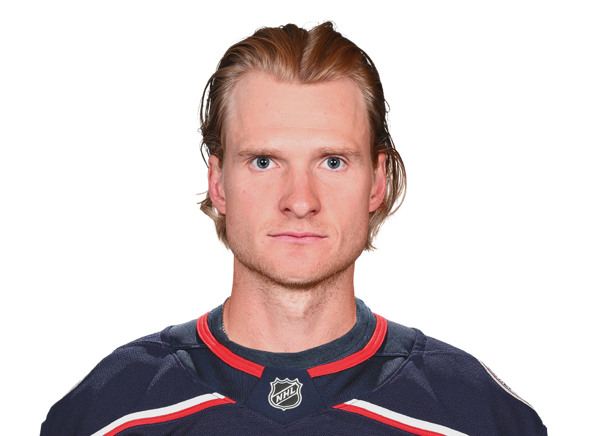 Danton Heinen#43 · LW | 0 | 0 | 0 | -1 | 11:03 | 0:00 | 0:00 | 11:03 | 15 | 0 | 18 | 0 | 2 | 0 | 0 | 0 | 0 | 0.0 | 0 | 0 | 0 |
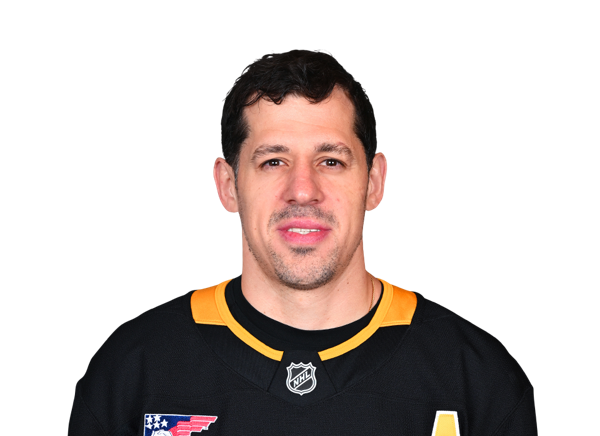 Evgeni Malkin#71 · C | 2 | 0 | 0 | -1 | 17:03 | 3:20 | 0:00 | 13:43 | 21 | 0 | 19 | 1 | 4 | 2 | 0 | 11 | 4 | 73.3 | 1 | 0 | 0 |
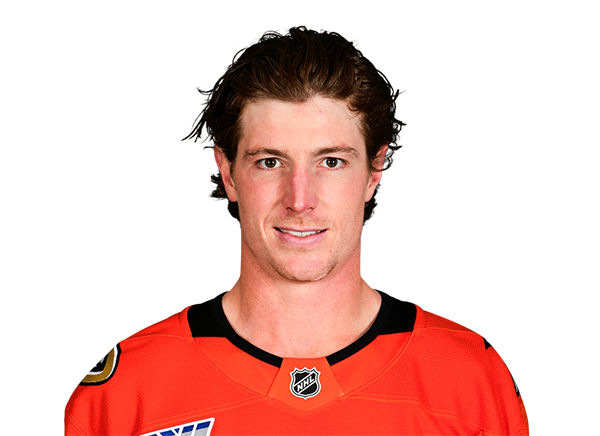 Brock McGinn#23 · LW | 1 | 2 | 1 | 0 | 14:27 | 0:00 | 2:44 | 11:43 | 20 | 0 | 12 | 0 | 0 | 0 | 0 | 0 | 0 | 0.0 | 1 | 0 | 0 |
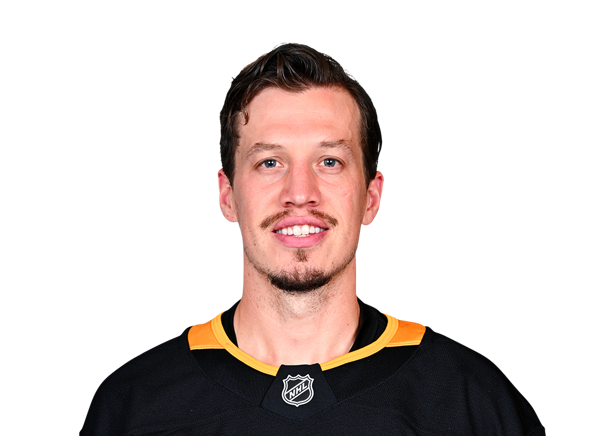 Rickard Rakell#67 · RW | 0 | 1 | 1 | 0 | 15:01 | 0:40 | 0:00 | 14:21 | 22 | 0 | 20 | 0 | 2 | 0 | 0 | 0 | 0 | 0.0 | 0 | 0 | 0 |
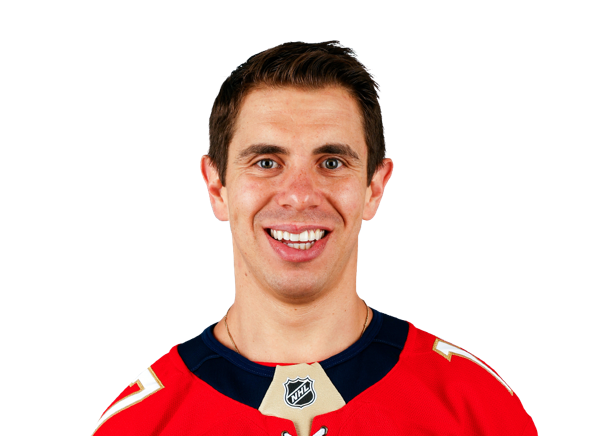 Evan Rodrigues#9 · C | 1 | 2 | 0 | -1 | 12:45 | 1:01 | 0:00 | 11:44 | 17 | 0 | 18 | 0 | 1 | 1 | 0 | 0 | 0 | 0.0 | 0 | 0 | 0 |
 Bryan Rust#17 · RW | 1 | 2 | 0 | -1 | 19:04 | 3:23 | 2:43 | 12:58 | 24 | 0 | 24 | 0 | 2 | 3 | 0 | 0 | 0 | 0.0 | 1 | 0 | 0 |
 Jason Zucker#16 · LW | 0 | 1 | 0 | -1 | 12:54 | 0:29 | 0:00 | 12:25 | 21 | 0 | 8 | 0 | 2 | 0 | 0 | 0 | 1 | 0.0 | 0 | 0 | 0 |
Flyers| Player | BS | HT | TK | +/- | TOI | PPTOI | SHTOI | ESTOI | SHFT | G | YTDG | A | S | SM | SOG | FW | FL | FO% | GV | PN | PIM |
|---|---|---|---|---|---|---|---|---|---|---|---|---|---|---|---|---|---|---|---|---|---|
 Bobby Brink#46 · RW | 0 | 1 | 0 | 0 | 17:41 | 4:04 | 0:00 | 13:37 | 24 | 0 | 0 | 0 | 3 | 0 | 0 | 0 | 0 | 0.0 | 1 | 0 | 0 |
 Noah Cates#49 · LW | 2 | 1 | 0 | 2 | 11:17 | 0:08 | 0:27 | 10:42 | 21 | 2 | 5 | 1 | 6 | 1 | 0 | 0 | 0 | 0.0 | 0 | 0 | 0 |
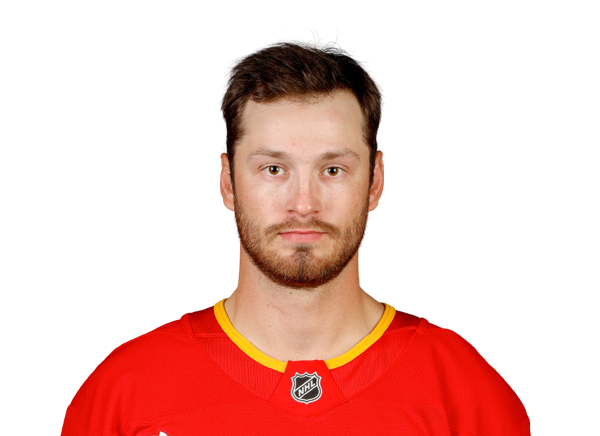 Joel Farabee#86 · LW | 0 | 2 | 1 | -1 | 19:34 | 4:04 | 1:04 | 14:26 | 27 | 0 | 17 | 0 | 4 | 0 | 0 | 1 | 8 | 11.1 | 0 | 0 | 0 |
 Morgan Frost#48 · C | 0 | 3 | 0 | 2 | 12:46 | 1:48 | 0:00 | 10:58 | 22 | 1 | 5 | 1 | 3 | 0 | 0 | 7 | 8 | 46.7 | 0 | 0 | 0 |
 Kevin Hayes#13 · RW | 0 | 0 | 1 | 1 | 21:46 | 4:04 | 1:29 | 16:13 | 27 | 0 | 9 | 1 | 0 | 2 | 0 | 10 | 8 | 55.6 | 0 | 0 | 0 |
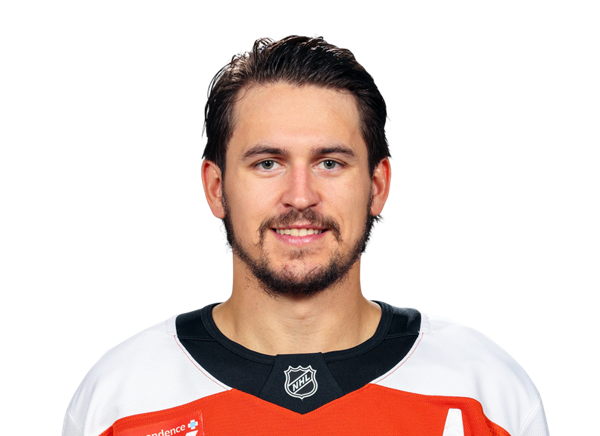 Travis Konecny#11 · RW | 0 | 1 | 1 | 1 | 20:22 | 4:04 | 0:26 | 15:52 | 27 | 1 | 16 | 0 | 6 | 2 | 0 | 0 | 0 | 0.0 | 0 | 0 | 0 |
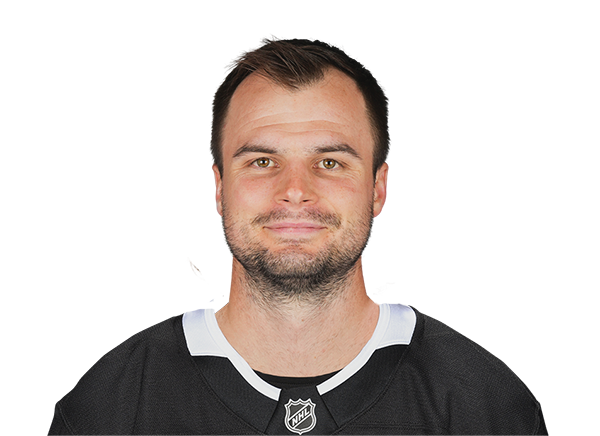 Scott Laughton#21 · C | 1 | 2 | 0 | 1 | 19:32 | 1:24 | 2:30 | 15:38 | 25 | 0 | 11 | 0 | 2 | 1 | 0 | 5 | 5 | 50.0 | 0 | 0 | 0 |
 Oskar Lindblom#23 · LW | 0 | 5 | 0 | -1 | 9:57 | 0:00 | 0:00 | 9:57 | 16 | 0 | 12 | 0 | 1 | 0 | 0 | 0 | 0 | 0.0 | 0 | 0 | 0 |
 Zack MacEwen#17 · C | 0 | 1 | 0 | 0 | 8:58 | 0:00 | 0:00 | 8:58 | 14 | 0 | 3 | 0 | 1 | 0 | 0 | 1 | 0 | 100.0 | 0 | 0 | 0 |
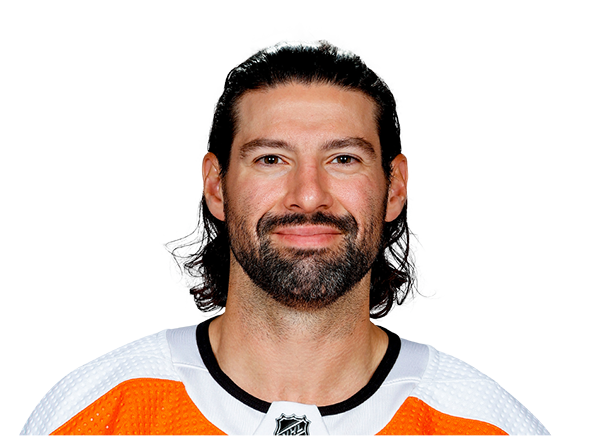 Nate Thompson#44 · C | 4 | 1 | 0 | -1 | 12:23 | 0:00 | 2:04 | 10:19 | 20 | 0 | 1 | 0 | 0 | 0 | 0 | 12 | 6 | 66.7 | 0 | 0 | 0 |
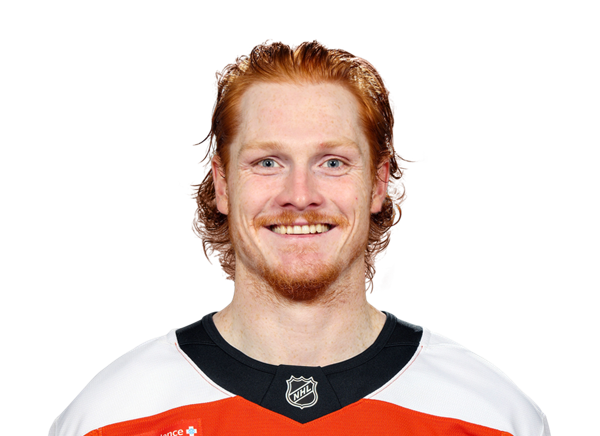 Owen Tippett#74 · RW | 0 | 2 | 0 | 2 | 12:35 | 1:48 | 0:00 | 10:47 | 20 | 0 | 9 | 1 | 5 | 0 | 0 | 0 | 0 | 0.0 | 1 | 0 | 0 |
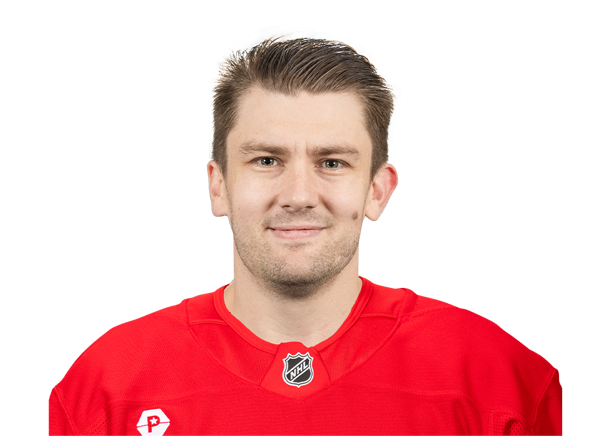 James van Riemsdyk#25 · LW | 1 | 0 | 1 | 0 | 14:19 | 1:40 | 0:00 | 12:39 | 22 | 0 | 23 | 0 | 3 | 0 | 0 | 0 | 1 | 0.0 | 0 | 0 | 0 |
Penguins| Player | BS | HT | TK | +/- | TOI | PPTOI | SHTOI | ESTOI | SHFT | G | YTDG | A | S | SM | SOG | FW | FL | FO% | GV | PN | PIM |
|---|---|---|---|---|---|---|---|---|---|---|---|---|---|---|---|---|---|---|---|---|---|
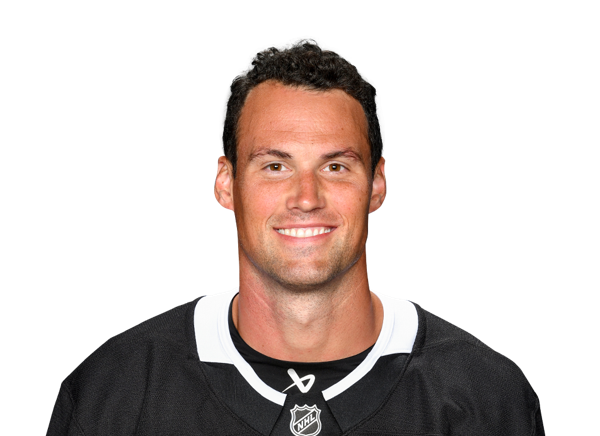 Brian Dumoulin#8 · D | 1 | 0 | 0 | -1 | 20:56 | 0:00 | 3:42 | 17:14 | 28 | 0 | 3 | 0 | 2 | 0 | 0 | 0 | 0 | 0.0 | 0 | 0 | 0 |
 Kris Letang#58 · D | 2 | 1 | 0 | -1 | 26:00 | 3:38 | 2:11 | 20:11 | 28 | 0 | 9 | 0 | 3 | 2 | 0 | 0 | 0 | 0.0 | 1 | 0 | 0 |
 John Marino#6 · D | 1 | 0 | 1 | 0 | 19:58 | 0:11 | 2:19 | 17:28 | 26 | 0 | 1 | 0 | 3 | 1 | 0 | 0 | 0 | 0.0 | 0 | 1 | 2 |
 Mike Matheson#5 · D | 1 | 1 | 0 | -1 | 19:31 | 0:22 | 0:34 | 18:35 | 28 | 0 | 11 | 0 | 3 | 0 | 0 | 0 | 0 | 0.0 | 0 | 1 | 2 |
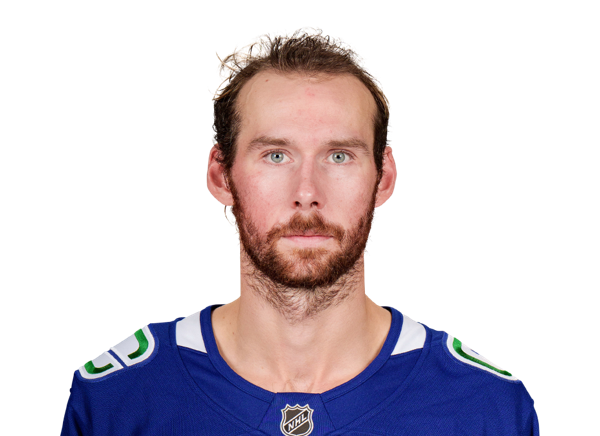 Marcus Pettersson#28 · D | 1 | 1 | 0 | 0 | 12:52 | 0:00 | 0:00 | 12:52 | 18 | 0 | 1 | 0 | 2 | 1 | 0 | 0 | 0 | 0.0 | 1 | 0 | 0 |
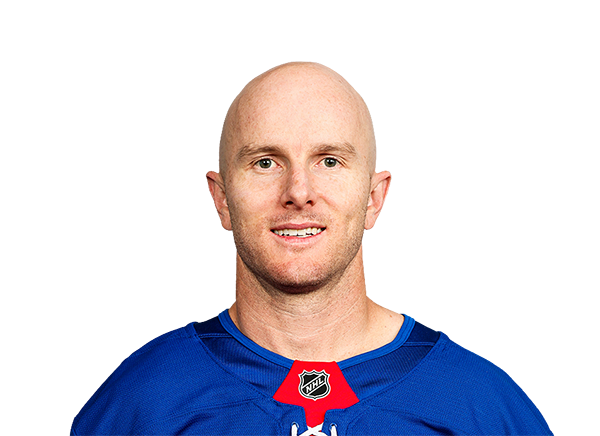 Chad Ruhwedel#2 · D | 2 | 1 | 1 | -1 | 16:01 | 0:00 | 2:59 | 13:02 | 24 | 0 | 4 | 0 | 0 | 1 | 0 | 0 | 0 | 0.0 | 2 | 0 | 0 |
Flyers| Player | BS | HT | TK | +/- | TOI | PPTOI | SHTOI | ESTOI | SHFT | G | YTDG | A | S | SM | SOG | FW | FL | FO% | GV | PN | PIM |
|---|---|---|---|---|---|---|---|---|---|---|---|---|---|---|---|---|---|---|---|---|---|
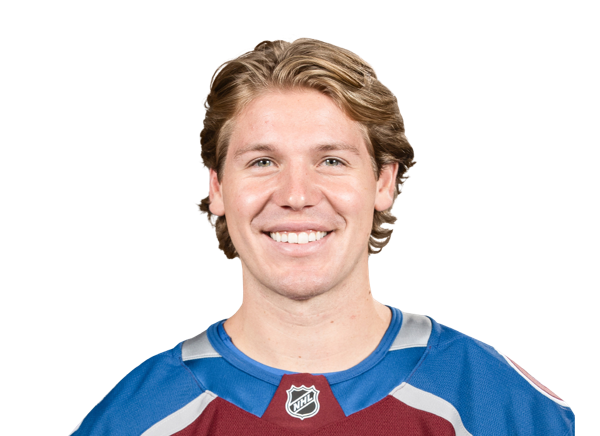 Ronnie Attard#47 · D | 5 | 1 | 1 | 1 | 20:05 | 0:00 | 2:00 | 18:05 | 27 | 0 | 2 | 0 | 3 | 0 | 0 | 0 | 0 | 0.0 | 0 | 1 | 2 |
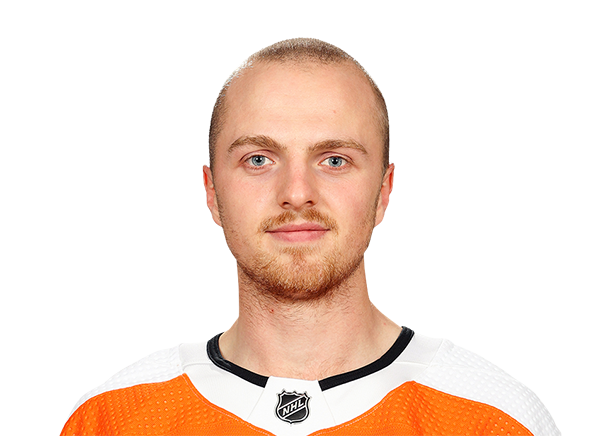 Linus Hogberg#84 · D | 0 | 0 | 1 | 0 | 19:18 | 0:00 | 0:13 | 19:05 | 26 | 0 | 0 | 1 | 1 | 0 | 0 | 0 | 0 | 0.0 | 2 | 0 | 0 |
 Ivan Provorov#9 · D | 2 | 0 | 0 | 1 | 25:03 | 2:23 | 1:29 | 21:11 | 31 | 0 | 9 | 1 | 3 | 0 | 0 | 0 | 0 | 0.0 | 1 | 1 | 2 |
 Travis Sanheim#6 · D | 2 | 2 | 0 | 1 | 26:48 | 3:29 | 3:47 | 19:32 | 31 | 0 | 7 | 0 | 0 | 0 | 0 | 0 | 0 | 0.0 | 1 | 0 | 0 |
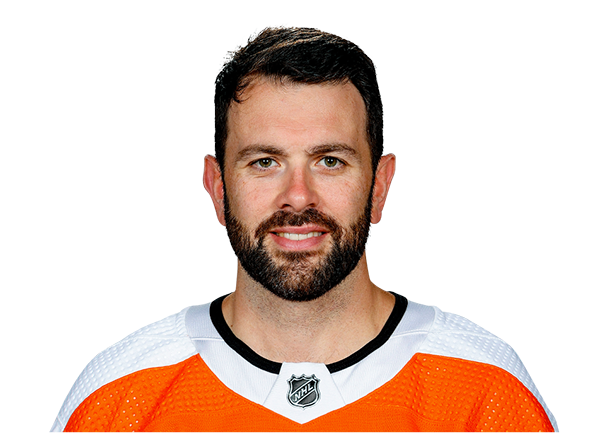 Keith Yandle#3 · D | 1 | 0 | 0 | 1 | 11:38 | 0:24 | 0:00 | 11:14 | 19 | 0 | 1 | 2 | 2 | 0 | 0 | 0 | 0 | 0.0 | 1 | 0 | 0 |
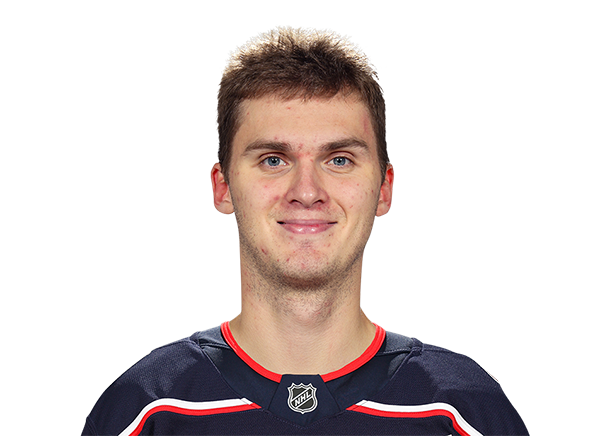 Egor Zamula#54 · D | 1 | 2 | 0 | 0 | 11:58 | 0:00 | 0:31 | 11:27 | 17 | 0 | 0 | 0 | 0 | 0 | 0 | 0 | 0 | 0.0 | 0 | 0 | 0 |
Penguins| Player | GA | SA | SOS | SOSA | SV | SV% | ESSV | PPSV | SHSV | TOI | YTDG | PIM |
|---|---|---|---|---|---|---|---|---|---|---|---|---|
 Louis Domingue#70 · G | 3 | 42 | 0 | 0 | 39 | .929 | 32 | 1 | 6 | 58:08 | 0 | 0 |
Flyers| Player | GA | SA | SOS | SOSA | SV | SV% | ESSV | PPSV | SHSV | TOI | YTDG | PIM |
|---|---|---|---|---|---|---|---|---|---|---|---|---|
 Martin Jones#35 · G | 1 | 38 | 0 | 0 | 37 | .974 | 30 | 2 | 5 | 60:00 | 0 | 0 |
Injury Report
Head-to-Head
PITLast 5 Games
PHI
5◂
NHL Regular Season
FINAL
Feb 15, 2022
4
6◂
NHL Regular Season
FINAL
Jan 6, 2022
2
0
NHL Regular Season
FINAL
Dec 23, 2021
0
3◂
NHL Regular Season
FINAL
Nov 4, 2021
2
7◂
NHL Regular Season
FINAL
May 4, 2021
3
Last 5 Games








Game Information
Stage
Regular Season
Season
2022
Puck Drop
Sun, Apr 24, 4:00 PM
Venue
Xfinity Mobile Arena
Location
Philadelphia, PA
Attendance
18,601
Officials
Chris Lee · Referee, Kevin Pollock · Referee, Mark Shewchyk · Linesman
Division Standings
Eastern Conference — Metropolitan Division
| Team | GP | W | L | OT | Pct | PTS | DIFF | Strk |
|---|---|---|---|---|---|---|---|---|
 Hurricanes | 82 | 53 | 22 | 7 | — | 113 | +56 | W1 |
| Penguins | 82 | 41 | 25 | 16 | — | 98 | +25 | L3 |
| Flyers | 82 | 43 | 27 | 12 | — | 98 | +7 | W3 |
 Capitals | 82 | 43 | 30 | 9 | — | 95 | +19 | W4 |
 Blue Jackets | 82 | 40 | 30 | 12 | — | 92 | 0 | L2 |
 Islanders | 82 | 43 | 34 | 5 | — | 91 | -8 | L3 |
 Devils | 82 | 42 | 37 | 3 | — | 87 | -24 | L1 |
 Rangers | 82 | 34 | 39 | 9 | — | 77 | -12 | W1 |
Penguins
14th in Eastern Conference
VS
Flyers
14th in Eastern Conference
Goaltenders
#1
Sergei Murashov
#37
Arturs Silovs
Defensemen
#72
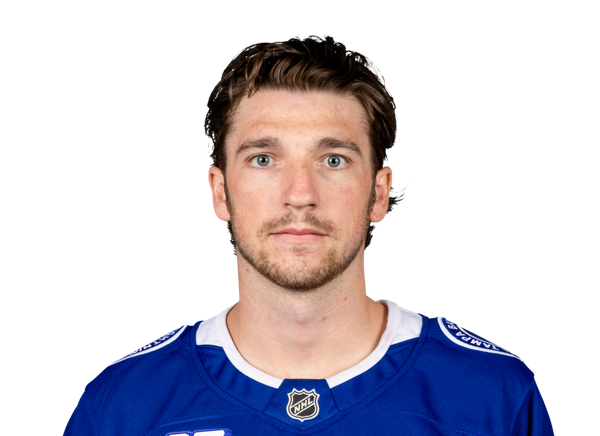
Declan Carlile
#49
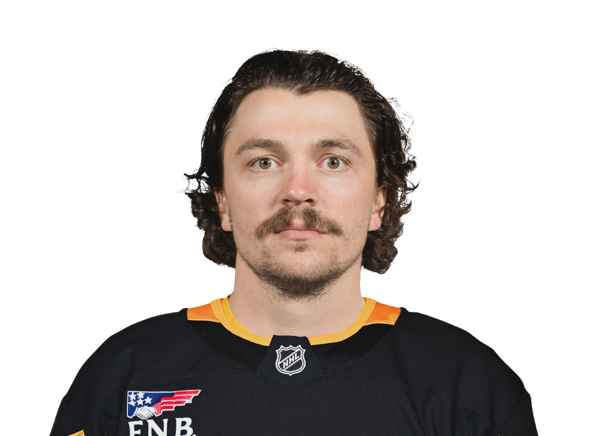
Samuel Girard
#27

Ryan Graves
#65

Erik Karlsson
#6

Kaedan Korczak
#58
Kris Letang
#4

Jake Livanavage
#44
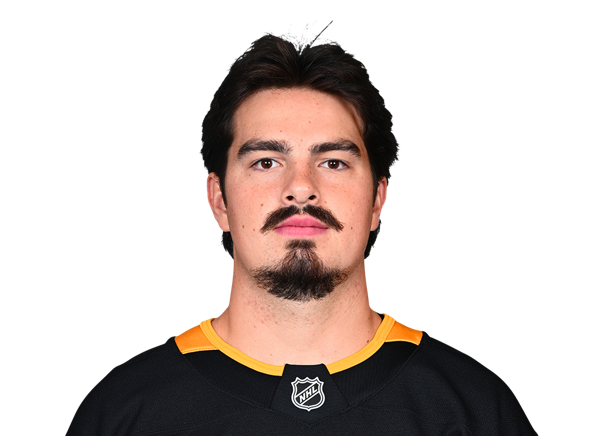
Chase Pietila
#7
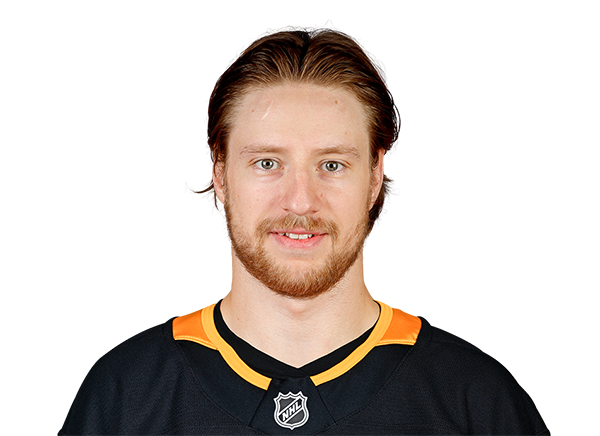
Ilya Solovyov
#24
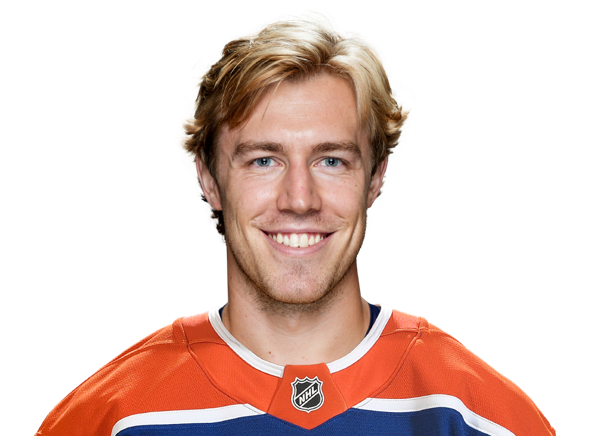
Spencer Stastney
#57
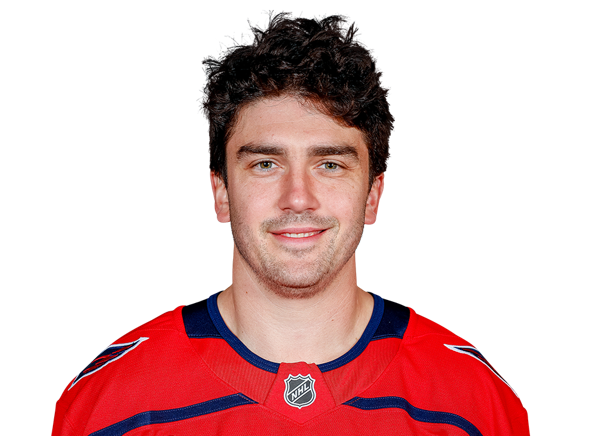
Trevor van Riemsdyk
Left Wings
#62

Andrei Kuzmenko
#14
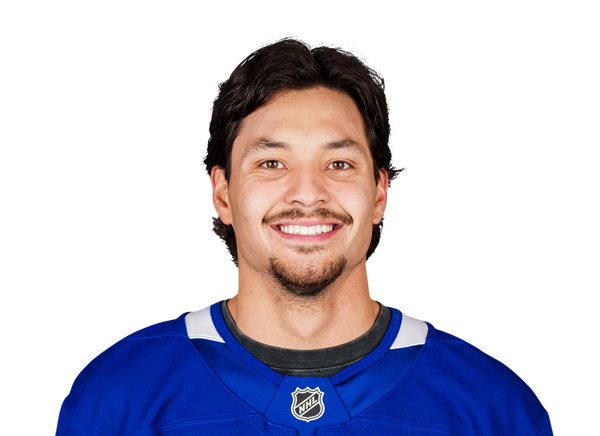
Nick Robertson
#25
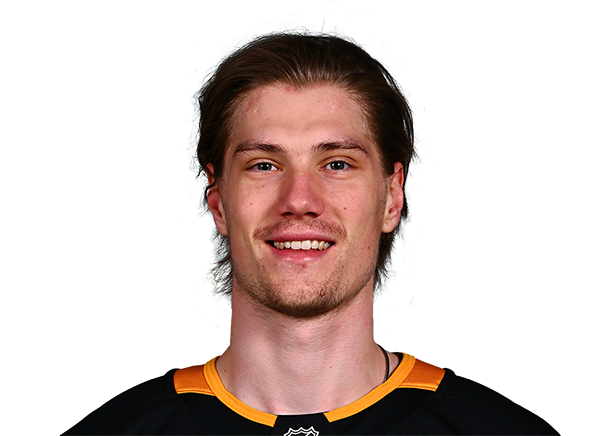
Elmer Soderblom
Centers
#87
Sidney Crosby
#19
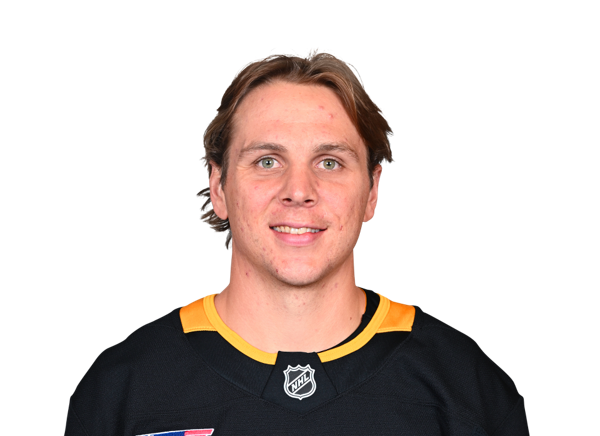
Connor Dewar
#81
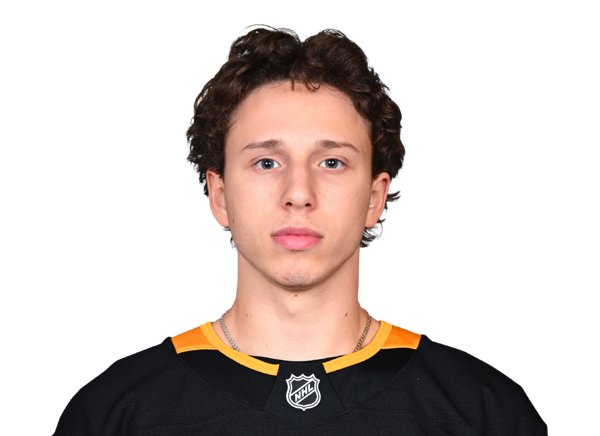
Ben Kindel
#22
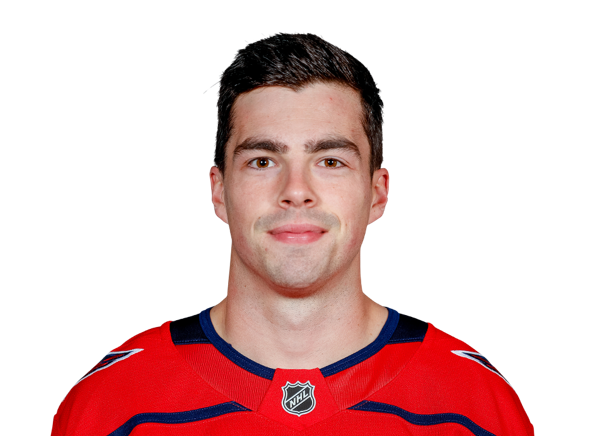
Hendrix Lapierre
#46
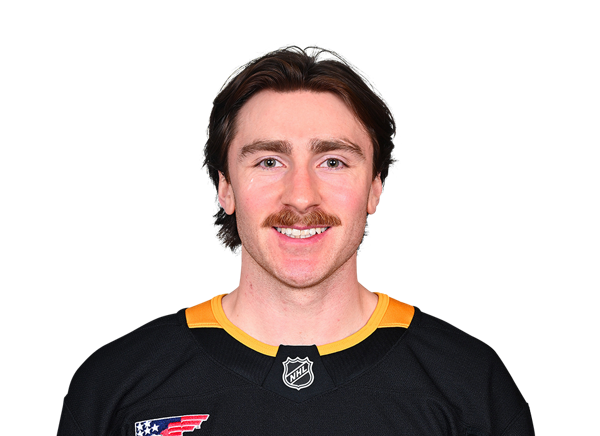
Blake Lizotte
#71
Evgeni Malkin
#18

Tommy Novak
Right Wings
#16
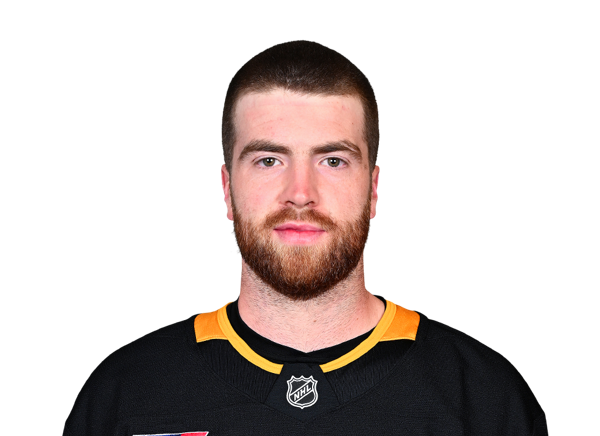
Justin Brazeau
#59

Egor Chinakhov
#85
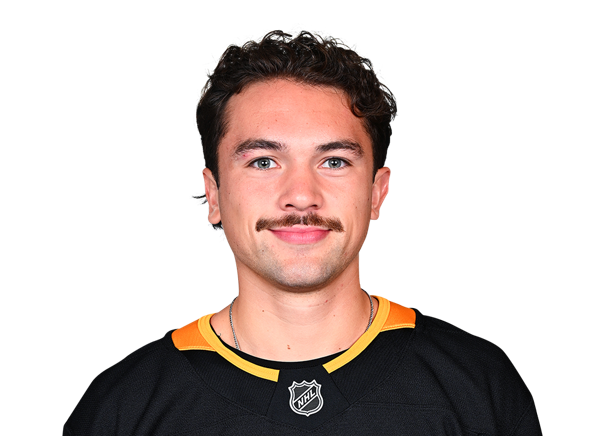
Avery Hayes
#41
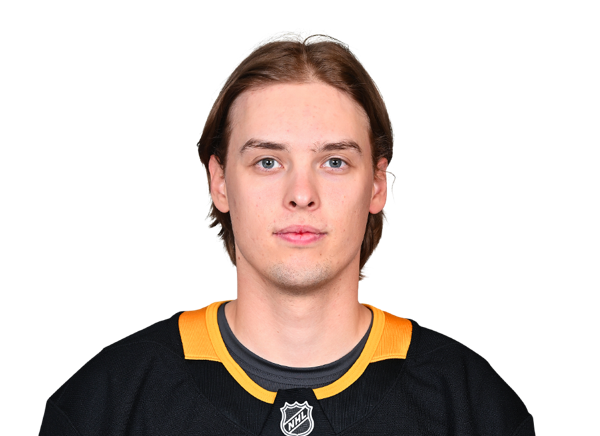
Ville Koivunen
#67
Rickard Rakell
#17
Bryan Rust
Goaltenders
#80

Dan Vladar
#53
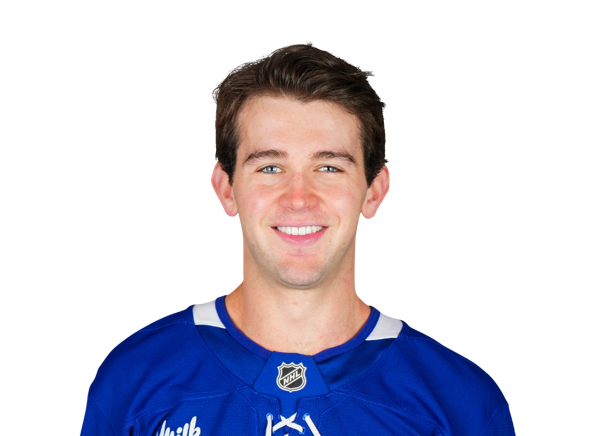
Joseph Woll
Defensemen
#44
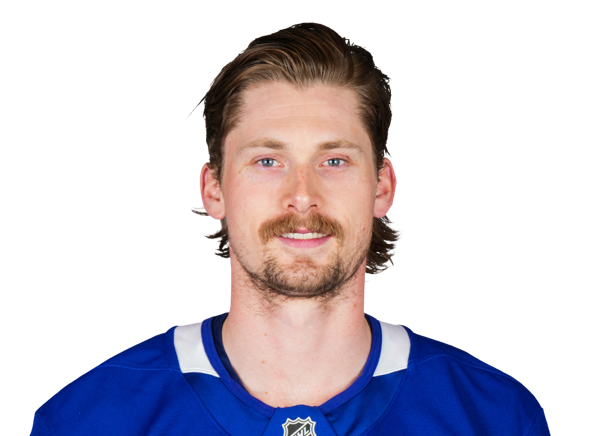
Simon Benoit
#59
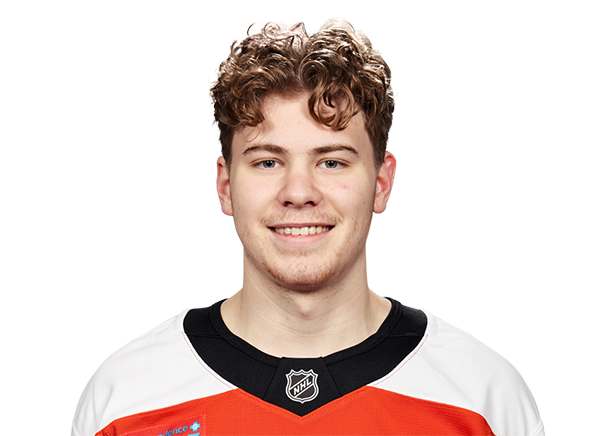
Oliver Bonk
#9

Jamie Drysdale
#3

Helge Grans
#5

David Jiricek
#55
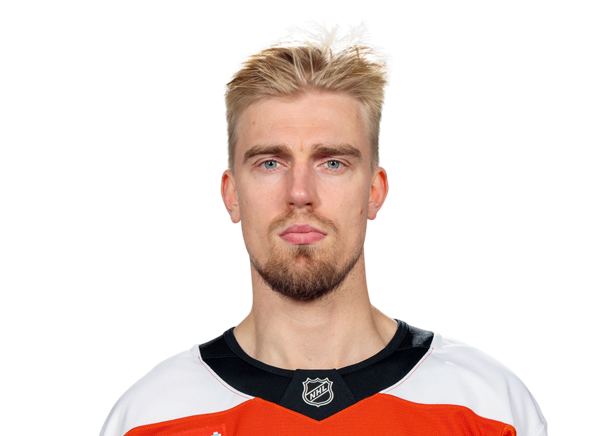
Rasmus Ristolainen
#6
Travis Sanheim
#24

Nick Seeler
#8
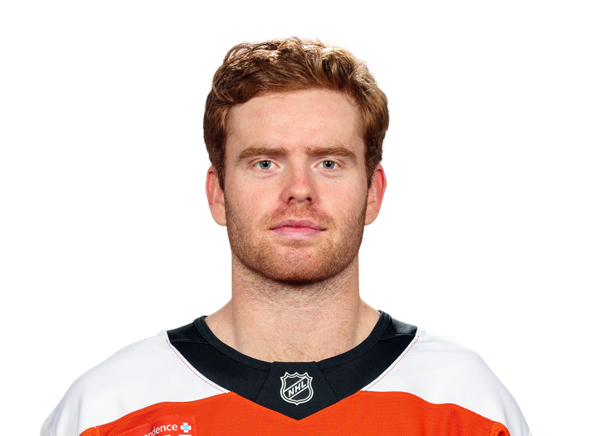
Cam York
Left Wings
#20

Alex Bump
#58

Michael Bunting
#27
Noah Cates
Centers
#52

Noel Acciari
#86
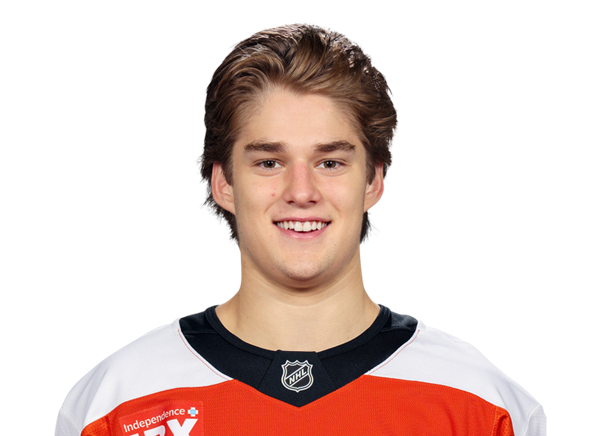
Denver Barkey
#14

Sean Couturier
#22

Christian Dvorak
#17

Jett Luchanko
#46

Trevor Zegras
Right Wings
#71
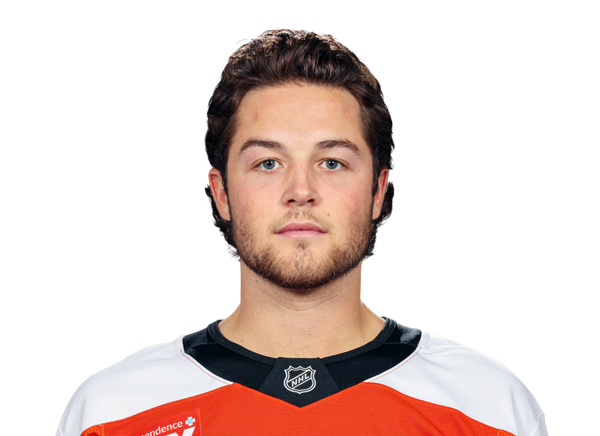
Tyson Foerster
#54

Cole Knuble
#11
Travis Konecny
#94
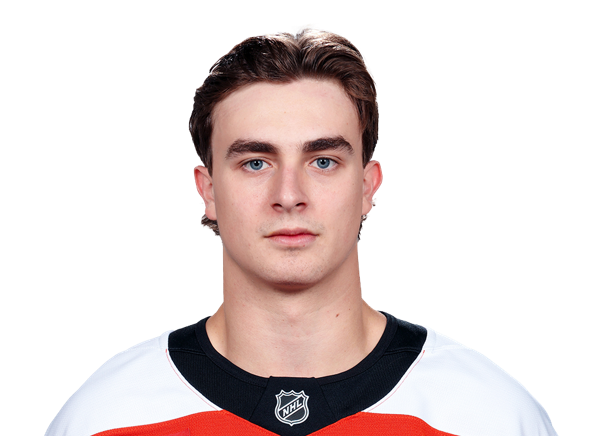
Porter Martone
#39
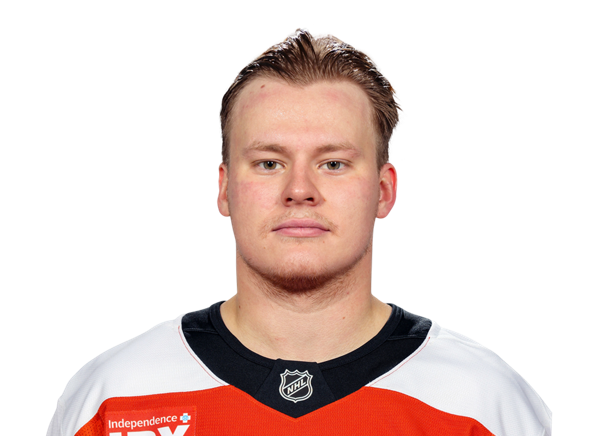
Matvei Michkov
#74
Owen Tippett
Penguins
6th in Metropolitan Division
VS
Flyers
6th in Metropolitan Division
General
15
Games Played
17
5391:28
Time On Ice
6067:33
359:25
Time On Ice Per Game
356:54
0
Plus/Minus Rating
0
0:00
Production
0:00
5406
Shifts
6451
8
Losses
9
5
Wins
4
Offensive
48
Goals
37
85
Assists
66
387
Faceoffs Won
493
462
Faceoffs Lost
481
0
Game-Winning Goals
0
133
Points
103
8
Power Play Goals
9
16
Power Play Assists
18
2
Short Handed Goals
1
2
Short Handed Assists
1
420
Shots
398
7
Shootout Attempts
5
3
Shootout Goals
1
42.9
Shootout Shot Percentage
20.0
11.4
Shooting Percentage
9.3
45.6
Faceoff Win Percent
50.6
Defensive
3.40
Goals Against Average
3.35
365
Saves
441
.882
Save Percentage
.891
51
Goals Against
57
415
Shots Against
498
2
Overtime Losses
4
4
Shootout Saves
3
7
Shootout Shots Against
5
.571
Shootout Save Percentage
.600
Penalties
100
Penalty Minutes
172